
The Impact of Limited Carbon Emission on Supply Chain and
Emission Cost
Thina Ardliana
1,2
a
, I Nyoman Pujawan
2
b
and Nurhadi Siswanto
2
c
1
Design and Manufacture Engineering, Shipbuilding Institute of Polytechnic Surabaya, Surabaya, Indonesia
2
Department of System and Industrial Engineering, Sepuluh Nopember Institute of Technology, Surabaya, Indonesia
Keywords: Carbon Emission Policies, Supply Chain, Inventory.
Abstract: Nowadays, the effects of global warming are at a critical point and have threatened the destruction of the
earth's ecosystems. The most dangerous cause of global warming is carbon. This problem seriously forces the
countries of the world to focus on reducing carbon emissions. The commitments are binding for all countries,
so they have limited CO2. Transportation is one of the largest sources of emissions from activities in the
supply chain. The transportation issue should be investigated at the same time inventory decisions are made
to minimize supply chain costs. The modes of transport considered in this study are trucks that are distributed
from the multi-supplier to the warehouse. The purpose of this model is to observe the impact of the application
of carbon emission policies, such as carbon cap (limited) and carbon tax on the decision variables. The
changes in the parameters of emissions affect the quantity of emissions, the total cost of the system, and the
total cost of emissions.
1 INTRODUCTION
Carbon emission is defined as the number of carbon
dioxide gas (CO2) emitted to the air. The carbon
emission is also categorized as greenhouse gases
(GHGs). The ideal composition of CO2 in the clean
air should be at the level of 314 ppm. If the amount of
carbon emissions in the atmosphere is too high, it will
increase air pollution and cause a greenhouse gas
effect (Ardliana, 2020a). The IPCC (2006) stated that
GHG emissions increased by 70% between 1970 and
2004 and that the majority of GHG elements are CO2.
The increase in GHGs is due to three main sectors:
energy, transport, and industry (Ardliana, 2020b). In
2009, the Low Carbon Society (LCS) set a goal of
reducing CO2 emissions from 2.9 tons per capita to
0.5 tons per capita by 2050. Therefore, the developed
countries and the industrialized countries should
reduce their emissions to 0.5 tons per capita by 2050
to offset the increase in CO2 emissions in the last 70
years, which has caused the greenhouse effect.
Not only are the developed countries and the
industrialized countries demanded to reduce their
a
https://orcid.org/0000-0002-8349-9462
b
https://orcid.org/0000-0002-9587-8152
c
https://orcid.org/0000-0003-1148-9166
emissions, but also to stimulate or support the
developing countries that still have tropical forests.
Indonesia is one of the countries that could receive
this support with compensation for the preservation
of its tropical forests on the islands of Sumatra,
Kalimantan, Sulawesi, and Papua. Furthermore,
tropical and developing countries also could receive
additional support or incentives if they can reduce
CO2 emissions to 0.5 tons per capita by 2050. In this
case, the developed countries committed to utilizing
their resources to reduce global CO2 emissions. In
previous studies, the relationship between costs and
emissions is inversely proportional.
For example, with respect to the carbon cap, the
more lenient the carbon limit is given, the lower the
cost, but the higher the carbon emissions produced
(Ardliana, 2018). Therefore, an optimization between
these two variables is necessary to find a compromise
or a trade-off. The higher the emissions produced; the
more costs are spent reducing them to achieve the
theoretical goal: zero-emission. Several regulatory
mechanisms have been issued related to carbon
emissions policies such as carbon cap (the regulation
304
Ardliana, T., Pujawan, I. and Siswanto, N.
The Impact of Limited Carbon Emission on Supply Chain and Emission Cost.
DOI: 10.5220/0010944500003260
In Proceedings of the 4th International Conference on Applied Science and Technology on Engineering Science (iCAST-ES 2021), pages 304-308
ISBN: 978-989-758-615-6; ISSN: 2975-8246
Copyright
c
2023 by SCITEPRESS – Science and Technology Publications, Lda. Under CC license (CC BY-NC-ND 4.0)

of carbon emission capacity permitted by a
company). Benjaafar et al. (2010), Hua et al. (2011),
and Hammami et al. (2015) carried out an
investigation in the inventory area taking into account
carbon emission. Furthermore, Hoen et al. (2011),
Pan et al. (2013), Jin et al. (2014), and Mohammed et
al. (2017) conducted studies on the selection of
transportation modes that consider carbon emissions.
If the inventory and the transportation mode selection
decision are combined and make the carbon
emissions as a key consideration, it is expected to
minimize costs as well as carbon emissions in supply
chain activities (Konur, 2014; Palak et al., 2014;
Konur & Schaefer, 2014Tang et al., 2015 and
Schaefer & Konur, 2015).
The carbon emission factors are the constraints
and the objective function according to the applicable
regulations. Benjaafar et al. (2010) contributed to the
development of a general and simple optimization
model of emissions and total system costs. However,
the optimization model did not involve the
relationship between inventory and transportation
aspects which are important to the model.
Therefore, the purpose of this study is to optimize
the total costs associated with transportation and
inventory taking into account the carbon limitation
and carbon tax. The optimization model is based on
the mixed-integer linear programming (MILP)
approach.
2 PROBLEM DESCRIPTION
The problem studied is when multi-supplier carries
out sales and distribution activities in the form of
goods shipped to the warehouse. Transport is very
important to be considered because it is proved to
have an impact on costs optimization and its
emissions. Furthermore, the inventory storage
activity also has an impact on costs and emissions.
This research uses a single product. The suppliers
deliver solid raw materials such as fertilizer and
others. Several suppliers send their products to the
warehouse.
This condition leads to differences in the total
shipping costs and the emissions generated. Each
supplier’s production capacity is different, resulting
in a different number of shipments. It is assumed that
the transport capacity of the trucks from the suppliers
to the warehouse is the same because they use the
same truck. Transportation costs from the suppliers to
the warehouse depending on the location between the
parties.
The research problem configuration system is
illustrated in Figure 1. We address a system
consisting of a multi-supplier, (j = 1,2, …, J), and a
single-warehouse, W. The suppliers deliver the
product to the warehouse. Total demand for the
period t is notable. The warehouse also holds
inventory. There is initial inventory for each supplier
to be zero.
Figure 1: Problem configuration system.
3 MATHEMATICAL MODEL
3.1 Index and Notations
Here we describe the definition of index, parameter
and variable for research as follows:
Index
t: Set of planning time horizon [t = 1, 2,…, T]
j: Set of suppliers, [j = 1, 2, 3, …, J]
W: warehouse
Inventory variable
𝐼
: inventory at the end of period t at supplier j
𝐼
: inventory on warehouse at the end of t period
𝐼
,
: inventory at supplier j in previous period t
Delivery variable
𝑦
: quantity of product delivered to supplier j at
planning period t.
𝑥
: equal to 1 if get the order at period t
Delivery parameter
𝑑
: total demand quantity at period t
𝐾
: maximum capacity at a warehouse
𝑄 : vehicle capacity
Carbon emission Parameter
Cap : Emission carbon cap
f
j
: fixed inventory carbon emission at the
supplier j (in tons)
Y
t,
m
j
I
,
f, d
j = 1,2,…, J
Warehouse
X
j,
I
j
, f
j
Suppliers
The Impact of Limited Carbon Emission on Supply Chain and Emission Cost
305

f
w
: fixed inventory carbon emission the
inventory at a warehouse (in tons)
m
s
: fixed distribution carbon emission from
supplier j to a warehouse (in tons)
𝑜
: fixed order carbon emission (in tons)
∝: coefficient tax of emission cost
Parameters for the objective functions
𝑐
: transportation cost from supplier j to warehouse
ℎ
: holding cost at supplier j
ℎ
: holding cost at a warehouse
𝑝
: fixed cost
3.2 Model Development
The objective function of this model (1) is to optimize
the total costs which are consist of the total cost of
inventory at multiple suppliers and a single
warehouse, fixed order costs, transport costs, and
carbon emission cost. The formulation of the model
of this research is given by:
Minimize
𝑇𝐶= ℎ
𝐼
+ℎ
𝐼
+
𝑝
𝑥
+
𝑐
𝑦
+
∝𝑒
𝐼
+𝑒
𝐼
+
𝑒
𝑥
+𝑒
𝑦
(1)
Subject to
𝐼
=𝐼
,
+𝑦
∀ 𝑡∈𝑇 ,∀
𝑗
∈𝐽
(2)
𝐼
≥0 ∀ 𝑡∈𝑇
(3)
𝐼
=𝐼
,
+𝑦
− 𝑑
∀ 𝑡∈𝑇 ,∀
𝑗
∈𝐽
(4)
𝐼
≥0 ∀ 𝑡∈𝑇 ,∀
𝑗
∈𝐽
(5)
𝑓
𝐼
+𝑓
𝐼
+
𝑜
𝑥
+
𝑚
𝑦
≤𝐶𝑎𝑝
(6)
𝑦
≤𝑄
∈
∀ 𝑡∈𝑇 ,∀
𝑗
∈𝐽
(7)
𝑦
≥0 ∀ 𝑡∈𝑇 ,∀
𝑗
∈𝐽
(8)
𝑥
∈
0,1
∀ 𝑡∈𝑇
(9)
Constrain are explain with:
(2) the inventory balance at the each supplier.
(3) no shortage at the each supplier.
(4) the inventory balance on warehouse.
(5) to ensure that there is no stock-out at the
warehouse.
(6) the limit of carbon emission.
(7) limitation that guarantee the quantity
delivered does not exceed the capacity of
truck.
(8)-(9) are integrality and non-negativity constraints.
4 DATA EXPERIMENT
In this section, the numerical test was carried out for
five suppliers with three time periods to analyze the
impact of the carbon policy on the quantity of carbon
emission and the total emission cost. Two carbon
policies are addressed, namely the carbon cap and the
carbon tax. The delivery activity is assumed by the
supplier to the warehouse which is far away. The data
are given: 1). capacities of each supplier (5000 tons),
2) warehouse capacity (10,000 tons), 3) vehicle
capacity (1000 tons). Each supplier produces 1000
tons per period.
The demand for each period is given 900 tons, 900
tons, and 800 tons. The warehouse holding cost is
$0.9 and the holding costs for each supplier are $0.7;
$0.6; $0.5; S0.4; and $0.3. The shipping costs from
each supplier to the warehouse are $1; $2; $3; $4; and
$5. Then we use the carbon emission data such as the
carbon tax is $0.25, while the coefficients of each
supplier inventory are $0.9; $0.7; $0.6; $0.2; and
$0.1. The emission coefficient of warehouse
inventory is 0.4 and the truck emission coefficient
from each supplier is 0.4; 0.3; 0.2; 0.3; and 0.2.
Meanwhile, the fixed order cost emission is $0.5;
$0.1; $0.3; $0.1; and $0.2.
5 RESULT AND DISCUSSION
5.1 Carbon Cap
In this section, we examined the effect of changing
the carbon cap parameter on the total system costs,
total emission costs, and the quantity of carbon
emission in five scenarios. The impact of this change
in carbon cap is seen as its impact on the total supply
chain costs (in $), total emission costs (in $), and the
total amount of emissions generated (in tons). The
results of the comparison obtained are shown in Table
1 and Figure 2.
Table 1 and Figure 2 show that five scenarios of
carbon cap parameters in the range of 570 to 610 tons
are used to analyze the effects on three variables,
iCAST-ES 2021 - International Conference on Applied Science and Technology on Engineering Science
306
namely the total cost of the system, the total emission
cost, and the quantity of carbon emission. The results
show that the more relaxed the allowable carbon
emission cap, the lower the total system costs, but will
increase the total emission costs and the quantity of
emission. As for the carbon cap in the 600 tons
scenario, it will produce an optimal solution, as stable
as total cost, total quantity, and total emission. This
can be seen in the value effect, or the effect is the
same if the carbon cap value increases above 600
tons. This shows that there is an optimal solution in
the carbon cap number.
Table 1: The effect of the change in carbon cap on total cost,
total emission cost, and quantity of carbon emission.
Carbon
cap
Total cost
of system
($)
Total
emission
cost ($)
Qty. of
carbon
emission
(tons)
570 52,765.70 142.50 570
580 52,182.05 144.75 579
590 51,598.40 147.00 588
600 50,820.20 150.00 600
610 50,820.20 150.00 600
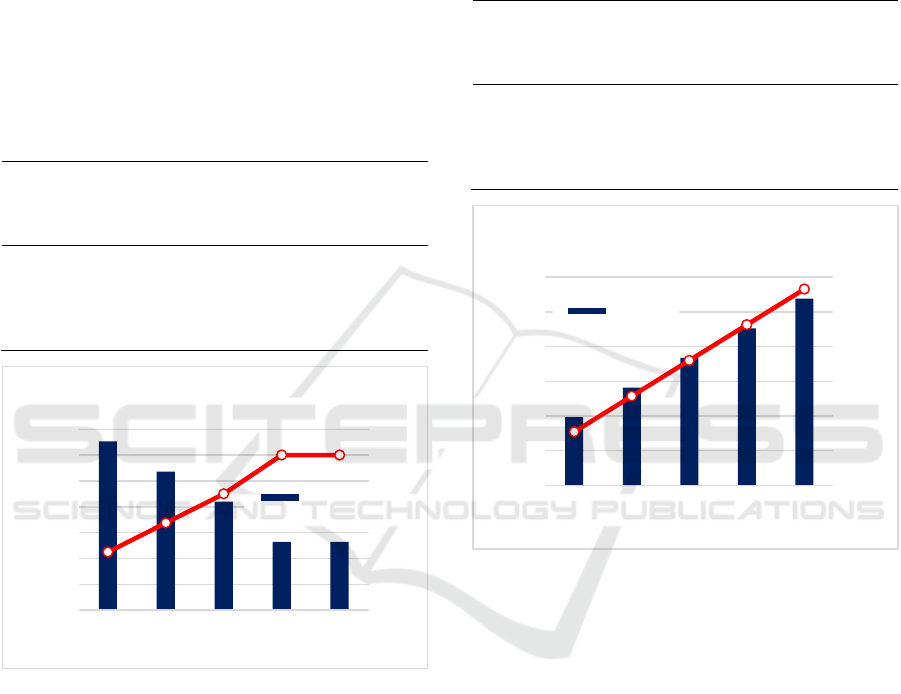
Figure 2: Sensitivity analysis of carbon cap.
5.2 Carbon Tax
Next, the carbon tax parameter is addressed in this
study in five scenarios. The value of the carbon cap is
set to the optimal solution (600 tons), while the value
of the carbon emission tax is changed in the range of
$0.15 to $0.55. The impact of this change in the
carbon tax is seen as its effect on changes in total
supply chain costs (in $), total emission costs (in $),
and the total amount of emissions produced (in tons).
The following is the result of the comparison is shown
in Table 2 and Figure 3.
Table 2 and Figure 3 indicate that increasing the
emission tax therefore the total cost and the emission
cost increase. However, the impact of the changes in
the carbon tax on the total quantity of carbon emission
seems to be insignificant (the optimal value remains
600 tons). This is because the carbon tax has an
impact on the objective function of this modeling.
Table 2: The effect of the change in carbon tax on total cost,
total emission cost, and quantity of carbon emission.
Carbon
tax
Total cost
of system
($)
Total
emission
cost ($)
Qty. of
carbon
emission
(tons)
0.15 4,9968.20 90.00 600
0.25 50,820.20 150.00 600
0.35 51,672.20 210.00 600
0.45 52,524.20 270.00 600
0.55 53,376.20 330.00 600
Figure 3: Sensitivity analysis of carbon tax.
6 CONCLUSIONS
This paper investigates the carbon cap and carbon tax
for multi-supplier with a single warehouse and
multiple periods. This paper develops a MILP model
to optimize the carbon emissions and minimize the
overall costs of the system. The results obtained from
the numerical test show that the more leeway the
allowable carbon emission capacity is allowed, the
higher the cost of emissions, and carbon generated,
but the overall cost of the system decreases.
This indicates that carbon constraints have an
impact on the total cost of the supply chain, total
emission costs, and the total amount of emissions
generated. Meanwhile, the higher the value of the
carbon tax imposed, it will burden the total system
costs and supply chain emission costs. This research
is still limited to a small scale and can then be further
138
140
142
144
146
148
150
152
49500
50000
50500
51000
51500
52000
52500
53000
570 580 590 600 610
Total emission cost
Total cost of system
Carbon cap (tons)
Effect of the change in carbon cap on total
cost of system and total emission cost
Total cost of
system
0
50
100
150
200
250
300
350
48000
49000
50000
51000
52000
53000
54000
0,15 0,25 0,35 0,45 0,55
Total emission cost
Total cost of system
Carbon tax ($)
Effect of the change in carbon tax on total
cost of system and total emission cost
Total cost of
system
The Impact of Limited Carbon Emission on Supply Chain and Emission Cost
307

developed by comparing it to metaheuristic methods
such as the genetic algorithm (GA) and particle
swarm optimization (PSO). Further studies may
consider multiple distribution centers as well as more
complex models with multiple customers.
REFERENCES
Ardliana, T., Pujawan, I., Siswanto, N., (2020a). The
Effects of Carbon Tax on Inventory and Land
Multimodal Integration. IOP Conf. Ser.: Mater. Sci.
Eng. 830 042008
Ardliana, T., Pujawan, I., Siswanto, N., (2020b). The
Effects of Carbon Cap Limitations on Inventory and
Multimodal Transportation AIP Conf. Proceedings
2217 030019
Ardliana, T., Pujawan, I., Siswanto, N. (2018). Inventory-
Transportation Model Considering Carbon Cap
International Conference on Industrial Engineering
and Operations Management, pp. 1319-1325.
Benjaafar, S., Li, Y., Daskin, M. (2010) Carbon Footprint
and the Management of Supply Chains: Insights from
Simple Models IEEE Trans. Autom. Sci. Eng, 10 (1)
99–116.
Hua, G., Cheng, Wang, S. (2011). Managing Carbon
Footprints in Inventori Management International
Journal of Production Economics 132(2) 178–185.
Hammami, R., Nouira, I., Frein, Y. (2015) Carbon
Emissions in a Multi-Echelon Production-Inventori
Model with Lead Time Constraints. International
Journal of Production Economics 164 292–307.
Hoen, K. M. R., Tan, T., Fransco, J., C, Houtumn, G. J.
(2010). Effect of Carbon Emission Regulations on
Transport Mode Selection in Supply Chains
http://cms.ieis.tue.nl/Beta/Files/WorkingPapers/Beta_
wp308.pdf.
Pan, S., Ballot, E., Fontane, F., (2013). The Reduction of
Greenhouse Gas Emissions from Freight Transport by
Pooling Supply Chains. International Journal of
Production Economics 143(1) 86–94.
Jin, M,. Granda-Marulanda, N. A., Down, I. (2014). The
Impact of Carbon Policies on Supply Chain Design and
Logistics of a Major Retailer. J. Cleaner Prod. 85 453–
461.
Mohammed, F., Selim, S., Hassan, A., Syed M. N. (2017)
Multi-Period Planning of Closed-Loop Supply chain
with Carbon Policies under Uncertainty Transportation
Research Part D: Transport and Environment . 51 146–
172.
Konur, D. (2014a). Carbon Constrained Integrated
Inventory Control and Truckload Transportation with
Heterogonous Freight Trucks. Int. J. Prod. Econ. 153
268-279.
Konur, D., Schaefer, B. (2014b). Integrated Inventory
Control and Transportation Decisions under Carbon
Emissions Regulations: LTL vs. TL Carriers.
Transportation Research Part E: Logistics and
Transportation Review. 68. 14–38.
Palak, G., Eksioglu S. D., Geunes, J. (2014). Analyzing the
Impacts of Carbon Regulatory Mechanisms on Supplier
and Mode Selection Decisions: an Application to to a
Biofuel Supply Chain. Int. J. Prod. Econ. 154. 198–
216.
Tang, S., Wang, W., Yan, H., Hao, G. (2015). Low Carbon
Logistics: Reducing Shipment Frequency to Cut
Carbon Emissions. International Journal of
Production Economic. 164 339–350.
Schaefer, B., Konur, B. (2015) Economic and Enviromental
Considerations in a Continuous Review Inventory
Control System with Integrated Transportation
Decisions. Transportation Research Part E 80. 142-
165.
iCAST-ES 2021 - International Conference on Applied Science and Technology on Engineering Science
308
