
A Low Cost Electricity Monitoring Wireless Sensor Network
Prihadi Murdiyat
a
, Abdul Hamid Kurniawan
b
, Marson Ady Putra
c
, Khairuddin Karim
and Supian Noor
d
Electrical Department, Politeknik Negeri Samarinda, Jl. Dr. Ciptomangunkusumo, Samarinda, Indonesia
spn.evolution@gmail.com
Keywords: Electricity Monitoring, Wireless Sensor Network, Arduino, LoRa, WiFi.
Abstract: As electricity price increases, the electricity consumption should be taken into account and managed wisely.
For schools, universities, or industries having a number of buildings, each building should be equipped with
a kWh meter. Installing a branded kWh meter in every building could be too expensive. This research aims
to develop a low cost electricity monitoring system that consists a number of sensor nodes (SNs), a
sink/gateway, and a server. The SNs and gateway are built based on Arduino boards. LoRa radio is used to
establish communication between SNs and the gateway, while WiFi radio is utilized to perform
communication between the gateway and campus internet network where the server is connected. Research
activities includes SN and gateway prototype building, sensors calibration, data communication testing, link
measurement, installation, and system running test. The system with five SNs has been built and installed at
five buildings in the campus of Politeknik Negeri Samarinda. According the measurement during running
test, the RSSI and SNR are mostly better than the value obtained in preliminary link test. Furthermore, the
monitoring system does not give only electricity consumption pattern, but figures of installation problems,
which is important for electrical installation improvement.
1 INTRODUCTION
In Indonesia, electricity tariff always increases almost
annually. The tariff is increased to reduce the
electricity subsidy for the middle to high classes, keep
the service reliable, and to enhance the electrification
(PT. PLN, 2021). Therefore, the electricity
consumption must be managed properly to save the
cost that may appear due to inadvisable use of
electricity.
Electrical consumption is normally measured by a
kilowatt hour meter (kWh meter) either analogue or
digital. Customers rely on kWh meter to measure the
electricity they have used during the past period.
When they found that the amount of electricity in the
previous period is high, they might consider to control
the electricity consumption in the next period. For
schools, universities, or industries having several
buildings in their area, a kWh meter should be
a
https://orcid.org/0000-0002-7962-1306
b
https://orcid.org/0000-0002-5772-3889
c
https://orcid.org/0000-0002-4736-881X
d
https://orcid.org/0000-0002-9030-3026
installed in every building. It is particularly important
as each building may have different electricity
consumption characteristic. Lack of kWh meter in
every building could make electricity utilization
policy becoming unsuitable.
Furthermore, rather than utilizing conventional
kWh meter where people must visit periodically to
read the electricity consumption such as in (Pasurono,
2013), people nowadays tend to use an integrated
monitoring system where kWh meter installed in
every building sends data report to a central station
periodically. As such, no reader is required to observe
the kWh meter. This trend rises due to the emerge of
internet of things (IoT). Moreover, the integrated
monitoring system is commonly able to measure
other electrical parameters such as voltage, current,
frequency, and power factor. Therefore, there will be
more data to analyse the consumption characteristic.
In this system, the data could be reported 24/7 with a
certain period such every hour.
278
Murdiyat, P., Kurniawan, A., Putra, M., Karim, K. and Noor, S.
A Low Cost Electricity Monitoring Wireless Sensor Network.
DOI: 10.5220/0010944100003260
In Proceedings of the 4th International Conference on Applied Science and Technology on Engineering Science (iCAST-ES 2021), pages 278-283
ISBN: 978-989-758-615-6; ISSN: 2975-8246
Copyright
c
2023 by SCITEPRESS – Science and Technology Publications, Lda. Under CC license (CC BY-NC-ND 4.0)
The price of integrated system such as in (Eyedro,
2021) is USD 299 or over IDR 4 million per unit. It is
just the price of sensor node and does not include the
server, shipping, and installation. For industries,
installing every building with such a unit may not be
a problem as measuring the electrical load
characteristic is required. The cost of metering
procurement might not as high as the outcome of
controlling the electricity consumption, where they
could save the cost significantly. However, for many
schools and universities, it could be very costly.
Hence, a low cost electricity monitoring wireless
sensor network developed in this research could be a
solution.
The system developed in this research comprises
a number of sensing units (ie. sensor node) that is
installed next to main panel available in every
building. The sensor node (SN) measures almost all
electrical parameters and displays them on a liquid
crystal display (LCD). The data of several parameters
are also sent periodically to a gateway through
wireless network.
Once accepting the data, the gateway forwards
data to the server that is prepared for campus
resources monitoring. Since the server connects to the
campus internet network, the gateway should have an
access to the campus internet as well. The server
saves the data and could display it as a simple statistic
form. Every person who has authority would be given
an access to the data, and hence could monitor it from
everywhere every time.
To compare with similar research, below are
several research on Arduino based energy meter. In
(Rajput, 2018) an energy meter is developed to
provide prepaid system that utilizes GSM technology
for data communication. Through this system,
consumers are allowed to manage their electricity
consumption by paying up front. Another research
reported in (Mithya, 2019) builds energy meter that is
able to send message to both customer and the
electricity company through GSM. When electricity
consumption is beyond a specific threshold, an alarm
is sent. While both projects use GSM communication
technology, a smart energy meter developed in
(Kanakaraja, 2021) utilizes LoRa WAN as the
communication system. The energy meter allows the
user to monitor energy consumption every time from
everywhere. All systems above generally focus on
home energy meter and concern about single sensor
node. In contrast, the system introduced in this paper
focus on energy measuring network in institution
local area with a number of sensor nodes.
2 SYSTEM DESCRIPTION
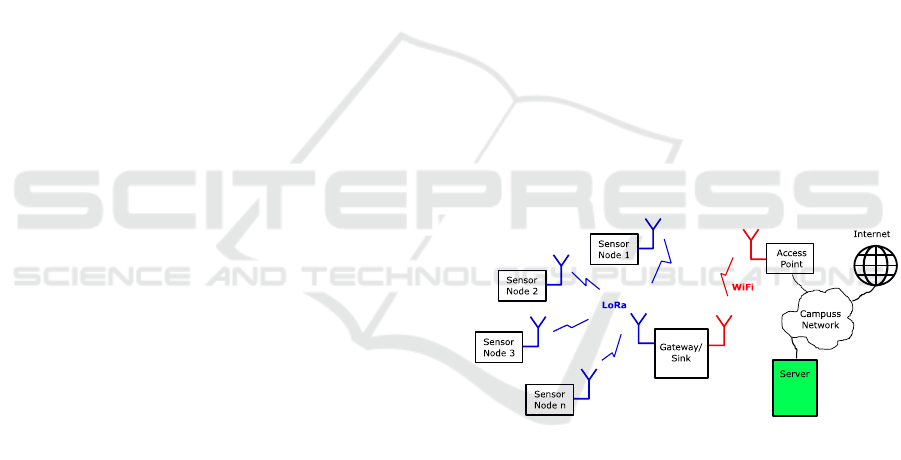
The architecture of the monitoring system network is
shown in figure 1. That is similar with the common
wireless sensor network (WSN) architecture
described in (Akyildiz, 2002). A unit namely sensor
node (SN) is built in a panel box and installed next to
the main panel. Three current transformers and a
number of cables from the SN’s voltage sensors are
installed in the main panel to measure voltage,
current, power factor, frequency, active and apparent
power, and electrical energy. All data are processed
and displayed on SN’s liquid crystal display (LCD).
Since the main panel consists of three-phase
installation, the SN measures parameters of every
phase. The only three-phase parameter measured by
SN is the energy in kWh unit. The SN does not only
display its measurement results on LCD, but also send
several data to the gateway as well. Such data are the
active power of phase R, S, T, and the energy of three-
phase. The purpose of sending the active power to the
server is to observe the balance of the three-phase of
every building, while the purpose of sending the
three-phase energy is to measure the building
electricity consumption. To avoid cabling
complexity, the communication between SN and the
gateway is established by wireless link.
Figure 1: The architecture of monitoring system network
Long range (LoRa) radio technology (LoRa
Alliance, 2015) is considered to establish the link
between SN and the gateway as among other
technologies such as WiFi (Digi Int., 2008) and
Bluetooth (Wooley, 2020), LoRa is able to reach the
longest distance, which is up to kilometres away.
According its specification (LoRa Alliance, 2015), in
the urban area LoRa could reach up to 5 km, while in
rural area it is able to reach up to 15 km. In a specific
condition (The Things Network, 2020), LoRa could
even reach 832 km. In this case, a LoRa transmitter is
brought by a balloon flying 83 km above the land, and
as a consequence a line of sight (LoS) conditions is
achieved. To work in LoRa protocols, both SN and
the gateway are equipped with a LoRa transceiver.
A Low Cost Electricity Monitoring Wireless Sensor Network
279
The working frequency is 915 MHz to deal with the
Indonesian government regulation of low power wide
area network (LPWAN) where LoRa is included.
When the gateway has accepted data from SNs, it
forwards the data to server. The server should have a
connection to the internet to make it accessible to be
monitored from everywhere at any time. In this
research, the server connects to Politeknik Negeri
Samarinda internet network. As a consequence, the
gateway is equipped with a WiFi transceiver to
communicate with the server. Currently, the gateway
is located at the Electrical Department Laboratory
where several access points (APs) are available to
connect to.
All data coming from the gateway are collected
by the server. A simple web based application
controls, saves, and displays the incoming data. The
application could be accessed from everywhere at any
time by a person who has been given authority.
3 RESEARCH METHODS
Research activities is started by reviewing literatures
pertaining electrical parameter sensors, Arduino
based wireless sensor networks, communication
protocols, LoRa and WiFi technologies, and server
development. When significant information obtained
from the literature is sufficient, the SN and gateway
prototype are built. Along with the prototype
building, the sensors are calibrated by comparing the
measured parameter values with the value measured
by correspond laboratory electrical metering.
The process is followed by data communication
evaluation involving communication protocol test.
Prior installation, link measurement is undertaken to
observe the capability of communication system to
provide communication link and network between
SNs and gateway. Once the installation of five SNs,
the gateway, and the server is accomplished, the
system running test is performed.
4 RESULTS AND DISCUSSION
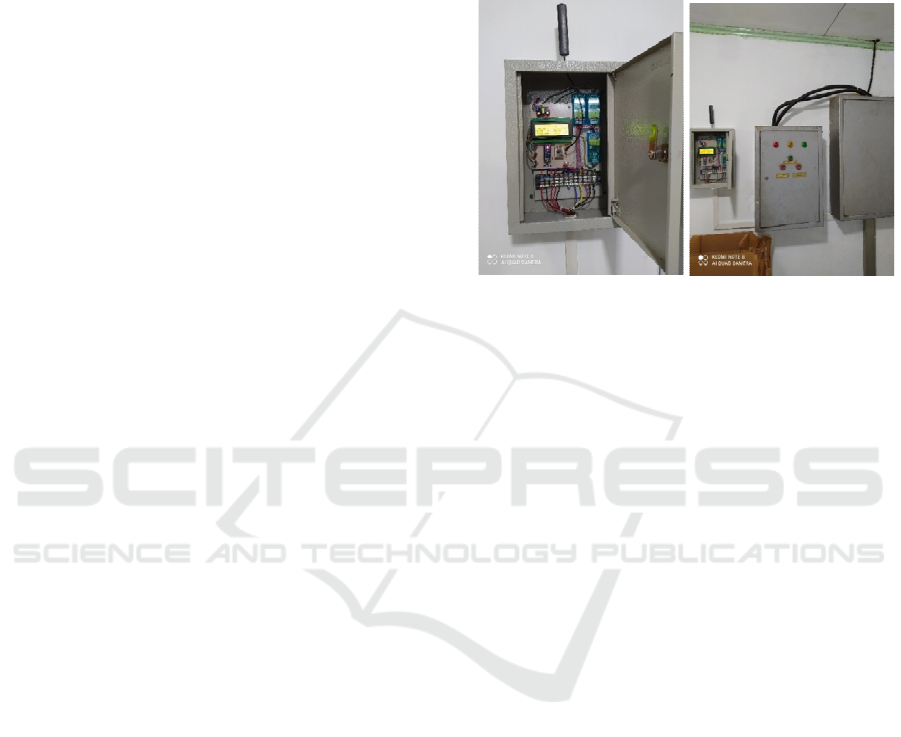
Sensor node (SN) consists of three PZEM-400T
sensors including its current transformer, an Arduino
Nano, a 915 MHz LoRa transceiver, 20 x 4 LCD
display, and 3DR 5dBi antenna. The unit is powered
by a 220 V AC to 12V DC mini power supply. All
parts are installed into a panel box with the size of 35
x 25 x 12 cm
2
as shown in figure 2. The circuit
diagram and other details are described in (Alfan,
2021). The accuracy of the SN measurement has been
compared with HIOKI PQ3100 power quality
analyser (Alfan, 2021), and shows that the error is less
than 3 % for voltage, current, apparent power, active
power, and frequency, while for power factor is
6.505 %.
Figure 2: Sensor node.
The cost of a sensor node unit in this system is less
than IDR 1 million including installation. It is about a
quarter of the price of a sensor node unit in (Eyedro,
2021). With a large number of production, the cost
could be cheaper.
Due to the requirement and convenient operation,
several parts of the program in (Alfan, 2021) has been
changed. For example, the parameters of every phase
are displayed consecutively and automatically
without pushing the push button as the previous
design. Also, the length of data values is increased 1
byte into 2 bytes. Hence the data format becomes 1
byte of the destination address, 1 byte of the source
address, 1 byte of message counter, 1 byte of packet
length, 1 byte of data1 type, 2 bytes of data1 value, 1
byte of data2 type, 2 bytes of data2 value, 1 byte of
data3 type, 2 bytes of data3 value, 1 byte of data4
type, 2 bytes of data4 value. The contents of every
data are phase R, S, T active powers, and three-phase
kWh respectively. This packet format is inserted into
the LoRa data packet. The packet is sent every 30
minutes.
During installation, several cables from three-
phase voltage sensor of SN are connected to phase R,
phase S, phase T, Neutral bus bar respectively.
Meanwhile, three current transformers (CTs) are
clamped on their respective phase load cable/busbar
with the CT cables are connected to the current sensor
unit.
The gateway comprises of a Wemos board and a
915 MHz LoRa transceiver. Both are powered by a
DC 12 V 5 A power supply and installed in a 35 x 25
x 12 cm
2
panel box as shown in figure 3. The LoRa
iCAST-ES 2021 - International Conference on Applied Science and Technology on Engineering Science
280
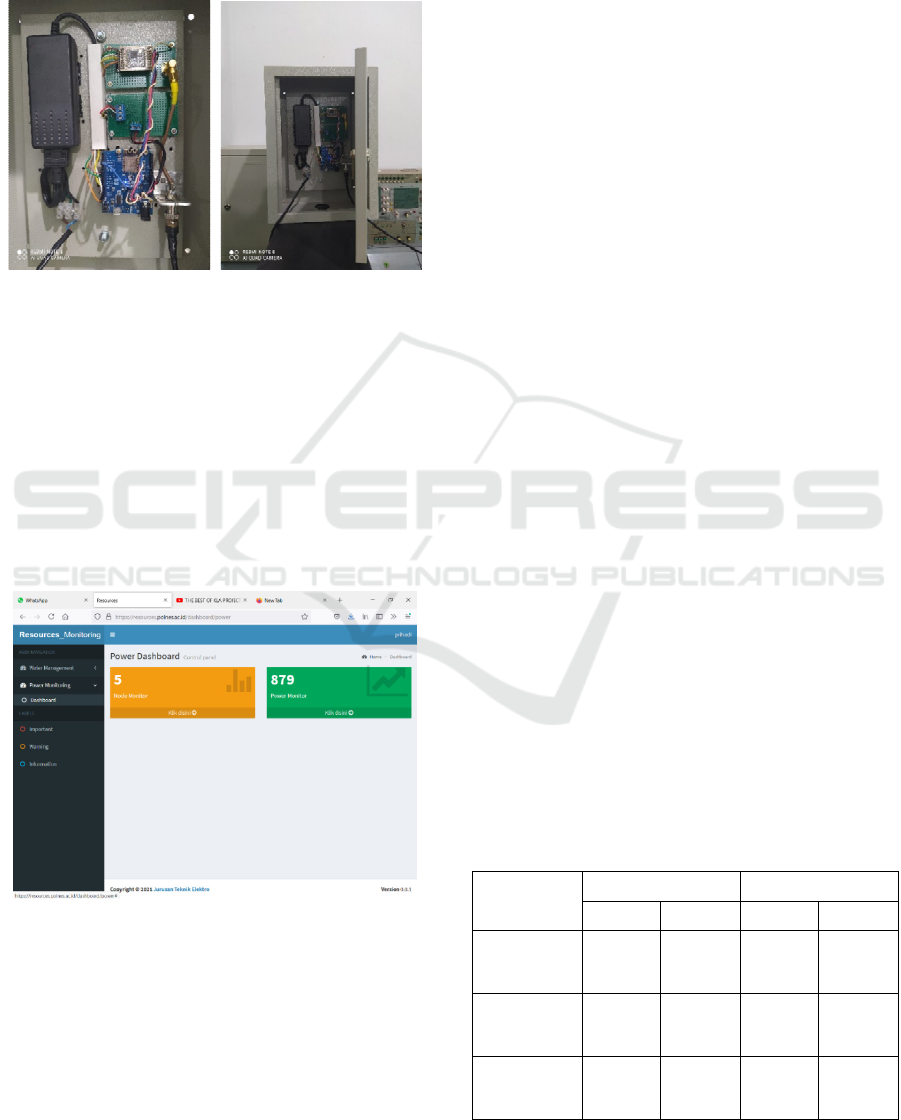
transceiver is utilized to receive data transmitted by
SNs. The data then are processed by the Wemos into
the packet that is suitable with the WiFi packet
format. Afterwards, the packet is sent to the server
throughout the campus internet.
Figure 3: Gateway.
The server of the monitoring network takes a
space of the Department of Electrical Engineering
server. It is developed based on Laravel web
framework. Currently, the web appearance is simple
but quite effective. The server is also prepared for
other resources monitoring such as water
consumption and solar energy monitoring, where the
monitoring system would be developed. The web
display is shown in figure 4. This display could be
accessed from everywhere as long as the internet is
available.
Figure 4: The display on web based server.
Prior the system installed in February 2021, a
preliminary measurement of the link between several
future SN locations and the gateway located at the
laboratory of The Department of Electrical
Engineering is undertaken. The results could be
found in (Batong, 2021).
During the measurement, two LoRa transceivers
are installed on a pole with the height of 6 meters.
Each had their own Slim Jim antenna. A transceiver
worked on the frequency of 433 MHz, while another
work on 915 MHz. Both transmitted packet
periodically. Two LoRa receivers where one worked
on 433 MHz and another worked on 915 MHz are
brought to five locations sequentially to measure
received signal strength indicator (RSSI), signal to
noise ratio (SNR), and packet loss. The result showed
that for both frequencies and all SN locations the
RSSI is above -120 dB. It means that all links are
acceptable to establish LoRa data communication.
In February 2021, five units of SN are installed in
two office buildings, two laboratories, and a
workshop. These buildings are selected due to various
distances and building functions. The different
function is believed would give specific electricity
consumption character that may be different from the
character of other buildings.
Three locations where the SN installed has been
observed in the preliminary measurement mentioned
above. Hence, the result of the preliminary
measurement could be compared with the current
measurement provided by the installed SN. It is with
the note that in the preliminary measurement (Batong,
2021), the gateway transmits packets to the SN, while
in the current situation, the SN transmits packets to
the gateway. The location on both situations is the
same, which is at the laboratory of Electrical
Department.
Furthermore, not all results in (Batong, 2021) will
be used. For example, as the antenna used in SN unit
is omnidirectional antenna, the comparison is only for
this type of antenna. Moreover, since the operation
frequency used in the current system is 915 MHz, to
deal with the Indonesia government regulation, the
comparison is only undertaken for this frequency.
The averaged RSSI and SNR of preliminary result
and the current measurement are shown in Table 1.
Table 1: The RSSI and SNR comparison of preliminary and
current measurement.
Location
RSSI (dB) SNR (dB)
Prelim. Current Prelim. Current
Electrical
Department
Office
-113 -100 7.41 9
UPT
Bahasa
2
nd
floor
-118 -116 4.08 0.25
Chemical
Engineering
Laboratory
-99 -89 8.41 8.75
A Low Cost Electricity Monitoring Wireless Sensor Network
281
It can be seen that the RSSI measured by the
installed SN is even higher than the RSSI measured
by the preliminary observation. It is possibly due to
the use of metal panel box as the SN cover and the
antenna grounding. Such metal box might reduce
interference from outside the SN unit and improve the
antenna radiation pattern.
Meanwhile, the SNR measured by the installed
SN is commonly higher than the SNR measured in
preliminary observation. The SNR value in UPT
Bahasa that is only 0.25 dB is still reliable as the
minimum limit of SNR according LoRa standard
(LoRa Alliance, 2015) is -20 dB. However, during
heavy rain, packet transmitted from SN in UPT
Bahasa sometimes could not be accepted by the
gateway. Thus, the LoRa transmitter power will be
increased from the default (17 dB) into to the
maximum (20 dB) through the program. Also, the
antenna will be replaced by a higher gain antenna.
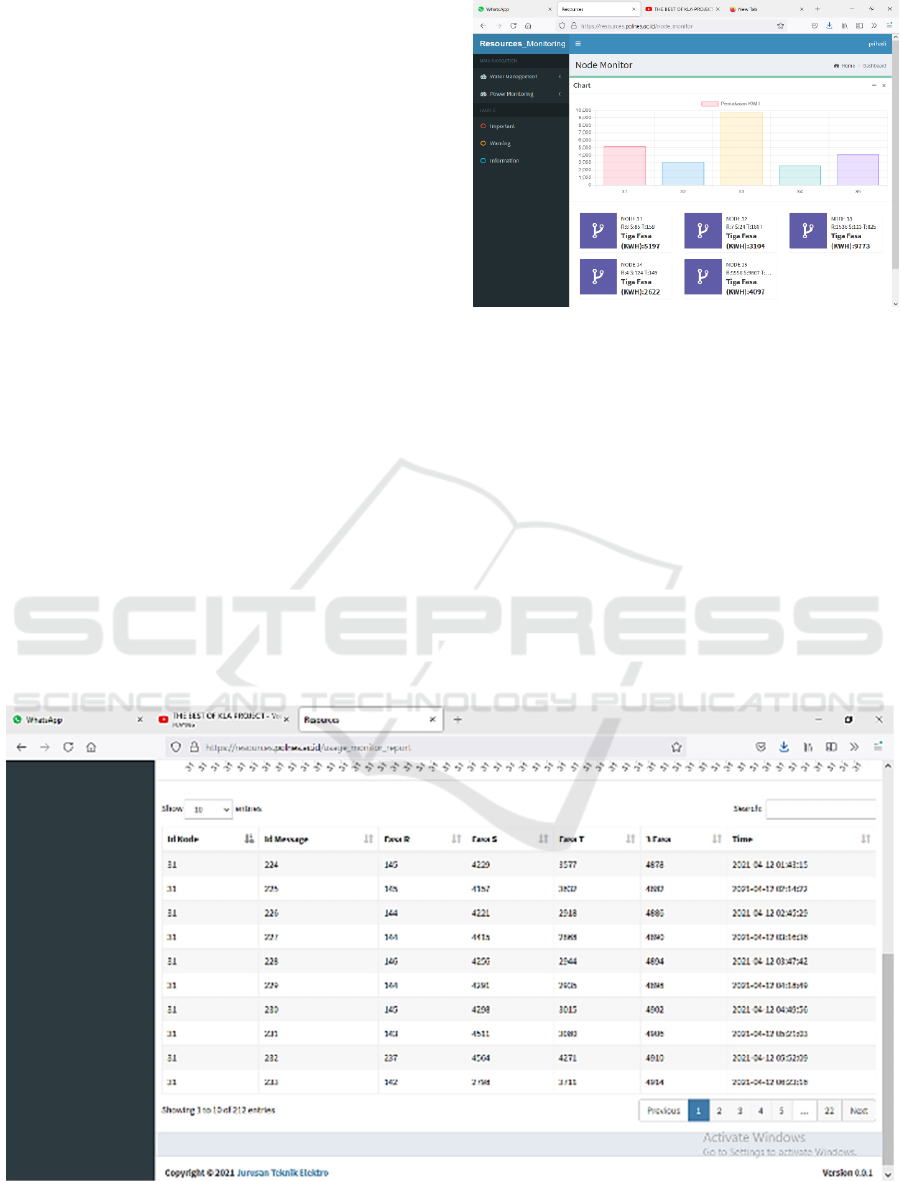
Several months after being installed, the
electricity monitoring system could show the
electricity consumption of the buildings. How much
electricity every building uses is clear as shown in
website menu (figure 5), the unit is kWh. By
comparing such electricity consumption with the
electrical equipment specification used in the
building and people activities, it could be calculated
whether the electricity utilization is normal or
wasteful. If it is wasteful, a significant action might
be required to reduce the consumption.
Figure 5: The display of buildings electricity consumption.
Since the active power of every phase is also sent
to the server, the phase equilibrium can also be read
to analyse whether the installation is proper or not.
The display is shown in figure 6. The unit of active
power is in watt, while the three-phase consumption
is in kWh. In Politeknik, improper installation may
occur as additional installation is undertaken without
considering the phase load balance. As such,
installation revision should be provided.
Figure 6: The display of individual phase active power.
iCAST-ES 2021 - International Conference on Applied Science and Technology on Engineering Science
282

4 CONCLUSIONS
It has been built and installed a low cost electricity
monitoring wireless sensor network as a solution to
measure the electricity consumption for every
building in the campus of Politeknik Negeri
Samarinda. Along with the electricity consumption
report required by the Politeknik directorate, the
system also gives the report of phase equilibrium that
is required by electrical experts in Politeknik to revise
and improve the installation. It is necessary to prevent
electrical hazard or installation damage caused by the
imbalance phase load. In brief, the integrated
electricity monitoring system could make electrical
resources utilization and maintenance more
accountable, which is important to achieve the
predicate of green technology campus
ACKNOWLEDGEMENTS
Authors would like to express gratitude and
appreciation to The Director of Politeknik Negeri
Samarinda and staffs for many supports including
moral and financial to make the project realized. The
author would also thank to students who involved in
this research. It could be worthy experience that
improve their self-confidence to create other applied
systems, which is help people to live better.
REFERENCES
Akyildiz I. F., Su W., Sankarasubramaniam Y., Caryici E.
(2002) A survey on sensor networks, In IEEE
Communication Magazine August p 102.
Alfan, Murdiyat P., Gunanto L. H. (2021) Rancang bangun
sensor node untuk sistem monitoring energi listrik
nirkabel pada gedung dalam kampus Politeknik Negeri
Samarinda, In Poligrid vol 2 no 1 p 1.
Batong A. R., Murdiyat P., Kurniawan A. H. (2021)
Analisis kelayakan LoRa untuk jaringan komunikasi
sistem monitoring listrik di Politeknik Negeri
Samarinda, In Poligrid vol 1 no 2 p 55.
Digi Int., (2008) An introduction to WiFi, Digi International
Inc. p 12.
Eyedro (2021) Eyedro business 3-phase energy monitor
(polyphase), online https://www.amazon.com/,
Eyedro-Business-EBEM1-LV-Electricity-Monitor/dp
/B07RPYZCH8?th=1
Kanakaraja P., Sourabh U., Kotamraju S. K., Suneela G. V.
S., Neelesh R. (2021) Design and implementation of
smart energy meter using LoRaWAN and IoT
applications, In Journal of Physics:Conference Series
1804(2021).
LoRa Alliance (2015) LoraWAN, what is it? A technical
overview of LoRa® and LoRaWAN™", Whitepaper,
LoRa Alliance, San Ramon California
Mithya V, Kosalya M., Madhumathi P. M. Manimegalai G.,
Ramya P. (2019) Intelligent energy meter using GSM
modem with Arduino, In International Journal of
Innovative Technology and Exploring Engineering vol.
8 issued 6S.
Pasurono, Handoko S., Setyawan I. (2013) Perancangan
kWh meter digital menggunakan kWh meter
konvensional, In Transient vol 2 no 1 p 113.
PT. PLN (2021). Q&A tarif listrik, online https://web.pln.
co.id/pelanggan/qa-tarif-listrik.
Rajput U. A., Rafique K., Saand A. S., Shaikh M., Tarique
M (2018) Modelling of Arduin-based prepaid energy
meter using GSM Technology, In International Journal
of Advanced Computer Science and Application vol. 9
no. 5.
The Things Network (2020) LoRa world record broken:
832 km/517 mi using 25 mW, https://www.
thethingsnetwork.org/article/lorawan-world-record-
broken-twice-in-single-experiment-1
Wooley M. (2020) Bluetooth 5 go faster go further
(Bluetooth.com) p 11.
A Low Cost Electricity Monitoring Wireless Sensor Network
283
