
Effect of Waste Valve Tuning on Hydraulic Ram Pump Efficiency
Alexius Leonardo Johanis
a
, Rafael Mado and Hero Preasly Dida
State Politechnic of Kupang, Jl.Adisucipto-Penfui, Kupang-NTT, Indonesia
Keywords: Hydraulic Ram, Pump, Efficiency, Waste Valve.
Abstract: A community that lives far away from an electrical power source has a problem in moving water from lowland
water source location to higher location as their needs, one option to solving this problem is using hydraulic
ram pump whose energy is the pressure that resulted from water hammer effect caused by the sudden stop of
the water flow into the pump through its drive pipe. Some areas have a large quantity of water flow while
others must deal with a limited water source, lead to the need for optimal pump efficiency. In This paper, a
study on the effects of waste valve tuning on the efficiency of three inches sized hydraulic ram pump was
conducted by varying the weight and stroke of the waste valve. From the experiments data and statistic
correlation analysis resulting that both factors influence the efficiency as well as the interaction between them.
The optimal setting for the best efficiency is at 1 kg of valve weight and 10 millimeters of valve stroke, give
70.45 % of efficiency.
1 INTRODUCTION
In many parts of the world, villages are located above
springs: they do not allow water to flow to people's
places by gravity. For example, in the province of
East Nusa Tenggara (NTT) Indonesia, 70 percent of
the population lives upstream of the nearest water
source. A pump is needed to lift water from this
source to their compound (Jeffery et al. 2005), but
another big problem is the limited availability of
electrical energy or fuel to drive the pump motor.
Using hydraulic ram pumps placed on the banks
of rivers or springs, water can be pumped to
agricultural land or water reservoirs automatically
and without additional energy. With a good approach,
the production and use of hydraulic ram pumps in
developing countries will reduce farmers'
expenditures such as fuel and electricity, and
environmental damage can be reduced. The hydraulic
ram pump can operate for years without requiring
maintenance or control making it an ideal system
especially in areas where motor fuel is expensive and
electricity is not available to the pump system.
(Hatipoğlu et al. 2018).
a
https://orcid.org/0000-0002-4156-5505
Figure 1: Typical Hydraulic Ram pump arrangement.
1.1 Hidraulic Ram Pump Instalation
As shown in figure 1, the pump works by pumping a
small fraction of water that flows through it from a
supply Source to a level that can be much higher than
the source, it only can be operated in places where
there is a steady and reliable supply of water with a
sufficient fall.
The vertical distance between two water surfaces
is known as the available water "head" and is a
Johanis, A., Mado, R. and Dida, H.
Effect of Waste Valve Tuning on Hydraulic Ram Pump Efficiency.
DOI: 10.5220/0010943000003260
In Proceedings of the 4th International Conference on Applied Science and Technology on Engineering Science (iCAST-ES 2021), pages 237-242
ISBN: 978-989-758-615-6; ISSN: 2975-8246
Copyright
c
2023 by SCITEPRESS – Science and Technology Publications, Lda. Under CC license (CC BY-NC-ND 4.0)
237

measure of water pressure. For instance, the Supply
head represents the pressure in the ram body when it
is full of water while not pumping; likewise, the
pressure in the air chamber with the delivery valve
closed is the delivery head. (Watt 1975)
The working cycle of the hydraulic ram pump can
be described as follows; At the start of the
acceleration phase, the flow in the drive pipe is
stationary. The waste valve opens under its weight,
and the delivery valve closes, The flow of water in the
drive pipe is accelerated under the action of the
supply head until the dynamic force that this flow
exerts on the waste valve is sufficient to cause the
waste valve to start closing at a certain critical speed.
At the end of the acceleration phase, the waste valve
closes quickly, and a water hammer phenomenon
occurs. the pumping action takes place as a shock
wave induced by the water hammer which passes
through the drive pipe up and down at the velocity of
the pressure wave and the delivery valve opens in
response to each pressure pulse and water flow is
pumped up into the reservoir. Reversal of flow in the
drive pipe, occurs at the end of the pumping phase
after the delivery valve closes, the resulting suction
from backflow causes the waste valve to open, and
the cycle is ready to start again.(Fatahi-alkouhi,
Lashkar-ara, and Keramat 2019).
1.2 Waste Valve
There are only two moving parts in the Hydraulic ram
pump mechanism, which are the delivery valve and
the waste valve or also known as the impulse valve,
these two valves work alternately and continuously
during the pump operating time.
There are several developments and researches
that have been carried out on the construction of
waste valves; Some of them are Simple weighted
Waste valve, Spring type, Rubber washer type, and
Swing mechanism waste valve (Fig.2)
The Flow Pattern in the hydraulic ram pump is
significantly influenced by the diameter of the orifice
and disc of the waste valve(M. Suarda, Sucipta, and
Dwijana 2019), The increase in waste valve beat rate
per minute tends to reduce the supply flow rate,
delivery flow rate, and delivery head. But it tends to
increase the head ratio, flow rate ratio, and overall
pump efficiency(Asvapoositkul et al. 2019), pump
capacity is also affected by the weight of the waste
valve(Setyawan and Siregar 2015)(Suwandi 2015),
the effect of Waste Valve Height and Pressure
Chamber Height is found significant on both mean
and variance of the response variable (delivery flow
rate) (Sarma et al. 2016), All of the waste valve design
parameters for instance valve orifice and disc
diameter, valve mass, and valve stroke significantly
influence the performance of hydraulic ram pumps
such as delivery flowrate and total efficiency of the
hydraulic ram pump system. (Made Suarda et al.
2018).
Nowadays hydraulic ram pump technology is
starting to be promoted again in line with efforts to
utilize new renewable energy-based technology,
many people design and assemble their own simple
hydraulic ram pumps using pipe connections and
check valves as a substitute for artificial valves, on
one hand, this method is very practical and cheap but
the drawbacks are it is not possible to adjust the waste
valve to optimize pump performance.
This research aims to determine the effect of
adjusting the weight and stroke length of the waste
valve on the 3-inch hydraulic ram pump working
efficiency.
Figure 2: Types of Waste valve construction.
2 METHODS
2.1 Experimental Setup
Experiments were carried out by operating 3 inches
sized hydraulic ram pump at sufficient water as
shown in fig. 3, Simple model is used to varying the
stroke length and weight of the waste valve (fig.4)
and then measuring the wastewater flow and
delivered water flow (fig.5), hydraulic ram pump
installation as described in Tabel 1 and Table 2.
iCAST-ES 2021 - International Conference on Applied Science and Technology on Engineering Science
238
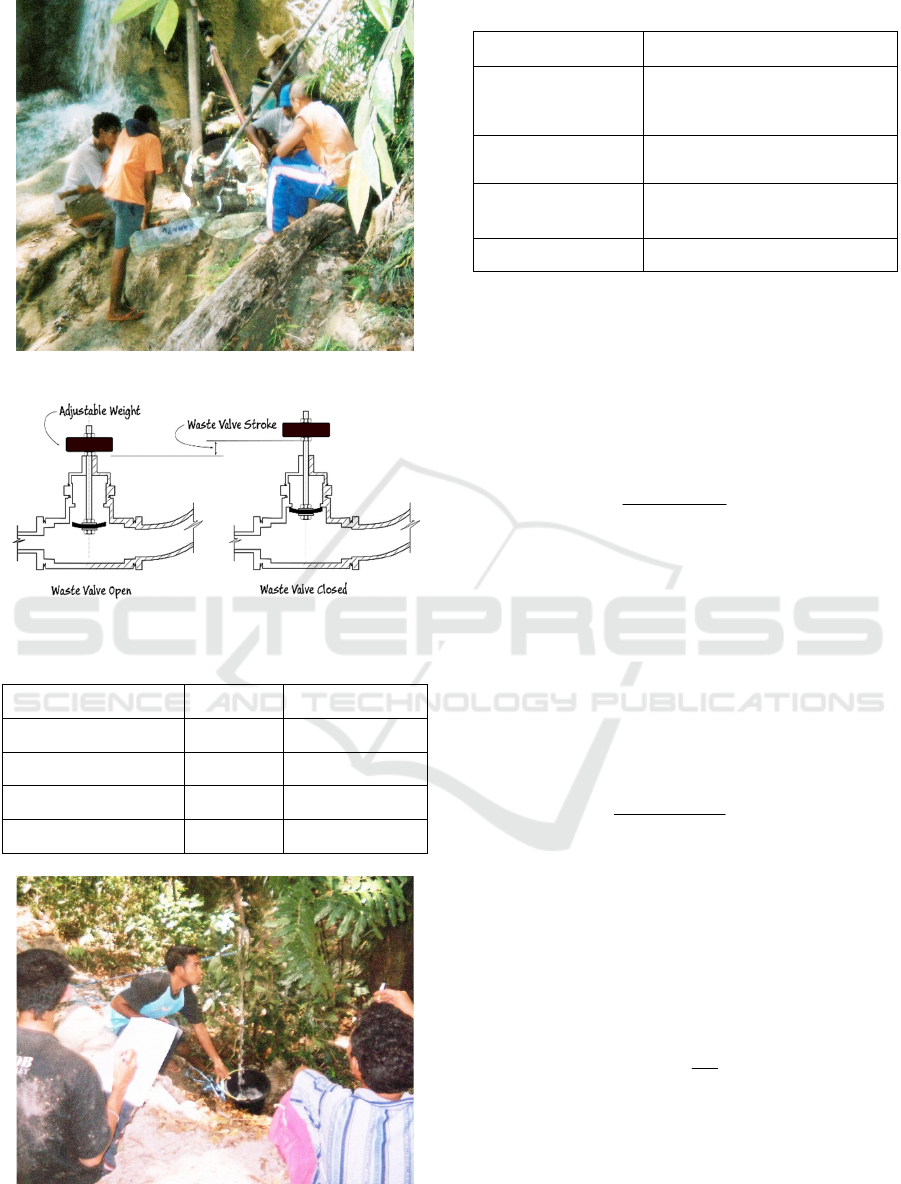
Figure 3: Operating 3-inch Hydraulic Ram pump.
Figure 4: Waste valve weight and stroke length.
Table 1: Installation Arrangement.
Drive Pipe Delivery Pipe
Vertical height (head) 4.5 m 14 m
Inner Diameter 50 mm 25 mm
Length 6 m 18 m
Material GIP GIP
Figure 5: Delivered water flow measurement.
Table 2: Experiment Variables.
Variables Value
Waste Valve Stroke
5mm, 10mm, 15mm, 20mm,
25mm, 30mm, 35mm, 40mm,
45mm, 50mm, 55mm, 60mm.
Waste Valve Weight
1kg, 1.5 kg, 2kg, 2.5kg, 3kg, 3.5kg,
4kg, 4.5kg, 5kg, 5.5kg, 6kg
Waste Valve pulse
(beat)
Beat per minute (BPM)
Efficiency D’Abbusion (%)
2.2 Calculation and Analysis
The calculation of the hydraulic ram pump efficiency
(%) is taken from the ratio of the Supply head and
Supply water flow rate to the delivery head and
delivered water flow rate which is expressed in D,
Aubusson equation as follows;
()
HQQ
HQ
w
d
∗+
∗
: E
(1)
A ten liters water bucket and a stopwatch were
used to measure the wastewater flow rates by three
repetitions for each measurement, the same method
was used to measure delivered water flow rate while
using an eight liters water bucket.
Head Losses calculation in the pipe system also
included using the Hazen Williams formula, for the
friction head losses calculations the following
formula was carried out ;
L
D
C
Q
hf ×=
85,485,1
85,1
666,10
(2)
Where hf is the head losses because of friction
inside pipes (m), C is the Hazen Williams coefficient
and in this research using 120 as for galvanized iron
pipes, D is the inner diameter of pipes (m), dan L
stands for pipes length (m). Minor head losses are
also included in the considerations by using the
following formula;
g
V
Khm
2
2
2
=
(3)
Where V is the water velocity inside the pipes (m/s)
and K is the minor losses coefficients as shown in
Table 3.
Effect of Waste Valve Tuning on Hydraulic Ram Pump Efficiency
239
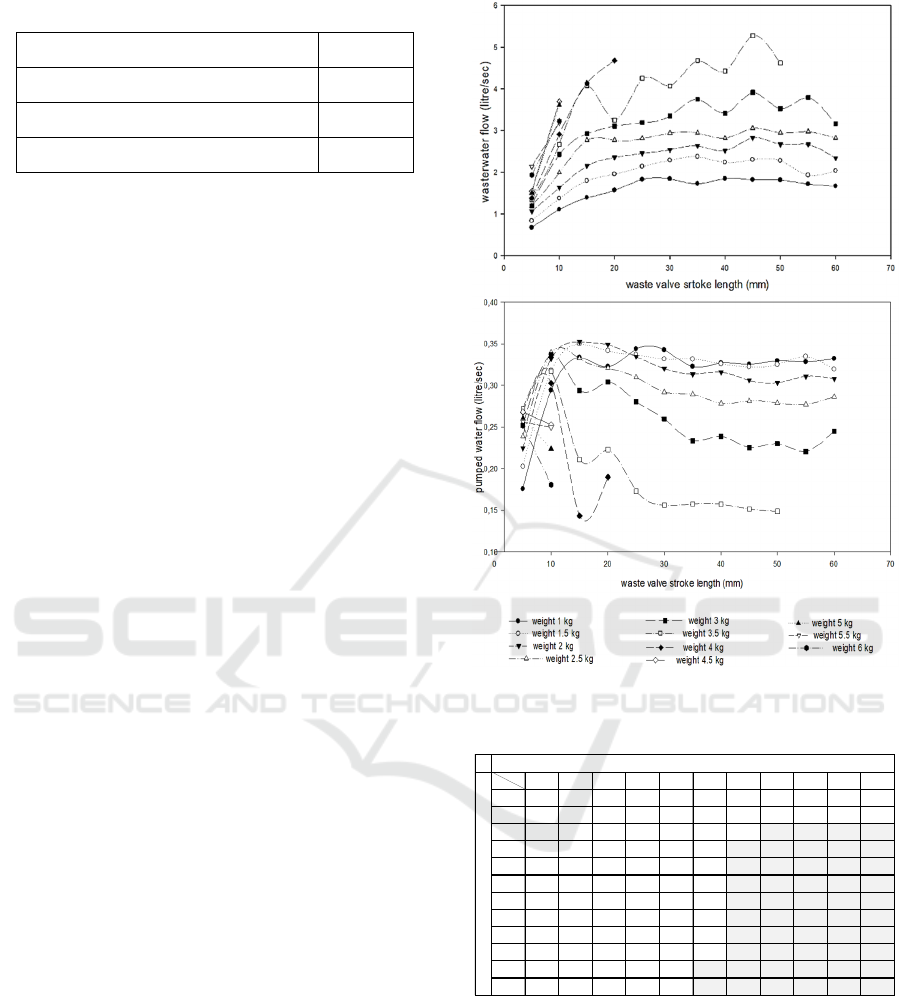
Table 3: Minor Head Losses Coefficients.
Pipe Accessories
K Value
Pipe Entrance 0.56
Gate Valve Fully opened 0.19
900 Pipe turn/ Elbows 1.5
Delivered water flow data was also used to calculate
the total headloss at the delivery pipe while the sum
of pumped water flow and the wastewater flow was
used to calculate the drive pipe total headloss. The
supply head is calculated by subtracting the static
supply head by the total headloss of the drive pipe,
while the delivery head was by adding the total
headloss to the static head measured.
Statistical analysis was carried out on the
experimental data to show how much influence the
waste valve tuning has on the efficiency of the
hydraulic ram pump, Statistical tests including a
simple Bivariate Correlation test and a partial
correlation test of Pearson Product moment as well as
a multiple correlation test, Microsoft Excel was used
to assist analytical calculations.
3 RESULT AND DISCUSSION
3.1 Presentation of Experimental Data
All experimental data were shorted and tabulated to
construct graphs that show the influence and
interaction between test variables as shown in fig. 6
and fig. 7.
From the experimental results, it turns out that the
pump is only able to operate on a part of the
combinations of weights and stroke lengths of the
waste valve, while in adjustments with certain
combinations the waste valve cannot close so that no
pumping step occurs, this is illustrated in Table 4. of
the pumping water flow measurement data where
empty cells are indicating the pump is not working, it
could happen when the waste valve stroke is set to be
long enough so the bottom side of the waste valve
reaches the large chamber inside the pump body as
shown in fig. 4, and then large open was created
reduce the lift force needed to push the valve upward
at waste valve shutting cycle.
Figure 6: Wastewater and delivered water flow results.
Table 4: Pumped Water flow data in liter/second.
As shown in fig.6 the wastewater flows tend to
increase when adding weight as well as adding the
length of valve stroke. For lengths longer than 25
millimeters, wastewater flows are likely to be more
constant while still highly changed under influence of
valve weight. In another hand, delivered water flow
showed more fluctuated data for most combinations
of waste valve weight and stroke length; the delivered
water flows increased until the ten-millimeter length
1kg 1.5 kg 2 kg 2.5 kg 3 kg 3.5 kg 4 kg 4.5 kg 5 kg 5.5 kg 6 kg
5mm 0,18 0,20 0,22 0,24 0,25 0,27 0,27 0,27 0,26 0,26 0,25
10mm 0,29 0,32 0,33 0,34 0,34 0,32 0,30 0,25 0,22 0,25 0,18
15mm 0,33 0,35 0,35 0,33 0,29 0,21 0,14
20mm 0,32 0,34 0,35 0,32 0,30 0,22 0,19
25mm 0,34 0,34 0,33 0,31 0,28 0,17
30mm 0,34 0,33 0,32 0,29 0,26 0,16
35mm 0,32 0,33 0,31 0,29 0,23 0,16
40mm 0,33 0,33 0,32 0,28 0,24 0,16
45mm 0,33 0,32 0,31 0,28 0,23 0,15
50mm 0,33 0,33 0,30 0,28 0,23 0,15
55mm 0,33 0,33 0,31 0,28 0,22
60mm 0,33 0,32 0,31 0,29 0,24
Waste valve stroke length
waste valve weight
iCAST-ES 2021 - International Conference on Applied Science and Technology on Engineering Science
240
of waste valve stroke adjustment and for the next
longer stroke adjustment the data is significantly
decreasing, which means more length cause mostly
reduce the pumped water flow. the most wasted water
flow was 5.2 liters per second which were obtained at
the combination of 4.5 mm valve stroke length by 3.5
kg valve weight, and for the highest delivered water
flow was 0.35 liters per second at the combination of
15 mm valve stroke length and 2 kg valve weight.
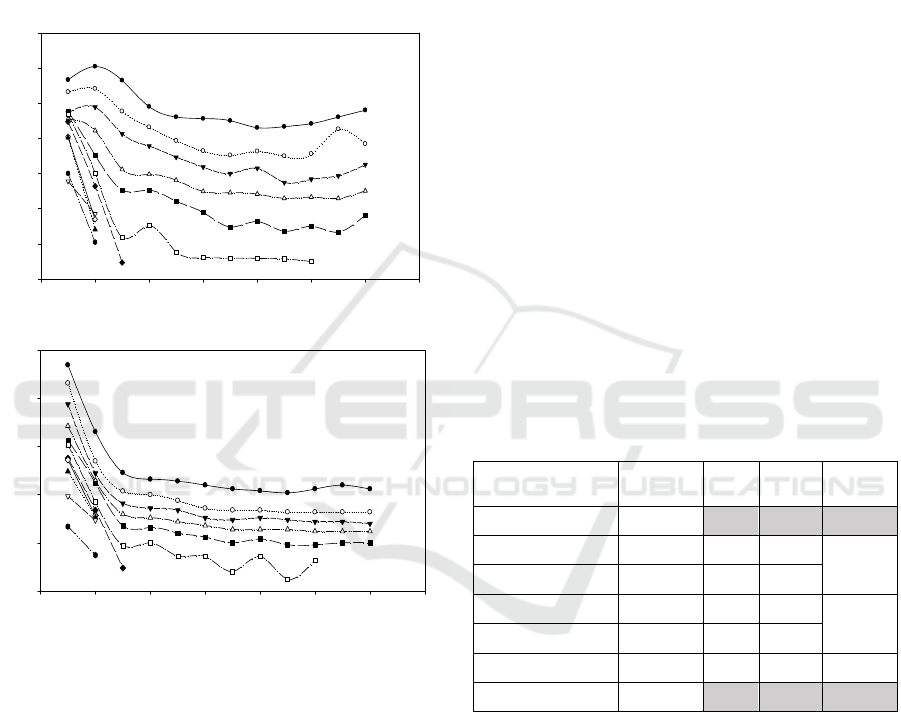
Figure 7: Pump Efficiency and Waste Valve Pulse.
Efficiency is determined by how efficiently the pump
converting resource energy in the form of supply head
and supply water flow rate to do works as presented
by a delivery head and delivery flow rate. The first
graph in fig. 7 shows that the combination of the
waste valve stroke heights and weights strongly affect
the pump efficiency, it can be seen that for each line
of valve weight variations there is a maximum
efficiency resulted from adjusting the valve stroke
length, in this experiment the effective valve stroke
length adjustment is between 5 mm to 10 mm, while
the valve stroke length more than 15 mm shows a
tendency of efficiency reduction. Maximum
efficiency reached is 70.45% at 1 kg waste valve
weight and 10 mm valve stroke adjustment. The
second graph in Fig. 7 shows the number of waste
valve pulsations which decreases with the increase of
the waste valve stroke length and weight, the less
number of pulses indicates the longer time the waste
valve is in the open position, which increases
wastewater discharge.
3.2 Statistical Analysis Results
Bivariate correlation was carried out to calculate the
respective correlation coefficient (r
x1y
) values
between the variables; the weight of waste valve (x
1
)
and the pump efficiency (y), also the value of the
correlation coefficient (r
x2y
) between the variables
stroke length (x
2
) and pump efficiency.
To find out the influence of each independent
variable if one variable is set (constant), a partial
correlation analysis is carried out by first calculating
the bivariate correlation coefficient (r
x1x2
) between
weights and stroke length then calculate the
correlation coefficient (r
p_x1y
) of the waste valve
weight on efficiency if the stroke length variable is
fixed and vice versa (r
p_x2y
).
Double correlation analysis was also conducted to
determine the correlation coefficient R
yx1x2
representing the effect of valve weight and valve
stroke length together on pump efficiency.
Table 5: Statistical Analysis Results.
Correlation
Coefficient
Value Test Value
*Tables
value
r
x1x2
-0,38
r
x1y
-0,62 t1 -7,03 1,66
r
x2y
-0,25 t2 -2,33
r
p_x1y
-0,80 t1 -11,82 1,66
r
p_x2y
-0,67 t2 -8,23
R
yx1x2
0,81 Fh 77,32 3,12
R
2
0,66
Number of data = 82, α =0.5 , test value>tables value
Statistical analysis shows a strong correlation
between the adjustment of the weight and stroke
length of the waste valve on the working efficiency of
the pump. The correlation coefficient value for the
valve weight variable is greater, indicating that the
valve weight factor has a more significant effect on
efficiency. The effect of the interaction between
weight and the stroke length of the waste valve weight
on efficiency is very significant at 66% while the
other 34% is influenced by other factors such as pump
construction factors etc, the negative value of the t-
test indicates the relationship between the variables
Waste Valve stroke length (mm)
0 10203040506070
Pump Efficiency (%)
10
20
30
40
50
60
70
80
0 10203040506070
Waste Valve Pulse (BPM)
0
50
100
150
200
250
waste valve stroke length (mm)
Effect of Waste Valve Tuning on Hydraulic Ram Pump Efficiency
241

where the addition of weight and the stroke length of
the waste valve tends to decrease the efficiency value,
this is in accordance with the graphic analysis.
4 CONCLUSIONS
From the results of the research that has been carried
out, it can be concluded that the adjustment of the
waste valve by varying the weight and length of the
waste valve stroke greatly affects the performance of
the installed hydraulic ram pump, from the results of
graphic and statistical analysis it can be seen the
following things;
The addition and reduction of the waste valve
weight has a more significant effect on the
performance of the hydraulic ram pump, both the
water flow produced and the pump work efficiency
value
In this study, we found the difference between
valve adjustment for maximum pump discharge and
waste valve adjustment for maximum efficiency. For
maximum pump discharge, the waste valve is set at a
weight of 2 kg with a valve stroke length of 15mm
while for maximum efficiency the valve is adjusted at
a weight of 1 kg and a stroke length of 10 mm. This
fact provides an option for practical waste valve
adjustment where for water sources with abundant
source flow the adjustment can be targeted for the
largest pump discharge while for sources with the
limited flow the setting with maximum efficiency is a
good choice.
increasing both the weight and the length of
the valve stroke after passing its maximum effect
value does not have any beneficial effect
ACKNOWLEDGEMENTS
We are very grateful to the Center for Research and
Community Service at the Kupang State Polytechnic
for the opportunity and support through the regular
internal research program in 2021 so that we can
complete and publish this research.
REFERENCES
Asvapoositkul, Wanchai, Jedsada Juruta, Nattapong
Tabtimhin, and Yosawat Limpongsa. 2019.
“Determination of Hydraulic Ram Pump Performance:
Experimental Results.” Advances in Civil Engineering
2019.
Fatahi-alkouhi, Reza, Babak Lashkar-ara, and Alireza
Keramat. 2019. “On the Measurement of Ram-Pump
Power by Changing in Water Hammer Pressure Wave
Energy.” Ain Shams Engineering Journal 10(4): 681–
93. https://doi.org/10.1016/j.asej.2019.05.001.
Hatipoğlu, Tuğçen, İbrahim Nakay, Erhan Köksal, and
Alpaslan Fığlalı. 2018. “Feasibility Analysis of a
Hydraulic Ram Pump Investment Project.” Arabian
Journal of Geosciences 11(9): 9–12.
Jeffery, T.D. et al. 2005. “Design, Sizing, Construction and
Maintenance of Gravity-Fed System in Rural Areas.” In
Design, Sizing,Construction and Maintenance of
Gravity-Fed System in Rural Areas, ACF, 68.
https://www.pseau.org/outils/ouvrages/acf_gravity_fe
d_system_in_rural_areas_6_hydraulic_ram_pump_sys
tems_2009.pdf.
Sarma, Dhrupad et al. 2016. “Investigation and Parameter
Optimization of a Hydraulic Ram Pump Using Taguchi
Method.” Journal of The Institution of Engineers
(India): Series C 97(4): 551–59. http://link.sprin
ger.com/10.1007/s40032-016-0295-0.
Setyawan, Aris Eko (Universitas Negeri Surabaya), and
Indra Herlamba (Universitas Negeri Surabaya) Siregar.
2015. “Pengaruh Berat Katup Limbah Dan Ketinggian
Discharge Terhadap Kinerja Pompa Hidram.” JTM
03(03): 25–31.
Suarda, M., M. Sucipta, and I. G.K. Dwijana. 2019.
“Investigation on Flow Pattern in a Hydraulic Ram
Pump at Various Design and Setting of Its Waste
Valve.” In IOP Conference Series: Materials Science
and Engineering, Institute of Physics Publishing.
Suarda, Made, Ainul Ghurri, Made Sucipta, and I. Gusti
Bagus Wijaya Kusuma. 2018. “Investigation on
Characterization of Waste Valve to Optimize the
Hydraulic Ram Pump Performance.” AIP Conference
Proceedings 1984.
Suwandi. 2015. “Pengaruh Variasi Beban Katup Di Bawah
450 Gram Menggunakan Panjang Pipa Input 6 Meter
Terhadap Kinerja Pompa Hidram.” Widya Teknika
23(2): 50–53.
Watt, S. B. 1975. A Manual on the Hydraulic Ram for
Pumping Water. 1st ( Revi. London: Intermediate
Technology Publications Ltd.
iCAST-ES 2021 - International Conference on Applied Science and Technology on Engineering Science
242
