Shore Protection Structures on the Coast of Biduk-Biduk District,
Indonesia
Tommy Ekamitra Sutarto
a
Department of Civil Engineering, Politeknik Negeri Samarinda, Jl. Ciptomangun Kusumo, Samarinda, Indonesia
Keywords: Shore Protection Structure, Seawall, Wave Prediction, Fetch, Wave Height, Tide.
Abstract: Biduk-Biduk Beach in Kalimantan Timur Province of Indonesia continues to experience abrasion, while the
existing shore protection structures were yet uneffective. In some places, structural failure occurs, even the
existing structures had occupied wide space and create aesthetical issues. The purpose of this study was to
determine proper sites, type, and design of shore protection structures that meet planning standards such that
the structures were stable, effective in controlling abrasion, and in line with the Biduk-Biduk coastal tourism
development plan. The study was performed in four stages, namely: 1) the preparation and preliminary
survey, 2) the main survey, 3) the data analysis and design, and 4) the drawing stage. Soil mechanics,
topography, coastal bathymetry, and tidal surveys were conducted at the properly selected location. The
structures were designed following technical standards to withstand extreme waves of 25 year return period.
The most suitable type of structure was seawall with core materials of cyclopean concrete (60% concrete
and 40% local stone) and surfacial material of 20 cm-thick reinforced concrete slab (f’c = 26.4 MPa). The
seawall had front wall slope of 1:1.5. The toe of the seawall was seated 1.8 m below beach floor to avoid
failure due to undermining of the toe by waves and currents.
a
https://orcid.org/0000-0003-3444-0074
1 INTRODUCTION
Biduk-Biduk is one of the districts within the Berau
Regency which is located in the east coast of
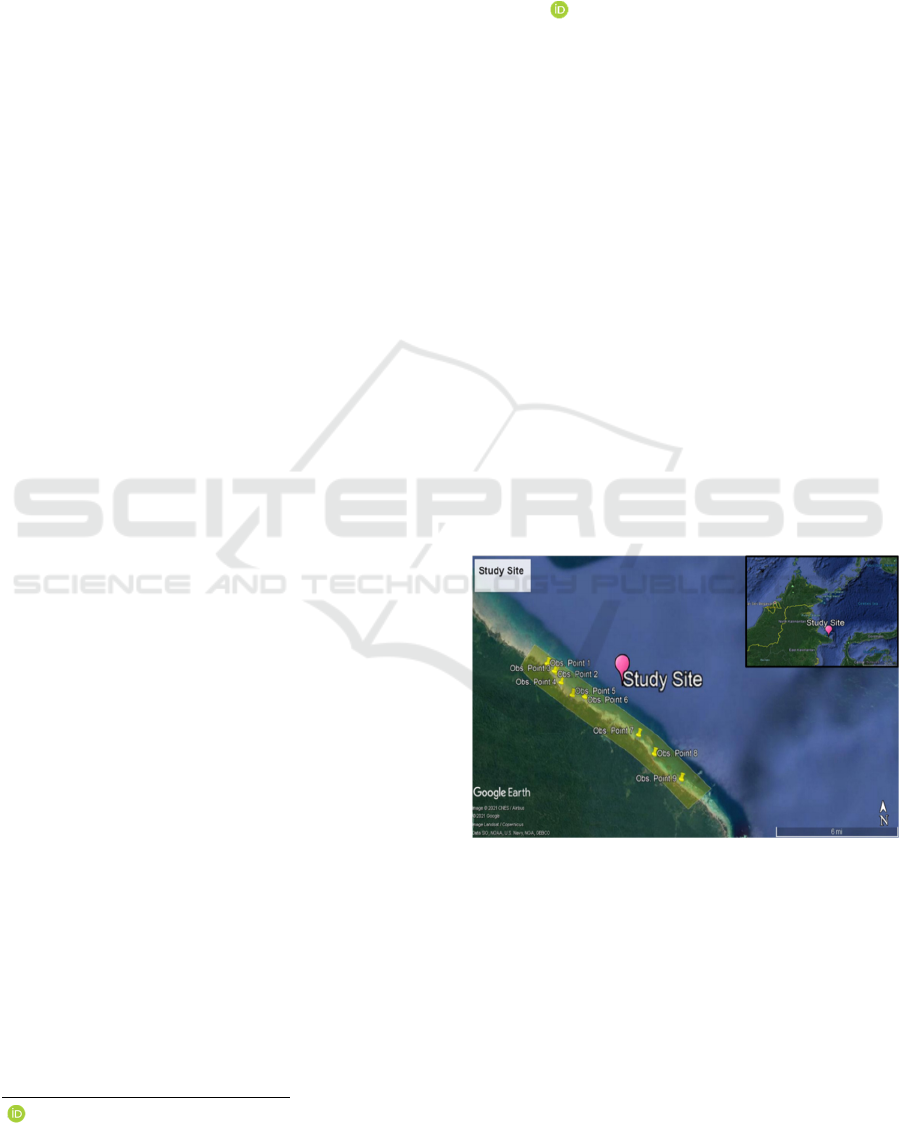
Kalimantan Timur Province, Indonesia (Figure 1).
This district has a shoreline with a length of 67 km
(Maryadi et al., 2020) and an area of 3,423 km
2
(BPS, 2020) which is divided into 6 villages
(villages). Most of the population works as
fishermen, but the district has great potential to
develop into a coastal tourism area because of its
beautiful beach panorama (Maryadi et al., 2020). In
several villages, businesses that support tourism
such as motels, restaurants, and tourist boat services
have grown in number from year to year.
Unfortunately, there was a problem on the shore
of Biduk-Biduk that may disrupt the local
community's economy and could interupt the plan
for converting the area to be one of coastal tourism
areas in Indonesia. In several observation points
along the shore from points 1 to 9 (Figure 1), the
shoreline has been retreating due to wave-induced
Figure 1: Study site: Biduk-Biduk Beach with 9 (nine)
observation points.
abrasion. This phenomenon has threaten the
existence of nearby houses (Figure 2a), motels,
roads (Figure 2b), and other public facilities
(Maryadi et al., 2020). In a periode between 2009
and 2019, the retreat length was 4 to 5 m in Pantai
Harapan Village and 5 to 6 m in Biduk-Biduk
Village (Maryadi et al., 2020).
Sutarto, T.
Shore Protection Structures on the Coast of Biduk-Biduk District, Indonesia.
DOI: 10.5220/0010942500003260
In Proceedings of the 4th International Conference on Applied Science and Technology on Engineering Science (iCAST-ES 2021), pages 213-220
ISBN: 978-989-758-615-6; ISSN: 2975-8246
Copyright
c
2023 by SCITEPRESS – Science and Technology Publications, Lda. Under CC license (CC BY-NC-ND 4.0)
213
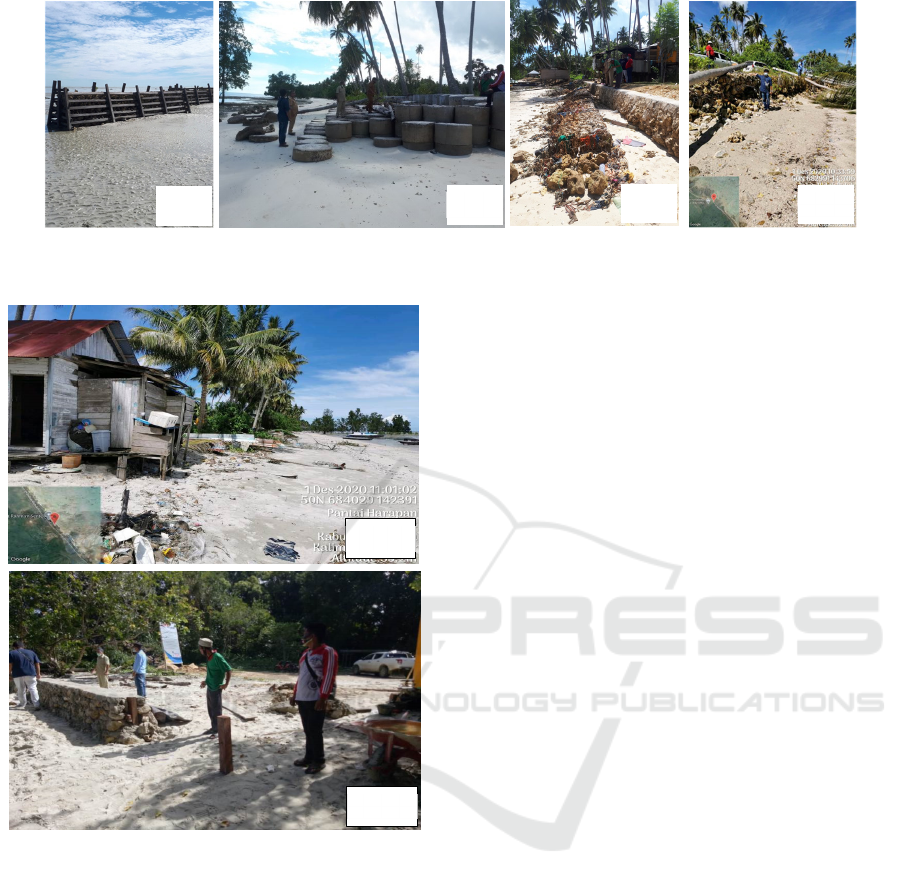
Figure 3: Simple coastal protection structures on the shoreline of Biduk-Biduk: (a) breakwater, b) concrete-ring revetment,
c) rock revetment, d) gabion.
Figure 2: Wave-induced abrasion threaten the exsistence
of nearby facilites such as: (a) houses, and (b) roads.
Simple shore protection structures such as
breakwater of wood and stone (Figure 3a), concrete-
ring revetment (Figure 3b), rock revetment (Figure
3c), and gabion (Figure 3d) were constructed in
order to control the rate of abrasion in several
locations. However, most of the structures failed to
fullfill their functions. In some locations, structural
failures can be observed (Maryadi et al., 2020).
Apparently, existing structures were designed
based on modest common practices without support
from sufficient data and engineering analysis. The
breakwaters (Figure 3a) were unstable and
experienced frequent overtoping especially during
the occurrence of spring tide coincided with strong
winds. This condition typically occurs in April.
Implementation of concrete-ring revetment (Figure
3b) brought spatial and aesthetic issues into attention
when considering future plan for Biduk-Biduk as a
tourist destination. Rock revetments (Figure 3c) also
experiences frequent overtoping. Instead of
absorbing wave energy, these structures created
wave reflection capable of eroding the shoreline.
Similarly, the existing gabions (Figure 3d) were
commonly failed due to corrosion that damaged their
wires.
Considering its potential for tourism whereas the
existing shore protection structures were not
effective, Biduk-Biduk needed a comprehensive
shore protection plan that consider site prioritization,
suitable type of protection structure, and address the
limitations of existing structures. This plan should
go along with efforts to preserve mangrove forests
which have long been a natural fortress to prevent
abrasion on Biduk-Biduk Beach (Prasetyo et al.,
2014).
The purpose of this study was to develop a
procedure for determining the location, type, and
design of effective shore protection structures that
fulfilled engineering standards such that those
structures were not only effective in controlling
abrasion on Biduk-Biduk Beach, but also stable,
durable, and in line with local spatial and landuse
planning.
2 STUDY SITES
The study sites (Figure 1) were located in Pantai
Harapan Village (118.64° E, 1.29° N) and Biduk-
Biduk Village (118.72° E, 1.23° N). Both villages
are directly adjacent to the Sulawesi Sea. More
specifically, the study was focussed on 9 (nine)
locations (Figure 1), later called observation points,
along the shore. Observation point 1 to 6 were
located in Pantai Harapan Village, while the others
were in Biduk-Biduk Village.
(
a
)
(
b
)
(
c
)
(
d
)
(a)
(b)
iCAST-ES 2021 - International Conference on Applied Science and Technology on Engineering Science
214
3 METHODOLOGY
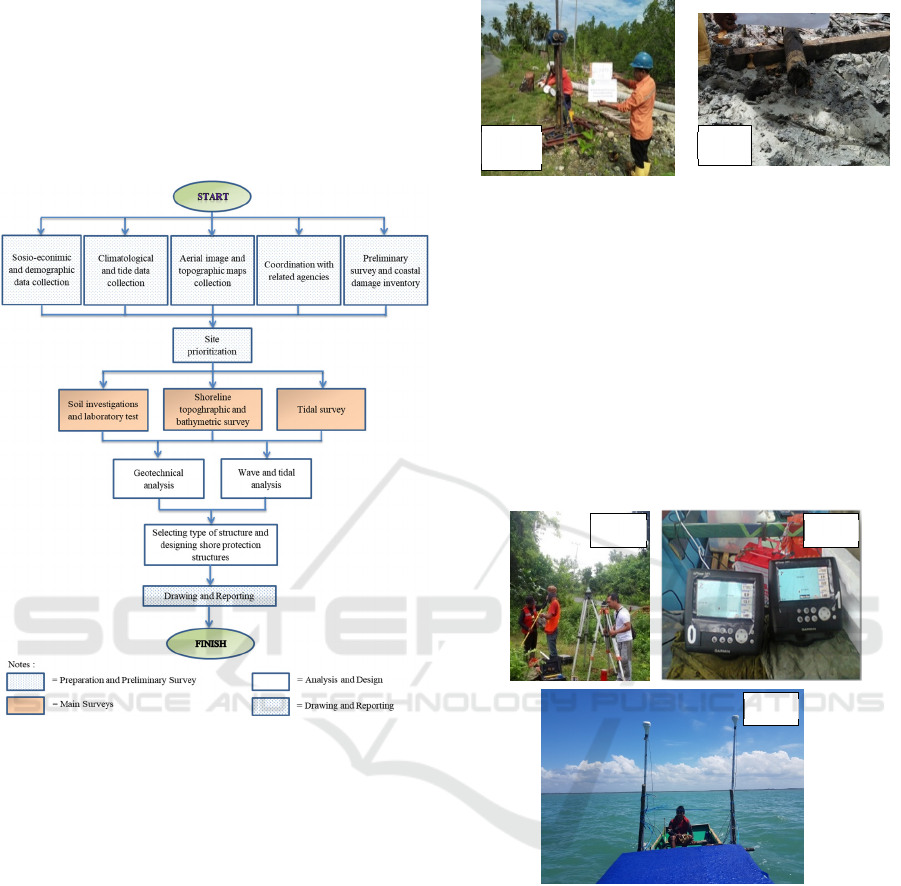
This study was performed in 4 (four) stages, i.e.: 1)
preparation and preliminary survey, 2) main surveys,
3) data analysis and detail design, and 4) drawing
and reporting. Each stage consisted of several
activites as outlined below (Figure 4).
Figure 4: Study procedure.
Preliminary survey was performed by site visits
and observing the condition on 9 (nine) observation
points (Figure 1). The purposes of preliminary
survey was to inventory the condition of available
structures including their damages, to identify the
locations where intensive abrasion occurred and type
of damage it brought to nearby infrastructures, and
to discover potential source of construction
materials, such as rock quarries, near the location.
The second stage was main surveys. In this stage
primary data were obtained through direct
measurements, including primary soil data,
nearshore topographic map and shore bathymetric
data, as well as tidal data. The activites were focused
on the selected sites where the structures would be
constructed. This stage including 1) soil field and
laboratory tests, 2) topographic and bathymetric
surveys, and 3) tidal survey. Dutch cone penetration
tests were performed to determine the bearing
capacity of foundation soils (Figure 5a). Hand
boring technique (Figure 5b) was applied to obtain
Figure 5: Soil investigation: (a) Dutch cone penetration
test, (b) undisturbed soil sampling.
undisturbed soil samples. Topographic measurement
was conducted in nearshore zone using real-time
kinematic global positioning system (RTK-GPS)
(Figure 6a), covered an area with a length of 2000 m
and a width of 50 m from the shoreline toward the
hinterland. Bathymetric survey was performed side
by side with topographic suvey, covered an area
with a width of 400 m from the shoreline toward the
sea in the shore zone. The bathymetric survey was
conducted using echounder GPSMap 580/585
(Figure 6b and 6c).
Figure 6: Topographic and bathymetric surveys: (a) GPS
Geodetic RTK (b) echosounder GPSMap 580/585, (c)
echosounding.
The third stage was analysis and design. In this
stage, 4 (four) tasks were performed, i.e. 1)
geotechnical analysis, 2) wave and tidal analysis,
and 3) selection of suitable type of structure and 4)
designing shore protection structures, including
determining their construction materials, elevation,
and dimensions. All primary and secondary data
obtained from previous stages were analysed to
obtain required information that would dictate the
dimension of structures. A weighted scoring model
was developed to help determining the most suitable
type of structure for each location.
(a)
(b)
(
a
)
(
b
)
(
c
)
Shore Protection Structures on the Coast of Biduk-Biduk District, Indonesia
215
The last stage in this study procedure was
drawing and reporting. The main activities in this
stage were to make technical drawings for all the
designed structures and to produce study reports that
explained all the activites and results obtained in
every stage of the study.
Figure 7: Results of topographic and bathymetric surveys
at Pantai Harapan Village (point 6): (a) contour, (b) typical
cross-shore profile
4 RESULTS AND DISCUSSION
4.1 Shore Topography and Nearshore
Bathymetry
Topographic and bathymetry measurements were
performed on the shore and nearshore zone in Pantai
Harapan Village (observation point 6). Topographic
measurement was conducted 50 m from shoreline
toward hinterland using real-time kinematic global
positioning system (RTK-GPS) (Figure 6a), while
bathymetry measurement was performed 400 m
from the shoreline toward the sea using echosounder
GPSMap 580/585 (Figure 6b and 6c). The contour
map for the measured area in shore and nearshore
zones were presented in Figure 7a. Also a typical
cross-shore profile could be seen in Figure 7b. The
beach slope was typically mild, ranging from 1 to 3
%. The beach slope was typically mild, ranging from
1 to 3 %. Beach material composition was
dominated by white fine sand with less coarse sand.
A little portion of coral reef fragments were also
found in some locations. Typically, beach sediments
originate many miles inland where upland and
riverbank erosions produce sediments
(Papanicolaou, et al., 2014; Sutarto, 2015, 2018,
2020) that were supplied to the beach by streams and
rivers. When these sediments reached the shore, they
were transported alongshore by waves and current.
However, on the shore of Biduk-Biduk, the beach
sediments were most probably derived from erosion
of coastal formation caused by waves and currents.
4.2 Tide
Biduk-Biduk beach experienced semi-diurnal tide
cycle with two high and two low tides of
aproximately equal size every lunar day. The most
prominent spring tide occurred on March 31 in new
moon phase. The high water spring (HWS) was at
1.55 m (msl) and the low water spring (LWS) was at
-1.46 (MSL) with mean sea level (MSL) as a datum
+0.00 m.
4.3 Fetch Length, 𝑭
The fetch map for Biduk-Biduk Beach was
presented in Figure 8. The winds from the north,
north-east, east, south-east, and north-west were
prominent in generating wave on Biduk-Biduk
Beach. The effective fetch lengths, at any prominent
wind direction, were determined for Biduk-Biduk
Beach. The results were presented in Table 1.
Figure 8: Fetch map for Biduk-Biduk Beach.
Table 1: Effective fetch.
Wind
direction
Effective fetch, F
(m) (km)
North 332,220 332.22
North East 764,628 764.63
East 959,880 959.88
South East 154,317 154.32
North West 101,653 101.65
4.4 Wave Height, 𝑯, and Period, 𝑻, in
Deep Water
The wave, in this case, refered to the sea wave
generated by wind blowing over the sea (Van
(a)
(b)
iCAST-ES 2021 - International Conference on Applied Science and Technology on Engineering Science
216

Table 2: Calculation of wave height, 𝐻, and wave period, 𝑇, in deep water.
Year
a)
U
L (10)
(m/det)
Wind
Direction
F (m)
b)
R
L
c)
U
w
(m/s)
d)
U
A
(m/det)
e)
H
(m)
f)
T
(s)
2011 2.06 NE 764,628 1.75 3.61 3.44 1.54 8.60
2012 3.09 NE 764,628 1.65 5.10 5.27 2.35 9.92
2013 3.09 NE 764,628 1.65 5.10 5.27 2.35 9.92
2014 3.09 N 332,220 1.65 5.10 5.27 1.55 7.51
2015 3,09 N 332,220 1.65 5.10 5.27 1.55 7.51
2016 3.09 N 332,220 1,65 5.10 5.27 1.55 7.51
2017 4.12 N 332,220 1.50 6.18 6.67 1.96 8.13
2018 3.09 N 332,220 1.65 5.10 5.27 1.55 7.51
2019 3.09 N 332,220 1.65 5.10 5.27 1.55 7.51
2020 4.64 NE 764,628 1.45 6.73 7.41 3.31 11.11
a)
Maximum wind speed U
L (10)
obtained from
d)
U
a
calculated using equation
(2).
weather station in Kalimarau Airport, Berau.
e)
H
calculated using equation (3).
b)
R
L
determined based on U
L
versus R
L
curve (CERC, 1984, p. 3.31).
f)
T calculated using equation (4).
c)
U
w
calculated using equation (1).
Vledder and Akpinar, 2015; Chun and Suh, 2019).
Its height and period were dictated by a combination
of three variables, namely, wind speed, wind
duration, and fetch.
Table 2 presents the calculation of wave height,
𝐻, and wave period, 𝑇, in deep water. The wind
speed data were used as input. These data were
obtained from the nearest weather station in
Kalimarau Airport, Berau for a period from 2011
until 2020 (see column 2 Table 2). The 𝑅
value was
determined based on 𝑈
versus 𝑅
curve available in
Shore Protection Manual (CERC, 1984). The 𝑈
and 𝑈
values were calculated using equation (1)
and (2), respectively. Later, the H and T values
could be approximated using equation (3) and (4),
successively.
𝑈
=𝑅
𝑈
(1)
𝑈
=0.71
𝑈
,
(2)
𝐻 = 1.6 10
/
(3)
𝑇 = 2.857 10
/
(4)
4.5 Design-wave Height, 𝑯
𝒐
, and
Period, 𝑻
𝒐
A 25-year wave coresponded to the design wave by
which the dimensions of shore protection structure
were determined. The design-wave height, 𝐻
, was
equal to the 25-year wave height, 𝐻
, which was
obtained from statistical analysis of long-term
extreme wave hindcast.
In this case, a frequency distribution analysis was
performed for 10 (ten) wave-height data from 2011
until 2020 presented in Table 2. Using Smirnov-
Kolmogorov test, it was found that frequency
distribution of wave-height best fitted Gumbel
distribution as shown in Figure 9, and the 25-year
wave height, 𝐻
, was equal to 3.61 m (Figure 9).
Accordingly, the design wave height, 𝐻
, was equal
to 3.61 m. By substituting 𝐻
= 3.61 m and 𝐹 =
764.628 m (the longest fetch) into equation (3) and
(4), the value of design-wave period, 𝑇
, was found
and it was equal to 11.44 seconds.
Figure 9: Wave-height frequency distribution follows
Gumbel distribution.
4.6 Suitable Type of Structure
Three different types of structure, namely, rock
revetment, cyclopean seawall, and concrete or rock
Shore Protection Structures on the Coast of Biduk-Biduk District, Indonesia
217

armoured breakwater had the potential to be selected
as the most suitable type of structure.
Further assessment were performed using a
weighted scoring model to select the most suitable
one out of those three alternative structures
especially for the location denoted as observation
point 6 in Pantai Harapan Village. Cyclopean
seawall was the most appropriate type of structure
for the location named as observation point 6 in
Pantai Harapan Village.
The cyclopean seawall could address the
limitation of the available concrete-ring revetment
on the site. In contrast to the revetment, the seawall
occupied less space and could be designed not to
experience overtopping (US Army Corps of
Engineers, 2011) even in certain extrem event, for
instance, a 25-year wave. Also, seawall was more
preferable than breakwater with respect to
construction cost, ease of construction, simplicity in
repairment, and availability of construction material.
4.7 Seawall Design
For design purpose, the following data, obtained
from previous survey and analysis, were
summarized here. High Water Spring (HWS) =
+1.55 m (MSL), Mean Sea Level (MSL) = +0.00 m,
Low Water Spring (LWS) = -1.46 m (MSL), beach
slope, 𝑚 = 0.033 (Figure 7b), design-wave height,
𝐻
= 3.61 m (25-year wave), design-wave period, 𝑇
= 11.44 seconds, dan beach floor elevation = +0.8
(MSL) (Figure 7b).The core material for the seawall
was cyclopean concrete consisted of 60% concrete
and 40% local stone, while the surfacial material
was 20 cm-thick reinforced concrete slab (f’c = 26.4
MPa) (Figure 10).
4.7.1 Design-wave Length in Deep Water, 𝑳
𝟎
Design-wave length in deep water, 𝐿
, was
approximated by the following formula (Triatmodjo,
2011):
𝐿
=1.56
𝑇
(5)
Substituting 𝑇
= 11.44 m into equation (5) gave 𝐿
= 204.16 m.
4.7.2 Equivalent Wave Height in Deep
Water, 𝑯
𝟎
Taking into account the wave refraction, the
equivalent wave height in deep water, 𝐻
, was
approximated using the following formula:
𝐻
= 𝐾
𝐻
(6)
where 𝐾
was refraction coefficient. Substituting 𝐾
= 0.95 and 𝐻
= 3.61 m into equation (6) gave 𝐻
=
3.43 m.
4.7.3 Breaking Wave Height, 𝑯
𝒃
Breaking wave height, 𝐻
, could be determined
using a relation curve for
and
provided in
Shore Protection Manual Volume II (CERC, 1984,
p. 7.7). Previous computation gave 𝐻′
= 3.43 m and
𝑇
= 9.36 seconds, thus
=
,
, ,
= 0.004.
Using the relation curve (for m = 0.033) gave
=
1.23, and 𝐻
= 1.23𝐻′
= 4.22 m.
4.7.4 Water Depth Corresponding to
Breaking Wave, 𝒅
𝒃
Similarly, the water depth, 𝑑
, at which the wave
start to break, could be determined using a relation
curve for
dan
provided in Shore Protection
Manual Volume II (CERC, 1984, p. 7.6). Given 𝐻
=
4.22 m and 𝑇
= 9.36 seconds, then
=
,
, ,
= 0.0049. Using the relation curve (for m
= 0.033) gave
= 1.08, accordingly 𝑑
= 4.58 m.
The condition when 𝑑
> 𝑑
it signifies the
wave had broken before reaching the structure. The
water depth near the structure, 𝑑
, could be
determined by substracting HWS level with beach
floor level, or 𝑑
= 1.55 – (+0,80) = 0.75 m.
Accordingly, 𝑑
> 𝑑
, this means the wave had
broken before reaching the structure.
4.7.5 Near-structure Wave Height, 𝑯
𝒃 𝒘𝒂𝒍𝒍
The water depth near the toe of the structure, 𝑑
,
could be computed as 𝑑
= 𝑑
= 0.75 m. Given 𝑇
= 9.36 seconds and 𝑑
= 0.75 m and using the
relation curve for
dan
which was
available in Shore Protection Manual Volume II
(CERC, 1984, hal. 7.10), the maximum height of the
maximum height of wave that reached the structure,
𝐻
, could be determined. First, calculate
=
,
, ,
= 0.0008. Use the relation curve (for m=
0.033) to obtain
=1.13. Thus, 𝐻
=
1.13𝑑
= 1.75 m.
iCAST-ES 2021 - International Conference on Applied Science and Technology on Engineering Science
218

4.7.6 Wave Runup Height, 𝑹
𝒖
The seawall had inclining front wall, also called
seaward slope, covered with impermeable surfacial
layer of 20 cm-thick reinforced concrete slab (f’c =
26.4 MPa) (Figure 10). The seaward slope had an
angle, ∅, of 33.69 degrees (above horizontal) or a
slope of 1:1.5. This slope would affect the height of
wave runup on the seawall, 𝑅
, and frequency of
overtopping. Steeper slope would result in less
frequent overtopping (Orimoloye et al., 2013; Huang
et al., 2020).
For determining the value of 𝑅
, first, calculate
Irribaren number using the following equation
(Triatmodjo, 2011):
𝐼
=
∅
/
,
(7)
Previous analysis gave 𝐻
= 1.75 m, 𝐿
=
204,16 m, and ∅ = 33.69 degrees. Substituting these
values into equation (7) resulted in 𝐼
= 7.50. Next,
plot 𝐼
= 7.50 on the relation curve of 𝐼
versus
(Triatmodjo, 2011, p. 191) that gave
=
2.0. Thus 𝑅
=2𝐻
= 2.0 x 1.75 = 3.5 m.
Wave return wall was positioned directly at the
top of the seaward slope (Figure 10). This curved
wall would effectively block the wave runup such
that the runup height could be reduced by half.
Accordingly, 𝑅
= 3.5/2 = 1.75 m.
Previous analysis gave 𝐻
= 1.75 m, 𝐿
=
204,16 m, and ∅ = 33.69 degrees. Substituting these
values into equation (8) resulted in 𝐼
= 7.50. Next,
plot 𝐼
= 7.50 on the relation curve of 𝐼
versus
(Triatmodjo, 2011, p. 191) that gave
=
2.0. Thus 𝑅
=2𝐻
= 2.0 x 1.75 = 3.5 m.
Wave return wall was positioned directly at the
top of the seaward slope (Figure 10). This curved
wall would effectively block the wave runup such
that the runup height could be reduced by half.
Accordingly, 𝑅
= 3.5/2 = 1.75 m.
4.7.7 Seawall Crest Level
The seawall was designed not to allow overtopping
by extrem waves or design waves of 25-year return
period. Therefore, a free board of 0.3 m was added
to the height of the seawall. Accordingly, the
seawall crest level, 𝐸𝑙
, could be determined
using the following equation:
𝐸𝑙
=𝐻𝑊𝑆+ 𝑅
+𝑓𝑟𝑒𝑒 𝑏𝑜𝑎𝑟𝑑 (8)
Substituting 𝐻𝑊𝑆 = 1.55 m, 𝑅
= 1.75 m, and free
board = 0.3 m into equation (8) gave 𝐸𝑙
= +3.60
m (Figure 10).
Figure 10: Seawall design for the location denoted as
observation point 6 in Pantai Harapan Village.
5 CONCLUSIONS
Cyclopean seawall was the most appropriate type of
structure for Biduk-Biduk Beach, most specifically,
the location named as observation point 6 in Pantai
Harapan Village. The cyclopean seawall could
address the limitation of the available concrete-ring
revetment on the site. In contrast to the revetment,
the seawall occupied less space and could be
designed not to experience overtopping (US Army
Corps of Engineers, 2011) even in certain extrem
event, for instance, a 25-year wave. Also, seawall
was more preferable than breakwater with respect to
construction cost, ease of construction, simplicity in
repairment, and availability of construction material.
The core material for the seawall was cyclopean
concrete consisted of 60% concrete and 40% local
stone, while the surfacial material waovers 20 cm-
thick reinforced concrete slab (f’c = 26.4 MPa). The
seawall had inclining front wall, also called seaward
slope, that had a slope of 1:1.5. Wave return wall
was positioned directly at the top of the seaward
slope to block the wave runup and avoid
overtopping. The toe of the seawall was seated 1.8 m
below beach floor to avoid failure due to
undermining of the toe by waves and currents.
ACKNOWLEDGEMENTS
This study was part of a project entitled: Review
Design of Biduk-Biduk Shore Protection Structures
funded by Office of Public Works and Public
Housing, Kalimantan Timur, Indonesia under
contract No. 602/Bid-SDA/KPA/979.J/XI/2020.
Shore Protection Structures on the Coast of Biduk-Biduk District, Indonesia
219

REFERENCES
Coastal Engineering Research Center (CERC). (1984).
Shore Protection Manual, Department of the Army
Waterways Experiment Station Corp of Engineers,
Vicksburg, Mississippi.
Chun, H., dan Suh, K.D. (2019). Empirical formulas for
estimating maximum wave height and period in
numerical wave hindcating model, Ocean
Engineering, No. 193.
Huang, C.-J., Chang, Y.-C., Tai, S.-C., Lin, C.-Y., Lin, Y.-
P., Fan, Y., Chiu, C.- M., Wu, L.-C., (2020).
Operational monitoring and forecasting of wave run-
up on seawalls, Coastal Engineering, doi:
https://doi.org/10.1016/j.coastaleng.2020.103750.
Maryadi, Setyasih, I., Anwar, Y. (2020) . Efektivitas
bangunan pemecah gelombang dalam pengendalian
abrasi pantai di Kecamatan Biduk-Biduk, Jurnal
geoedusains, No.2, Vol. 1, 107-119.
Orimoloye, S., Horrillo-Caraaballo, J., Karunarathna, H.,
Reeve, D. E. (2020), Wave overtopping of smooth
impermeabel seawalls under Unidirectional Bimodal
Sea Conditions, Coastal Engineering, doi:
https://doi.org/10.1016/j.coastaleng.2020.103792.
Papanicolaou, A.N.T., Sutarto, T., Wilson, C.G.,
Langendoen, E.J. (2014). Bank stability analysis for
fluvial erosion and mass failure. In: Proceedings of the
2014 World Environmental and Water Resources
Congress, 2014, pp. 1497–1508.
Prasetyo, D.E., Atmanegara, F.K., Zulfikar, F., Purwanti,
H.S., Sahri, A., Budiayu, A., dan Sudiono, E. (2014).
Kajian sosio-ekologis kawasan mangrove di Pesisir
Pantai Kecamatan Biduk-Biduk, Kalimantan Timur,
Omni-Akuatika, No.18, Vo.13, 1-9.
Sutarto, T.E. (2015). A combined flume-imaging
technique for measuring fluvial erosion of cohesive
stream bank soils, Procedia Engineering, Vol.125, pp.
368–375.
Sutarto, T.E. (2018) A short review on various techniques
for measuring stream bank soil erosion strength, 2018
International Conference on Applied Science and
Technology (iCAST), pp. 252-258, doi:
10.1109/iCAST1.2018.8751560.
Sutarto, T.E. (2020), Low amplitude of streambank
erosion: Distinguishing mass and surface fluvial
erosions, IOP Conference Series: Earth and
Environmental Science, No. 1, Vol. 451, 012093.
Triatmodjo, B. (2011). Perencanaan Banguan Pantai,
Beta Offset Yogyakarta, Yogyakarta.
US Army Corps of Engineers, 2011, Coastal Engineering
Manual-Part VI, Washington D.C.
iCAST-ES 2021 - International Conference on Applied Science and Technology on Engineering Science
220
