
Mobility for Long-distance: How People Choose Transportation in
the Covid-19 Pandemic Era?
Priska G. Nahak
a
, Theodorus Paling
b
and Anastasia H. Muda
c
Department of Civil Engineering, State Polytechnic of Kupang, Adisucipto Street, Kupang, Indonesia
Keywords: Mobility, Long-distance, Mode Choice, Covid-19 Pandemic, Best-worst Method.
Abstract: Transportation during the pandemic era is experiencing tremendous pressure, as although it causes the spread
of the virus, restrictions on mobility worsen its operation. Therefore, this study aims to explain a model of
mobility behavior on medium and long-distance trips in an archipelago based on the choice of transportation
mode. The data was from cases in the western Timor island, focused on traveling from Kupang to various
district cities. Data was collected using a questionnaire with a sample of 250 respondents, randomly selected
in the Kupang area. The modes of transportation included were buses, cars, motorbikes, minibuses, and car
sharing. Meanwhile, the analysis used the best-worst method (BWM) approach by comparing one mode,
labeled as the best, with another, expressed as the worst, according to each respondent's perception, to describe
the mode selection behavior before and during the pandemic. Based on the calculation algorithm in the BWM,
the output of the analysis was the weight of each mode of transportation for each respondent. The final weight
was based on the average weight estimated from the overall respondents and used to determine the ranking
of each mode of transportation. Subsequently, the results showed that buses were the best mode of
transportation, followed by cars, then car sharing, minibuses, and finally, motorbikes, which were rarely used.
During the pandemic, the best or most frequently used mode of transportation was car sharing, followed by
minibuses, cars, motorbikes, and buses as the last alternative in the ranking. This finding shows that long-
distance travellers are more prone to the spread of Covid-19 virus. Therefore, clear regulations are needed
regarding car sharing operations to ensure the provision of excellent services. Also, the improvement of
intercity bus services is important, especially in terms of capacity management, cleanliness, and the
application of health protocols during trips.
1 INTRODUCTION
Transportation, which has become a vital part of
human life, became one of the causes of the massive
viral spread during the pandemic. A study conducted
by Iacus et al. (2020) showed transportation
accounted for approximately 92% of the virus spread
at the beginning of the pandemic and decreased after
mobility was controlled. At the same time, many
transportation operators have suffered losses due to
the decline in travel within and between cities
(Tirachini and Cats, 2020). The identification result
by Labonté-Lemoyne et al. (2020) showed the
widespread shifting of people from public to private
vehicles on their daily commute. This was supported
a
https://orcid.org/0000-0003-2584-5045
b
https://orcid.org/0000-0001-5656-9034
c
https://orcid.org/0000-0002-2136-7616
by other findings in the United States that there was a
dynamic shift in travel behavior with people's
perception of the Covid-19 impact (Truong and
Truong, 2021). In addition, mobility within
Shenzhen, China, has decreased by 20-60%, causing
a delay in the growth of the virus spread (Zhou et al.,
2020).
Population diversity, mobility patterns, and
spatial factors affect the time needed to overcome a
pandemic. A study by Merler and Ajelli (2010)
showed that the diversity of mobility with varying
levels of activity provides different levels of disease
spread, causing closures and activity restrictions to be
more effective control measures. However, these
activity restrictions impact changing travel behavior.
194
Nahak, P., Paling, T. and Muda, A.
Mobility for Long-distance: How People Choose Transportation in the Covid-19 Pandemic Era?.
DOI: 10.5220/0010942200003260
In Proceedings of the 4th International Conference on Applied Science and Technology on Engineering Science (iCAST-ES 2021), pages 194-202
ISBN: 978-989-758-615-6; ISSN: 2975-8246
Copyright
c
2023 by SCITEPRESS – Science and Technology Publications, Lda. Under CC license (CC BY-NC-ND 4.0)

(Przybylowski et al., 2021) found that the majority of
people surveyed reduced their use of public
transportation and would reuse it, providing Covid 19
is more controlled. The study conducted by (Chang et
al., 2021) showed that people with high travel
activities were more susceptible to the virus
transmission, where most of them were lower-
middle-income people who cannot freely decide to
reduce mobility. In addition, Chen et al.'s (2020)
analysis results showed a positive correlation of travel
restrictions with the spread of disease at the beginning
of the pandemic, where higher restrictions led to
reduced viral spread. The study analyzed two main
strategies, namely without and with intervention on
public transportation, where the first strategy allowed
the maximum number of Covid-19 infected cases and
the second reduced it.
According to Shen et al. (2020) long-term
effective prevention and control measures need to be
adopted by public transportation. Since the risk of
infection in humans can be very high while traveling
by public transportation, precautions such as
strengthening management personnel, personal
protection, environmental cleaning and disinfection,
health, and education need to be taken seriously. The
study by Ozbilen et al. (2021) also showed, on
average, the people who used public transportation,
ride-hailing, and car sharing were more at risk of
contracting Covid-19 than those that walked or used
cars. Therefore, building on the emerging positive
perception of non-motorized modes as an opportunity
to promote sustainable transportation and formulating
viable solutions to address the high-risk perceptions
related to public transportation use are recommended.
Furthermore, a study by Khaddar and Fatmi
(2021) showed that the involvement of daily
activities such as shopping, recreational activities,
household affairs, and socio-demographic attributes
had a significant effect on travel satisfaction during
the pandemic. Meanwhile, the results of this analysis
indicated that transportation modes like bicycles or
walking were used more often because they were
more satisfying in this era. A study conducted by
Anwari et al. (2021) in Bangladesh showed that the
majority of trips still use buses, especially to markets,
for recreation, and short distance trips, though the use
of this mode for village trips is decreasing.
However, this pandemic may last long because
transmission is still occurring and could impact
mobility (Moslem et al., 2020). Although not in all
areas, population mobility is dynamic because one
tends to have many choices, either travel or stay at
home. In Indonesia, with various regional
characteristics and uneven transportation systems in
all regions, mobility is a need because of economic
and social demands. Mogaji (2020) stated that
limiting the mobility of people in developing
countries will be very difficult due to economic
demands during the pandemic. Therefore, studying
the behavior of people's mobility during this time is
necessary.
A study was also conducted by the Research and
Development Agency of the Transportation Ministry
in collaboration with the Bandung Institute of
Technology concerning this issue. According to this
study, there was a significant decrease in the mobility
of people between and within cities in Indonesia
during the social restrictions (Frazila et al., 2020)
which impacted the changes in travel behavior. In
Jakarta, the congestion index has dropped
significantly since social restrictions, causing the city
to be excluded from the 2020 list of the top 10 most
congested cities in the world (Tomtom, 2021).
However, mobility will increases again as the new
normal begins (Frazila et al., 2020), though the
implementation of health protocols is still mandatory.
Within this framework, regulators need to take
strategic and anticipatory steps to realize safe and
comfortable transportation (Przybylowski et al.,
2021).
Furthermore, Ramos et al. (2020) analyzed
mobility to reveal that the style is determined by
socio-demographic aspects of the environment,
political orientation, vehicle ownership, and
transportation mode use. The choice of mobility style
will influence future policies of urban development
that ensure environmental sustainability. Similarly,
the household aspect plays an important role in
mobility in China, especially because of policies that
encourage people to bring the workplace closer to
home (Yao and Wang, 2018). According to Litman
(2003), mobility-based measurement can be
approached through the distance traveled by each
person, while accessibility is measured through the
ability of people to travel, including the costs,
available facilities, and infrastructure involved. Ali et
al. (2021), also stated that besides the mobility aspect,
considering the accessibility to achieving a
comfortable and safe journey is important in the
analysis of transportation planning.
The studies above have clearly explained the
effect of mobility on the Covid-19 spread and vice
versa. Public transportation is under tremendous
pressure due to various restrictions, and most studies
on mobility during the pandemic have focused on
urban areas. However, studies to understand the
behavior towards medium and long-distance travel,
Mobility for Long-distance: How People Choose Transportation in the Covid-19 Pandemic Era?
195

which also seems to be one of the causes of Covid-19
spread, are still rare.
Therefore, this study focuses on discussing the
behavior towards choosing a mode of transportation
for medium and long-distance trips in terms of
perceptions of the best and worst choices from some
alternatives. This means one mode is considered the
best, and some are regarded as the worst. The analysis
of options with this approach can provide additional
understanding of the mobility model in terms of the
choice of transportation mode during the pandemic.
2 METHOD
This study's purpose was to describe a model of
mobility behavior based on the choice of
transportation mode for medium and long-distance
travel via a road trip using a motorized vehicle. Inter-
regional mobility data within the Timor Island and the
Kupang origin area with the destination areas
comprising South Central Timor (SCT), North
Central Timor (NCT), Belu, and Malaka districts
were used. Travel to SCT was categorized as medium
distance, while to NCT, Belu, and Malaka were long
distance.
The data was obtained from a disaggregated
survey using a questionnaire distributed to
respondents, and the simple random sampling
technique was used to ensure the 250 people
evaluated were selected randomly.
Meanwhile, the questionnaire was related to the
use of these transportation modes on out-of-town trips
before and during the pandemic. They also concerned
the preferences for mode selection for out-of-town
travel for those who never went outside the city
during the pandemic. The questionnaire comprised
the following questions:
A. Before the Pandemic
1. Have you ever traveled outside Kupang City
before the pandemic?
2. Where was the longest trip outside Kupang before
the pandemic in the Timor region?
3. Please rate the following modes of transportation
between 1 – 9 to travel outside Kupang before the
pandemic, where 1 indicates 'rarely used' and 9 is
the 'most often used.'
B. During the Pandemic
1. Have you ever traveled outside Kupang during the
pandemic?
2. Where was the farthest trip outside Kupang during
the pandemic within the Timor region?
3. Please rate the following modes of transportation
to travel outside Kupang during the pandemic
between 1 – 9, where 1 indicates 'rarely used' and
9 is the 'most frequently used.'
4. For those who have never traveled outside
Kupang.
Rate the following modes of transportation
between 1 – 9 for traveling outside Kupang to SCT,
NCT, Belu, or Malacca, where 1 indicates 'rarely to
be used,' and 9 is the 'most likely to be used,' during
the pandemic to travel outside Kupang.
The choice of transportation assumed to be the
best and worst choice was the rarely used mode, using
a measurement scale 1 – 9, where 1 states the worst
choice and 9 represents the best. Based on the
research objectives, the method employed was the
best-worst method (BWM) developed by Rezaei
(2020) and is used for multi-criteria analysis, though
its use for transportation studies is still minimal.
Meski demikian, BWM telah digunakan untuk studi
dibidang logistik. However, BWM has been used in
studies related to logistics transportation. The method
can also be used to compare and consider various
conflicting criteria in order to determine criteria with
the most and the least significant influence (Moeslem
et al., 2020; Salimi & Rezaei, 2016). Rezaei, 2015
found that BWM had better performance than the
analytical hierarchy process (AHP) for multi-criteria
analysis. AHP analysis was based on the comparison
between criteria, while BWM went directly to the best
option and the worst one. Meanwhile, a study
conducted by Moslem et al. (2020) on inner-city
travel showed that it can adequately explain the
choice of mobility in the city, hence some parts of the
Moslem research method were used. However, the
focus was on medium and long-distance travel, and a
stated preference (SP) analysis was added to the
discussion. This study described the preferences of
people who have never traveled outside the city
during the pandemic.
The stages in data analysis are as follows (Rezaei,
2020):
1. Identify criteria (C) for selecting the type of
mobility.
2. Define the best and worst alternative options
using a scale of 1 – 9, where 1 indicates the 'least
important,' and 9 represents the 'most important.'
3. Evaluate pairwise comparisons for the most
important alternative (best)
𝐶
=(𝐶
,𝐶
,
…..,𝐶
)
4. Evaluate pairwise comparisons for the least
important alternative (worst)
5. Optimal weight analysis of the most important
criteria choice for mobility based on the mode
used.
𝐶
=(𝐶
,
𝐶
,…..𝐶
)
iCAST-ES 2021 - International Conference on Applied Science and Technology on Engineering Science
196
Absolute maximum difference:
𝑚𝑖𝑛𝑚𝑎𝑥
𝑊
𝑊
−𝐶
,
𝑊
𝑊
−𝐶
,
∑
𝑊
=1,𝑊
≥0
..
The principle of linear programming was used to
solve the problem above:
𝑚𝑖𝑛𝜉
∗
𝑠.𝑡
−𝐶
≤ 𝜉
∗
,
∑
𝑊
=1,𝑊
≥0
(2)
3 RESULT AND DISCUSSION
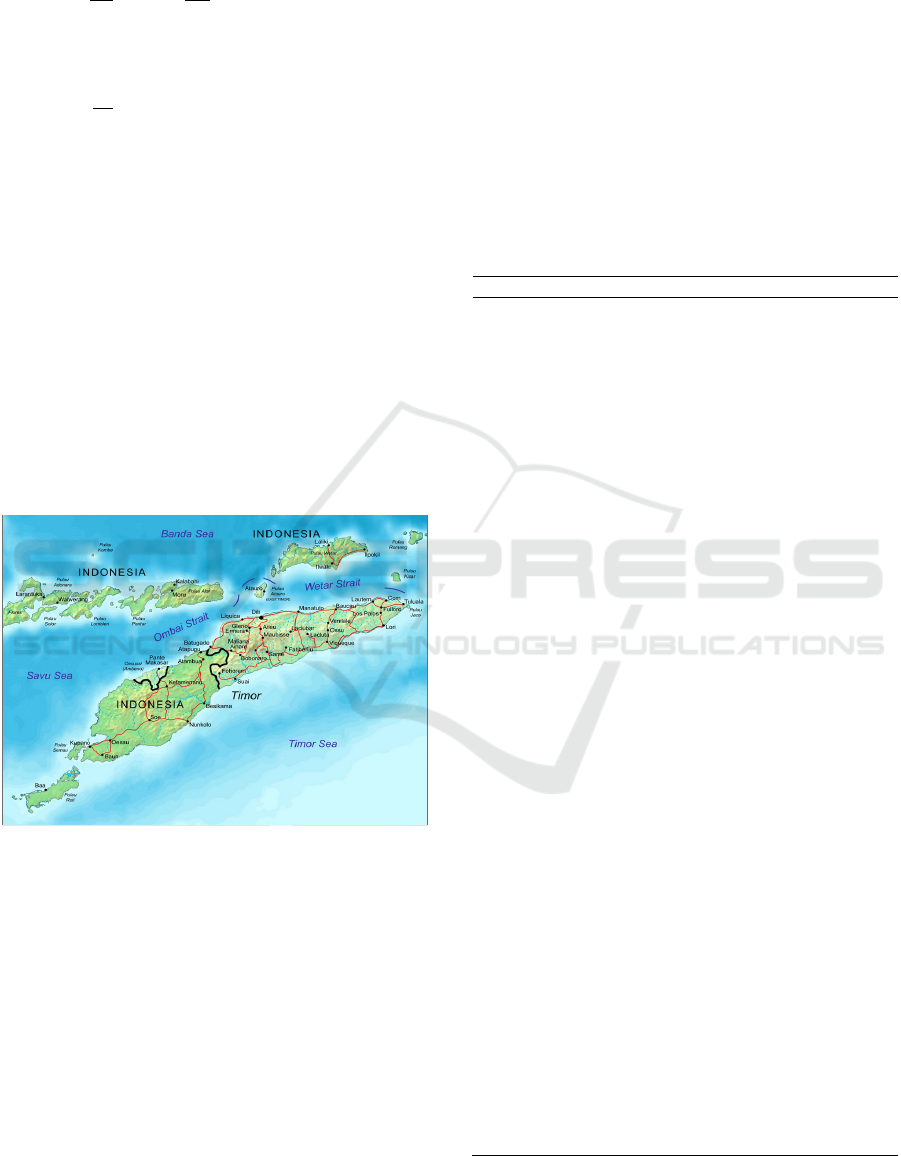
Geographically, the pattern of land travel from
Kupang to several district cities in the Timor territory
is through one main access called Trans Timor.
Figure 1 shows that the main intersection for access
to several district cities, namely Soe, Kefamenanu,
and Atambua, will be seen after passing through the
Kupang district and entering the SCT (Soe) area.
Besides being the provincial capital and the center of
trade and education, Kupang is also a transit city for
people who travel between islands or countries.
Therefore, it is a tourist attraction and a travel
generator.
Figure 1: Map of Timor Islands (Wikipedia, n.d.).
Transportation between regions within Timor
Island mostly uses road transportation for passengers
and logistics. Air transportation services are only
available on the Kupang – Atambua route. Several
public transportation modes that operate are intercity
buses, minibuses, and car sharing, with capacities of
22, 9, and 7 passengers, respectively. Most buses and
minibuses serve the Kupang to Soe, Kefamenanu,
Atambua, and Betun routes. Meanwhile, car sharing
mostly serves the Kupang to Soe and Malaka routes
and has grown rapidly after road access to several
district cities has increased significantly.
The survey data in Table 1 shows the majority of
the farthest travel destination for respondents before
the pandemic was Soe, and the nearest was
Kefamenanu. Generally, the number of respondents
who traveled the furthest to Malaka and Belu was not
much different from before the pandemic. The
distance to Soe, Kefamenanu, Atambua, Malaka is
approximately 110 Km, Kefamenanu 200 Km, 280
Km, and 255 Km, respectively. Meanwhile, the
reason respondents traveled out of town most often
was for family matters, while the least was tourism
and so on.
Table 1: Responden characteristics.
Res
p
ondent characteristics Pro
p
ortion
A
g
e
1. < 20 Yea
r
22%
2. 20
–
30 Yea
r
31%
3. 30 - 40 Yea
r
33%
4. 40 - 50 Yea
r
8%
5. > 50 Yea
r
5%
Profession
1. PNS/TNI/POLRI 22%
2. Entrepreneu
r
30%
3. Student 17%
4. Others
31%
Income
1. < IDR 1 million 45%
2. > IDR 1 million – IDR 2.5
million 11%
3. > IDR 2.5 million
–
5 million 23%
4. > IDR 5 million
–
7.5 million 17%
5. > IDR 7.5 million 4%
The furthest trip out of town before the pandemic
1. Soe 34%
2. Kefamenanu 8%
3. Atambua 30%
4. Malaka 28%
Reasons to travel before the pandemic
1. Wor
k
14%
2. Back to hometown 31%
3. Famil
y
Affairs 44%
4. Tou
r
6%
5. Others 5%
The furthest trip out of town during the pandemic
1. Soe 29%
2. Kefamenanu 11%
3. Atambua 22%
4. Malaka 17%
5. Never
y
et 21%
Reasons to travel during a pandemic
1. Wor
k
11%
2. Back to hometown 36%
3. Famil
y
Affairs 30%
4. Tou
r
2%
5. Others 21%
Mobility for Long-distance: How People Choose Transportation in the Covid-19 Pandemic Era?
197
However, there was a change in the percentage of
destination areas during the pandemic, as respondents
who traveled to Soe City were more dominant, though
the percentage was smaller than before Covid-19.
About 21% of the respondents did not travel outside
the city during the pandemic, while the reason for
travel was majorly for family matters and return to
hometown.
The respondent's choice of transportation mode
before and during the pandemic changed based on the
assessment of the available modes, namely buses,
cars, motorcycles, minibuses, and car sharing.
Respondents gave an assessment of 1 to state the most
frequently used and 9 to state the rarely used. Table 2
shows the analysis of their responses using a matrix
comparison where the best and worst modes were
compared to other transportation choices. From this
comparison, the consistency of the respondents'
answers < 0.1 was considered eligible.
The following is an example of analysis for one
respondent.
In the analysis example, the best choice was a bus,
and the worst was a motorcycle. The results in Table
2, which are the output of the analysis based on the
algorithm developed by Rezazai, showed that the
consistency value (Ksi) was 0.07 < 0.1, meaning the
respondent's answer met the requirements.
Table 2: Pairwise Comparisons between the Modes of Transportation.
Criteria Number = 5 Criterion 1 Criterion 2 Criterion 3 Criterion 4 Criterion 5
Names of Criteria Bus Ca
r
Motorc
y
cle Minibus Car Sharin
g
Select the Best Bus
Select the Worst Motorcycle
Best to Others Bus Ca
r
Motorcycle Minibus Car Sharing
Bus 1 5 8 5 2
Worst to Others Motorc
y
cle
Bus 8
Ca
r
2
Motorcycle 1
Minibus 2
Car Sharin
g
7
Weights
Bus Ca
r
Motorc
y
cle Minibus Car Sharin
g
0.46568627
0.1078431
4 0.0490196 0.1078431 0.2696078
Ksi* 0.07352941
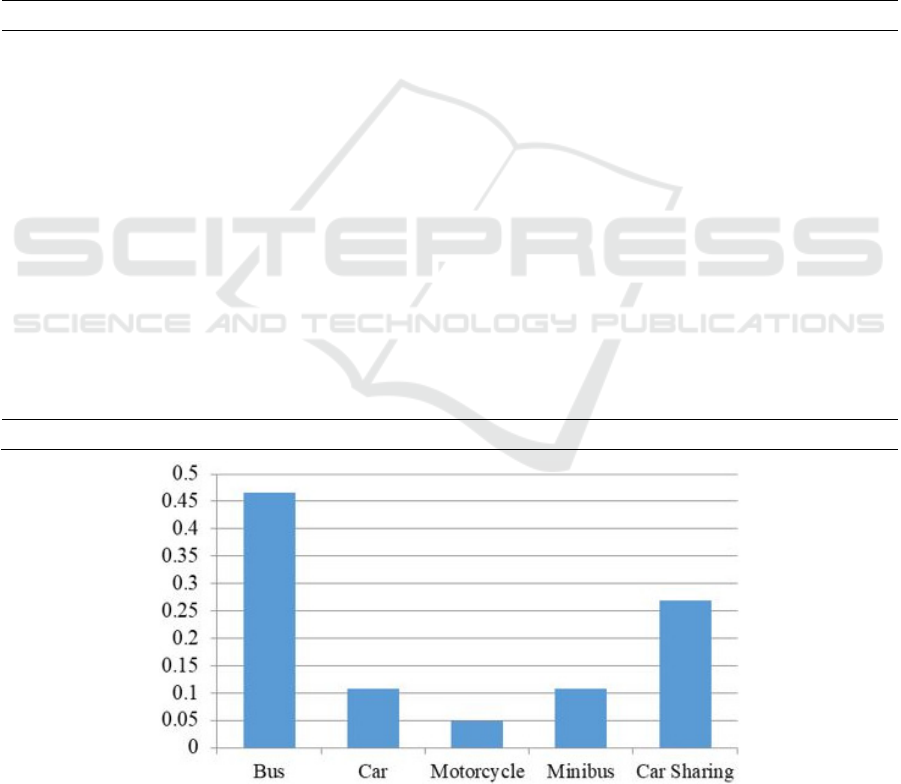
Figure 2: Average Weight of the Mode of Transportation used before the Pandemic from one respondent.
iCAST-ES 2021 - International Conference on Applied Science and Technology on Engineering Science
198
Consequently, the weighted output in Table 2
shows the ranking level of each transportation mode.
Figure 2 shows that the 1st rank was the mode of
transportation with the largest weights, while the 5th
rank had the smallest, meaning buses are the main
choice and motorbikes are the most frequently used
option.
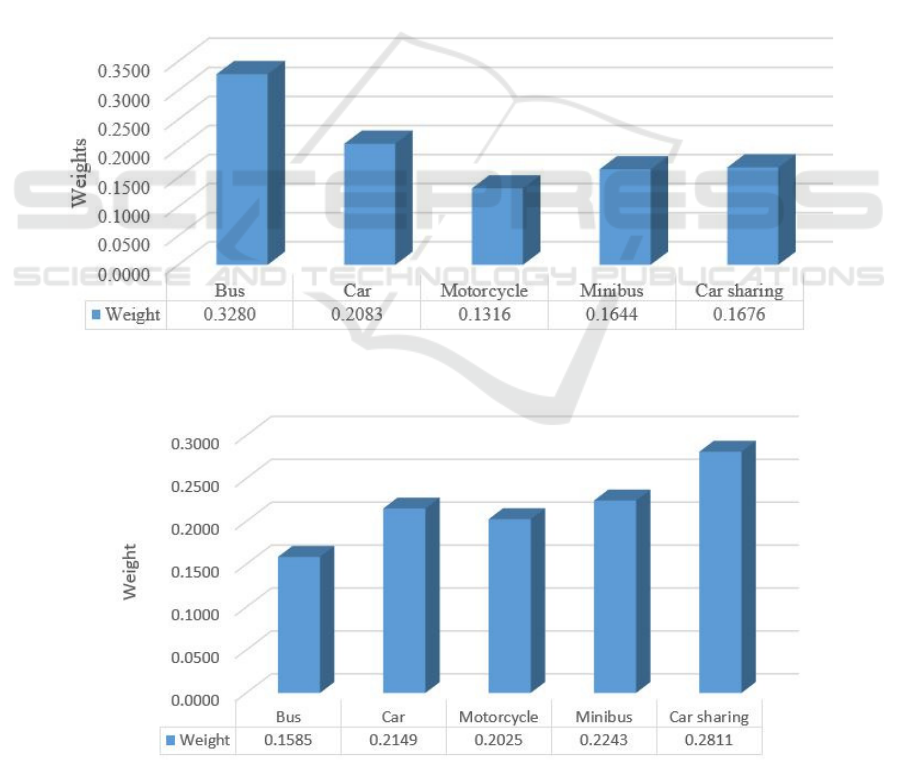
All the respondents' answers before and after the
pandemic were analyzed, including the mode
selection preferences for those who will travel out of
town during the pandemic. After the analysis, the next
step was to determine the total weight, which was the
average of the overall value for each mode of
transportation. Figure 3 shows the bus weights were
more, making them the best choice or the top rank,
while the motorbikes were the least, thereby
becoming the worst choice or lowest ranking.
Conversely, cars were placed 2nd place, while
minibuses and car sharing were balanced in weight.
During the pandemic, the mode of transportaion
for mobility outside Kupang city to several areas in
Timor showed a change. Figure 4 illustrates the
change during the pandemic, where buses were no
longer a priority choice. Car sharing was the best
choice for traveling outside this city, followed by
minibus, while the car weights were slightly above
the motorbike, and the lowest was the bus.
Finally, an analysis of the mobility choices of the
respondents who had never been out of town during
the pandemic was conducted. Figure 5 shows the best
choice to travel outside the city is car sharing,
followed by the car, minibus, and motorbike, while
the last option is the bus.
This study found that there was a change in
choosing transportation modes before and during the
pandemic. Although the high use of buses before the
pandemic could be due to the affordable fares and
adequate availability, the users and operators tended
Figure 3: Average Final Weight of the Mode of Transportation used before the Pandemic.
Figure 4: Average Final Weight of Transportation Modes used during the Pandemic.
Mobility for Long-distance: How People Choose Transportation in the Covid-19 Pandemic Era?
199
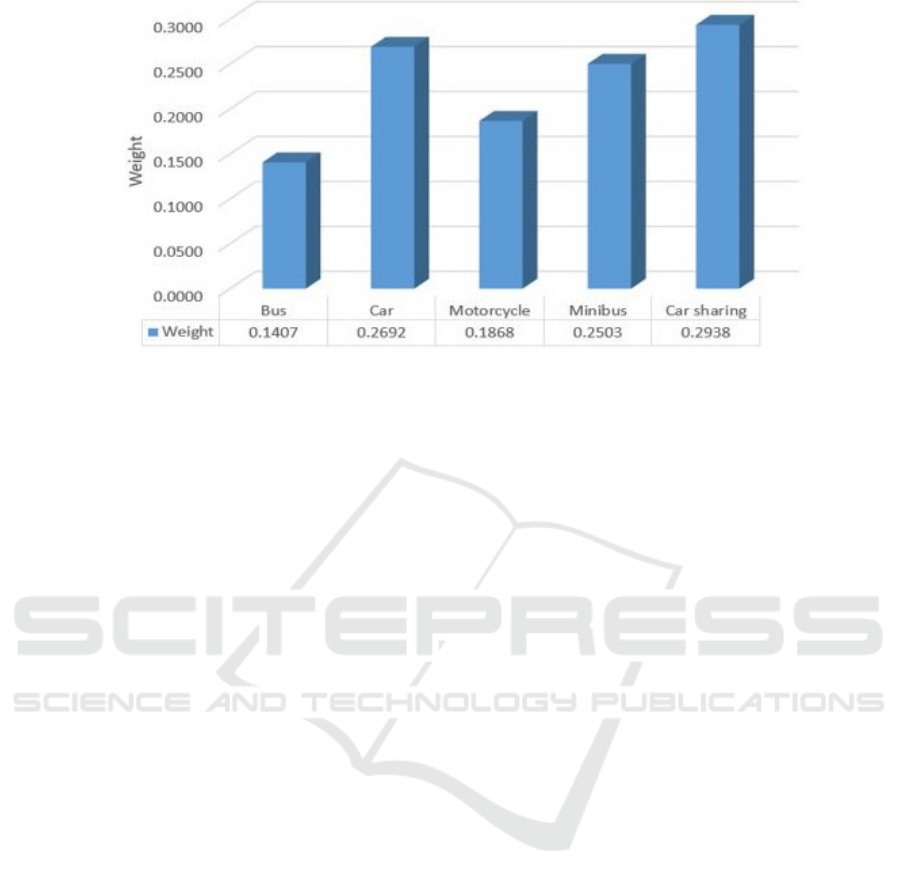
Figure 5: Average Final Weight of the Transportation Modes used when Traveling Out of Town during the Pandemic.
to ignore or neglect the demands for health care
standards. According to the study by Moslem et al.
(2020) involving short distances, many people
switched to walking and using cars during the
pandemic even though car use before Covid-19 was
quite high. In another study, (Burgdorf, Mönch, &
Beige, 2020) found that most long-distance trips were
on the road using buses, then trains, and rarely planes.
According to the results, the use of car sharing
during the pandemic was higher than buses. Likewise,
the mode most often used was car sharing for those
who had never been out of town. Car sharing is a
relatively new transportation service for long-
distance travel in Timor, whose use is growing due to
poor bus services, such as lateness and longer trips
due to frequent stops. It is also a solution to overcome
the use of private vehicles, according to Hui et al.
(2019). Ferrero et al. (2018) stated that the main
principle of car sharing was using private vehicles
together with other persons going to the same
destination, associated with door-to-door service.
This method provides convenience for users.
However, Chapman et al. (2020) found that this
service on inner-city trips is attractive to those who
have cars, though they cannot be sure that the
transportation mode can reduce car use.
Meanwhile, the problem faced was that the
inability to properly control the growth of car sharing
creates unfair competition between its existence and
bus operations at the local level. The first obstacle is
that the absence of clear local regulations regarding
car sharing operations. Second, there is no travel
insurance guarantee that can cope with accidents
because the vehicle-operating license is for personal
use, not public transportation. Therefore, the first step
is to make clear car sharing regulations concerning
ownership, operations, and routes to ensure healthy
competition with other public transportation modes.
The application of these regulations can be similar to
the minibus, which has a capacity of 9 passengers.
Furthermore, an equally important factor is the
need for efforts to improve intercity bus services,
especially regulating passenger capacity, cleanliness,
and adherence to health protocols.
4 CONCLUSIONS
This study produced an overview of the mode choice
behavior before and after the pandemic, and the
results showed a change in the pattern of mobility
concerning the choice of transportation mode. This
finding shows the vulnerability of long-distance
travellers to the spread of Covid-19 virus. These
travellers are recommended to choose transportation
modes with the lowest risk of transmission. Car
sharing is more often used to travel long distances
within the Timor region, while minibuses, with a 9-
passenger capacity, were in second place. Although
car sharing and minibuses are still categorized as
public transportation, they are not for mass
transportation. These results indicate that buses were
used the least for inter-city travel during the
pandemic, and this finding necessitates the attention
of policymakers to improve the performance and use
of bus services. Furthermore, passenger capacity can
be concluded to be a factor that can influence the
choice of public transportation modes for mobility.
Therefore, passenger capacity and its
relationship to public transportation use during the
pandemic, including the improvement of intercity bus
services, can be studied in the future.
iCAST-ES 2021 - International Conference on Applied Science and Technology on Engineering Science
200

ACKNOWLEDGEMENTS
The authors express gratitude to the State Polytechnic
of Kupang for the funding provided to complete this
research.
REFERENCES
Ali, N., Abdullah, M., & Javid, M. A. (2021). Accessibility-
based approach: Shaping travel needs in pandemic
situation for planners’ perspectives. Engineering
Journal, 25(1), 15–22. https://doi.org/10.4186/ej.2021.
25.1.15
Anwari, N., Tawkir Ahmed, M., Rakibul Islam, M.,
Hadiuzzaman, M., & Amin, S. (2021). Exploring the
travel behavior changes caused by the COVID-19
crisis: A case study for a developing country.
Transportation Research Interdisciplinary
Perspectives, 9 (November 2020). https://doi.org/10.10
16/j.trip.2021.100334
Burgdorf, C., Mönch, A., & Beige, S. (2020). Mode choice
and spatial distribution in long-distance passenger
transport – Does mobile network data deliver similar
results to other transportation models? Transportation
Research Interdisciplinary Perspectives, 8(September),
1–15. https://doi.org/10.1016/j.trip.2020.100254
Chang, S., Pierson, E., Koh, P. W., Gerardin, J., Redbird,
B., Grusky, D., & Leskovec, J. (2021). Mobility
network models of COVID-19 explain inequities and
inform reopening. Nature, 589(7840), 82–87.
https://doi.org/10.1038/s41586-020-2923-3
Chapman, D. A., Eyckmans, J., & Van Acker, K. (2020).
Does car-sharing reduce car-use? An impact evaluation
of car-sharing in flanders, Belgium. Sustainability
(Switzerland), 12(19), 1–27. https://doi.org/10.3390/
su12198155
Chen, H., He, J., Song, W., Wang, L., Wang, J., & Chen, Y.
(2020). Modeling and interpreting the COVID-19
intervention strategy of China: A human mobility view.
PLoS ONE, 15(11 November), 1–11.
https://doi.org/10.1371/journal.pone.0242761
Ferrero, F., Perboli, G., Rosano, M., & Vesco, A. (2018).
Car-sharing services: An annotated review. Sustainable
Cities and Society, 37(October), 501–518.
https://doi.org/10.1016/j.scs.2017.09.020
Frazila, Russ bona; Sjafruddin, Ade; Santoso, Idwan;
Zukhruf, Febri; Suryo, Taufiq; Maulana, Andrean;
Ziaulhaq, Agung; Farda, M. (2020). Kajian Pemodelan
Pergerakan Orang di Bidang Transportasi Jalan
Selama Covid-19. (September).
Hui, Y., Wang, Y., Sun, Q., & Tang, L. (2019). The Impact
of Car-Sharing on the Willingness to Postpone a Car
Purchase: A Case Study in Hangzhou, China. Journal
of Advanced Transportation, 2019.
https://doi.org/10.1155/2019/9348496
Iacus, S. M., Santamaria, C., Sermi, F., Spyratos, S., Tarchi,
D., & Vespe, M. (2020). Human mobility and COVID-
19 initial dynamics. Nonlinear Dynamics, 101(3), 1901–
1919. https://doi.org/10.1007/s11071-020-05854-6
Khaddar, S., & Fatmi, M. R. (2021). COVID-19: Are you
satisfied with traveling during the pandemic?
Transportation Research Interdisciplinary
Perspectives, 9 (December 2020), 1–7.
https://doi.org/10.1016/j.trip.2020.100292
Labonté-Lemoyne, É., Chen, S. L., Coursaris, C. K.,
Sénécal, S., & Léger, P. M. (2020). The unintended
consequences of covid-19 mitigation measures on mass
transit and car use. Sustainability (Switzerland), 12(23),
1–13. https://doi.org/10.3390/su12239892
Litman, T. (2003). Measuring transportation: Traffic,
mobility and accessibility. ITE Journal (Institute of
Transportation Engineers), 73(10), 28–32.
Merler, S., & Ajelli, M. (2010). Human mobility and
population heterogeneity in the spread of an epidemic.
Procedia Computer Science, 1(1), 2237–2244.
https://doi.org/10.1016/j.procs.2010.04.250
Mogaji, E. (2020). Impact of COVID-19 on transportation
in Lagos, Nigeria. Transportation Research
Interdisciplinary Perspectives, 6, 1–7.
https://doi.org/10.1016/j.trip.2020.100154
Moslem, S., Campisi, T., Szmelter-Jarosz, A., Duleba, S.,
Nahiduzzaman, K. M., & Tesoriere, G. (2020). Best-
worst method for modelling mobility choice after
COVID-19: Evidence from Italy. Sustainability
(Switzerland), 12(17), 1–19. https://doi.org/10.3390/
SU12176824
Ozbilen, B., Slagle, K. M., & Akar, G. (2021). Perceived
risk of infection while traveling during the COVID-19
pandemic: Insights from Columbus, OH.
Transportation Research Interdisciplinary
Perspectives, 10 (December 2020), 100326.
https://doi.org/10.1016/j.trip.2021.100326
Przybylowski, A., Stelmak, S., & Suchanek, M. (2021).
Mobility behaviour in view of the impact of the
COVID-19 pandemic-public transport users in gdansk
case study. Sustainability (Switzerland), 13(1), 1–12.
https://doi.org/10.3390/su13010364
Ramos, É. M. S., Bergstad, C. J., Chicco, A., & Diana, M.
(2020). Mobility styles and car sharing use in Europe:
attitudes, behaviours, motives and sustainability.
European Transport Research Review, 12(1).
https://doi.org/10.1186/s12544-020-0402-4
Rezaei, J. (2015). Best-worst multi-criteria decision-
making method. Omega (United Kingdom), 53, 49–57.
https://doi.org/10.1016/j.omega.2014.11.009
Rezaei, J. (2020). A Concentration Ratio for Nonlinear Best
Worst Method. International Journal of Information
Technology and Decision Making, 19(3), 891–907.
https://doi.org/10.1142/S0219622020500170
Salimi, N., & Rezaei, J. (2016). Measuring efficiency of
university-industry Ph.D. projects using best worst
method. Scientometrics, 109(3), 1911–1938.
https://doi.org/10.1007/s11192-016-2121-0
Shen, J., Duan, H., Zhang, B., Wang, J., Ji, J. S., Wang, J.,
… Shi, X. (2020). Prevention and control of COVID-
19 in public transportation: Experience from China.
Mobility for Long-distance: How People Choose Transportation in the Covid-19 Pandemic Era?
201

Environmental Pollution, 266. https://doi.org/10.1016/
j.envpol.2020.115291
Tirachini, A., & Cats, O. (2020). COVID-19 and public
transportation: Current assessment, prospects, and
research needs. Journal of Public Transportation,
22(1), 1–34. https://doi.org/10.5038/2375-0901.22.1.1
Tomtom. (2021). Jakarta Traffic. Retrieved March 15,
2021, from https://www.tomtom.com/en_gb/traffic-
index/jakarta-traffic
Truong, D., & Truong, M. D. (2021). Projecting daily travel
behavior by distance during the pandemic and the
spread of COVID-19 infections – Are we in a closed
loop scenario? Transportation Research
Interdisciplinary Perspectives, 9(2021), 1–14.
https://doi.org/10.1016/j.trip.2020.100283
Wikipedia. (n.d.). Geography of East Timor. Retrieved
from https://en.wikipedia.org/wiki/Geography_of_
East_Timor
Yao, M., & Wang, D. (2018). Mobility and travel behavior
in urban China: The role of institutional factors.
Transport Policy, 69(May), 122–131.
https://doi.org/10.1016/j.tranpol.2018.05.012
Zhou, Y., Xu, R., Hu, D., Yue, Y., Li, Q., & Xia, J. (2020).
Effects of human mobility restrictions on the spread of
COVID-19 in Shenzhen, China: a modelling study
using mobile phone data. The Lancet Digital Health,
2(8), e417–e424. https://doi.org/10.1016/S2589-
7500(20)30165-5
iCAST-ES 2021 - International Conference on Applied Science and Technology on Engineering Science
202
