
Impact of the Covid-19 Pandemic on Traffic Performance on Urban
Roads in Kupang City, Indonesia
Amy Wadu, Mateus R. Sodanango and Zulfiani Ar
Department of Civil Engineering, Kupang State Polytechnic, Adi Sucipto Street, Kupang, Indonesia
Keywords: Covid-19, Pandemic, Traffic, Volume, V/C Ratio.
Abstract: The relationship between transportation and people can also be seen when transportation is affected by
major changes in society, such as the COVID-19 pandemic. The City of Kupang until this research was
carried out by the Government of the City of Kupang had extended the Implementation of Community
Activity Restrictions (PPKM) up to 4 times. Therefore measuring traffic performance is very important for
government agencies managing traffic and individuals planning trips, especially when special events occur.
The aim of this study was to measure the impact of COVID-19 on transportation to better guide institutions
and communities to respond appropriately to changing traffic patterns. This research was conducted with
basic principles based on the Indonesian Road Capacity Guidelines (PKJI2014) published by the Ministry of
PUPR. The results showed that due to this pandemic, the Cak Doko road segment was the road that
experienced the biggest change in the v/c ratio, namely from 2019 to 2021 the v/c ratio was 0.69, 0.29, and
0, respectively. 33. As for the other three roads, there were no significant changes due to the COVID-19
pandemic.
1 INTRODUCTION
Transportation plays a very important role in the
development of civilization by meeting the needs of
people's travel and transportation needs of goods. In
both developed and developing countries, most
people travel daily for work, shopping, and various
social activities (Hurwitz et al, 2015). Especially in
Indonesia, transportation is facilitated by several
modes, such as air, rail, highway, and waterways.
Most passenger trips are made by car for shorter
distances which means using the road. in traffic
engineering, it is known that given the travel
demand curve, the cheaper the travel costs, the
higher the demand. This effect implies that the
induced traffic does not depend on the capacity itself
but on the resulting reduction in travel time or cost
(Goodwin and Noland, 2003). As a result, the higher
the traffic demand, the higher the road congestion
and greenhouse gas emissions (Boriboonsomsin and
Barth, 2008), and it has also been shown that traffic
congestion impacts the economy by slowing down
economic growth (Sweet, 2014).
The link between transportation and people can
also be seen when transportation is affected by
major changes in society, such as the COVID-19
pandemic. In Indonesia itself, the first positive case
was reported on March 12, 2020, which then
continued with the discovery of cases in other
provinces. The City of Kupang itself found its first
case on April 9, 2020, and until the time this
proposal was written the Kupang City Government
had extended the Enforcement of Community
Activity Restrictions (PPKM) up to 4 times.
Therefore measuring traffic performance is very
important for government agencies managing traffic
and individuals planning trips, especially when
special events occur. The COVID-19 pandemic has
significantly affected almost every aspect of daily
life, including urban traffic patterns. Therefore, it is
important to measure the impact of COVID-19 on
transportation to better guide institutions and
communities to respond appropriately to changing
traffic patterns (Cui et al, 2020).
In a study in Greece it was proven that the
reduced traffic volume due to social restrictions by
the government, caused a slight increase in vehicle
speed by 6-11% from before the pandemic
(Katrakazas et al, 2020). In a study conducted by
Jenelius & Cebecauer (Jenelius and Cebecauer,
2020) they analyzed the impact of COVID-19 on
daily public transport passengers in the three most
Wadu, A., Sodanango, M. and Ar, Z.
Impact of the Covid-19 Pandemic on Traffic Performance on Urban Roads in Kupang City, Indonesia.
DOI: 10.5220/0010941600003260
In Proceedings of the 4th International Conference on Applied Science and Technology on Engineering Science (iCAST-ES 2021), pages 161-166
ISBN: 978-989-758-615-6; ISSN: 2975-8246
Copyright
c
2023 by SCITEPRESS – Science and Technology Publications, Lda. Under CC license (CC BY-NC-ND 4.0)
161

populous regions of Sweden (Stockholm, Västra
Götaland and Skåne) during spring 2020, the decline
in public transport public transport (40% -60 % for
cross-regional transportation).
In a study conducted by Du (Du et al, 2021) that
reducing traffic demand is a very effective method to
reduce traffic congestion and air pollution. A 15%
reduction in traffic demand for a congested network
can result in a 60% reduction in delays.
Based on the above explanation about the current
condition of Kupang City and studies that have been
conducted in various places, the main purpose of this
study is to show the impact of PPKM in Kupang
City regarding COVID-19 on traffic volume in
relation to traffic performance in Kupang City. . The
results of this study will be useful for operational
and strategic planning of recovery efforts and for
dealing with future pandemics. Changes were
explored for 5 main road sections in Kupang City,
that i.e Timor Raya street, Soeharto street, Street
Sudirman, and Street Tom Pello.
2 TRAFFIC DURING COVID-19
PANDEMIC
As soon as the WHO gave COVID-19 a pandemic
status, countries around the world began to prepare
for closures of various types in the near future,
which translated into changes in daily travel
patterns, namely changes in the use of public
transport systems, but also resulted in a decrease in
volume. total traffic. Although a national disaster
emergency in Indonesia was declared on April 13,
2020 by the President, emergencies and stay-at-
home measures are implemented differently in
different provinces. However, in general, after a
gradual reduction in activity, the country began to
report a decrease in traffic volumes in mid-March.
The impact of this decline is very large for
commercial and recreational activities.
In a study in Greece it was proven that the
reduced traffic volume due to social restrictions by
the government, caused a slight increase in vehicle
speed by 6-11% from before the pandemic. During
March and April 2020, which are the months where
the spread of COVID-19 is at its peak. On the bright
side, accidents in Greece were reduced by 41%
during the first month of action triggered by
COVID-19 and driving in the morning (00:00-
05:00) the accident risk rate dropped to 81%. They
recommended that the government concentrate on
setting new speed limits and ensuring greater space
for cycling and pedestrians in order to increase the
distance between users to maintain a better level of
road safety and prevent the spread of COVID-19
(Katrakazas et al, 2020).
In research in the United States, in general there
is a 30% –50% decrease in traffic volume in mid-
April; then, in early May, traffic volumes started to
increase, and in late July and mid-August, traffic
volumes still remained about 10% below the
normally observed values (Goenaga et al, 2021).
3 RESEARCH METHODS
The research stages start from literature study, data
collection, data analysis, to the results in the form of
conclusions and recommendations for handling.
Beginning with a literature study, the main roads to
be investigated were identified as Timor Raya street,
Frans Seda Street, Piet A. Tallo Street and Tom
Pello street. This stage is carried out to find out the
traffic volume in 2021, namely during the
implementation of community activity restrictions
(PPKM) implemented by the Kupang City
government. At this stage, concentration points for
the study area were also carried out, which in 2019
and 2020 a traffic survey was conducted in order to
obtain accurate comparative data. With the scope of
the problems to be discussed. The analysis stage is a
follow-up after data processing is completed. The
purpose of this stage is to understand and analyze
the processing results in depth. The analysis was
carried out by comparing traffic conditions before
the COVID-19 pandemic and during the COVID-19
pandemic, namely with the PPKM policy by the
Kupang City government, with traffic considerations
based on the 2014 Indonesian Road Capacity Guide
(PKJI) (Gautama et al, 2021). Recommendations for
traffic operations during the pandemic and during
recovery from the pandemic to anticipate the
possibilities that will occur in depth in the future in
the event of a pandemic like this.
3.1 Road Geometric
Geometry is the shape and size of the road above the
ground surface both vertically and horizontally with
the assumption that the body / shape of the earth's
surface is uneven. The goal is to create a good
relationship between time and space according to the
needs of the vehicle concerned, to produce road
sections that meet the requirements of comfort,
safety, and optimal efficiency values. In building
highways, geometric roads are influenced by
iCAST-ES 2021 - International Conference on Applied Science and Technology on Engineering Science
162

topography, social, economic and community.
The collection of geometric road data in this study
using the manual method was carried out directly at
the survey location by measuring road width,
sidewalk width, and parking layout, as well as other
data about roads related to this study using a meter.
3.2 Traffic
Traffic is a system consisting of components. The
first major component or a head way system (time
between two successive vehicles when passing a
point on a road) includes all types of infrastructure
and facilities of all types of transportation available.
3.2.1 Traffic Flow
Traffic flow is formed from the movement of
individual drivers who interact with one another on a
road segment and their environment. Traffic flow on
a road segment characteristics will vary both based
on time.
The survey conducted in this study was a
classified volume survey using the manual traffic
counts method in accordance with Pd.T-19-2004-B
concerning the manual traffic count survey, on 5
main roads in Kupang City, namely Street Timor
Raya, Street Suharto, Street Sudirman, and Street
Tom Pello. The survey was carried out by placing
the surveyor at a fixed point on the side of the road,
so that he could clearly observe passing vehicles at
the specified point. Data recording is filled in on the
survey form according to the vehicle classification
that has been determined. The implementation
period starts from 06.00 to 20.00 for 7 days.
3.2.2 Side Friction
Side friction are expressed as interactions between
traffic flow and roadside activities which can be in
the form of pedestrians, public transport and other
vehicles that stop, vehicles that run slowly, and
vehicles entering and leaving the land beside the road.
The side friction survey was conducted with the aim
of obtaining activities on the side of the road and
obstacles that are useful for calculating the capacity
of the road segment. This service was conducted on
a 200 meter/hour road segment according to the
2014 Indonesian Road Capacity Guidelines (PKJI).
The survey was conducted by 10 surveyors in 2
survey sessions (Session 1 at 06:00 to 14:00; Session
2 at 14: 00-20:00), in which each surveyor surveys
the number of pedestrians (pedestrians), stopped
vehicles, vehicles entering and leaving the side of
the road, and slow vehicles on each road segment.
3.3 Level of Service
Road service level analysis was conducted based on
the PKJI 2014 Indonesian road capacity guidelines.
The level of road service to passing traffic is usually
measured by the v/c ratio or commonly referred to as
the degree of saturation. The degree of saturation
(Ds) is the ratio between the traffic volume (V) and
the road capacity (C), the magnitude of which is
theoretically between 0 - 1, which means that if the
value is close to 1 then the road condition is close to
saturation.
Ds =
Q
C
Where
Ds = Degree of Saturation
Q = Traffic flow (pcu/hour)
C = Capacity (pcu/hour)
4 RESULTS AND DISCUSSION
4.1 Traffic Composition
Based on the average daily traffic data in semester 1
of 2021 in Figure 1, it shows that the types of light
vehicles on the Frans Seda road section are the
highest, namely with 13207 vehicles/day for
direction 1 and 13862 vehicles/day for direction 2.
weight is the type of vehicle that passes at least the
four roads. As for the type of motorcycle vehicle, it
only dominates on the Timor highway with a total of
8159 vehicles/day for direction 1 and 6838
vehicles/day for direction 2. previously in the city of
Kupang motorcycles dominated (Wadu et al, 2020);
(Wadu et al, 2019) changed to the dominance of
light vehicles.
To see more details, see the percentage of types
of vehicles that cross the 4 main roads in Kupang
City in Figure 2. The percentage of motorcycles on
the Piet A. Tallo, Timor Raya, Cak Doko, and Frans
Seda roads, respectively, is 40.90%, 48.40%,
30.41%, 36.58%. This clearly shows that during the
pandemic the level of motorcycle use was not as
dominant as it was before the pandemic. There has
been a shift in the pattern of using motorized
vehicles by Kupang city residents. Based on the data
on the percentage of light vehicles in Figure 2 on the
Piet A. Tallo, Timor Raya, Cak Doko, and Frans
Seda roads, respectively, they are 55.56%, 42.36%,
66.22%, 59.94%. From the four roads, it can be seen
that light vehicles are only less dominant on the
Impact of the Covid-19 Pandemic on Traffic Performance on Urban Roads in Kupang City, Indonesia
163
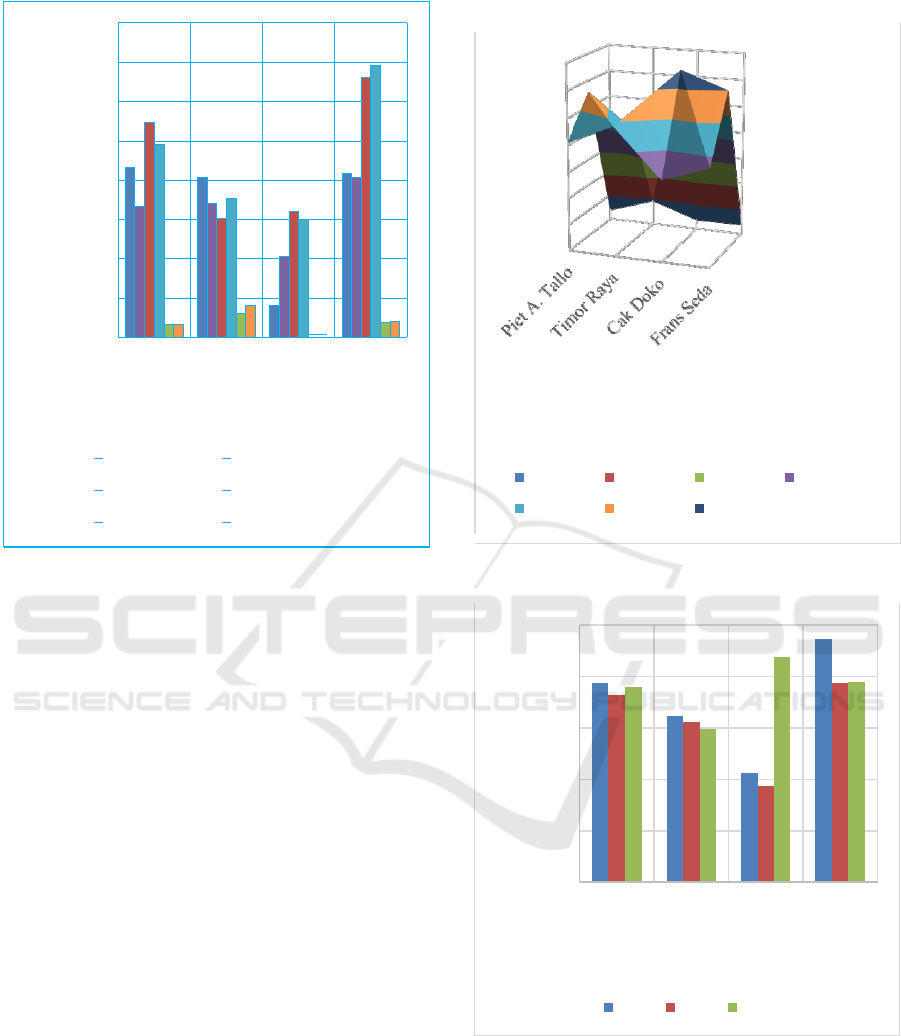
Figure 1: Average Annual Daily Traffic 2021.
Timor Raya road, with a percentage of 42.36%,
while on the other three roads there are more types
of light vehicles, even on the Cak Doko road, the
dominance of light vehicles reaches 66.22%.
4.2 Traffic Volume Comparison Last 3
Years
Data on positive confirmation of COVID-19
in Kupang City obtained from
www.covid19.nttprov.go.id starting from the first
case found on April 9, 2020, then a spike began in
November 2020 with data as of November 1, 2020,
there were 154 cases. positive confirmed case of
covid-19. Even the number of confirmed cases rose
sharply in January. Based on data as of January 1,
2021, there were 993 confirmed cases of COVID-19.
The latest data obtained when this research was
conducted the number of positive confirmed cases in
Kupang City as of June 1, 2021 had reached 6937
cases. With the continued increase in the number of
positive confirmed cases of COVID-19 in Kupang
City, the Kupang city government itself has enforced
the implementation of community activity
restrictions (PPKM) since January 2021 and is still
ongoing until the time this research was conducted.
Figure 2: Percentages of Light Vehicle.
Figure 3: Traffic Flow on Peak Hour In The Last 3 Years.
Based on the traffic volume data in Figure 3, it
can be seen that the implementation of PPKM in
Kupang City does not have a large effect on peak
hour traffic volume in Kupang City. The impact can
only be seen on the Cak Doko road section which is
in the Educational environment, there are several
high school, junior high, and vocational schools
2500
2000
1500
1000
500
0
Piet A.
Tallo
Timor Cak Doko Frans
Raya
Street Names
Seda
2021 2020 2019
70%
60%
50%
40%
30%
20%
10%
0%
Percentage of HV
Percentage of MC
Stree
t
N
ames
0%-10% 10%-20% 20%-30% 30%-40%
40%-50% 50%-60% 60%-70%
16000
14000
12000
10000
8000
6000
4000
2000
0
Piet A. Timor Cak Frans
Tallo Raya Doko Seda
Street Names
MC direction 1 MC direction 2
LV direction 1 LV direction 2
HV direction 1 HV drection 2
Ann
ual
Av
e
r
age
Da
il
y
T
r
a
ff
ic
(
pc
u)
T
r
a
ff
i
o F
l
ow (
pcu/h
our)
iCAST-ES 2021 - International Conference on Applied Science and Technology on Engineering Science
164
where in 2019 before the covid-19 pandemic the
traffic flow reached 2189 units of light vehicles per
hour while in semester 1 of 2021 it occurred
decrease in peak hour traffic volume which only
reached 1057 units of light vehicles per hour. This
shows that the impact of online school from home
implemented by the government has a major impact
on traffic flow.
Meanwhile, on the other 3 roads, namely Piet A.
Tallo, Timor Raya, and Frans Seda roads, there was
no decrease in traffic volume during peak hours.
Even on the Frans Seda road, the traffic flow in
semester 1 of 2021 reached 2368 units of light
vehicles per hour, this is an increase when compared
to traffic flow in 2019 which only reached 1945
units of light vehicles per hour.
Based on the average daily traffic data in
semester 1 of 2021 in Figure 1, it shows that the
types of light vehicles on the Frans Seda road
section are the highest, namely with 13207
vehicles/day for direction 1 and 13862 vehicles/day
for direction 2. weight is the type of vehicle that
passes at least the four roads. As for the type of
motorcycle vehicle, it only dominates on the Timor
highway with a total of 8159 vehicles/day for
direction 1 and 6838 vehicles/day for direction 2.
previously in the city of Kupang motorcycles
dominated (Wadu et al, 2020); (Wadu et al, 2019)
changed to the dominance of light vehicles.
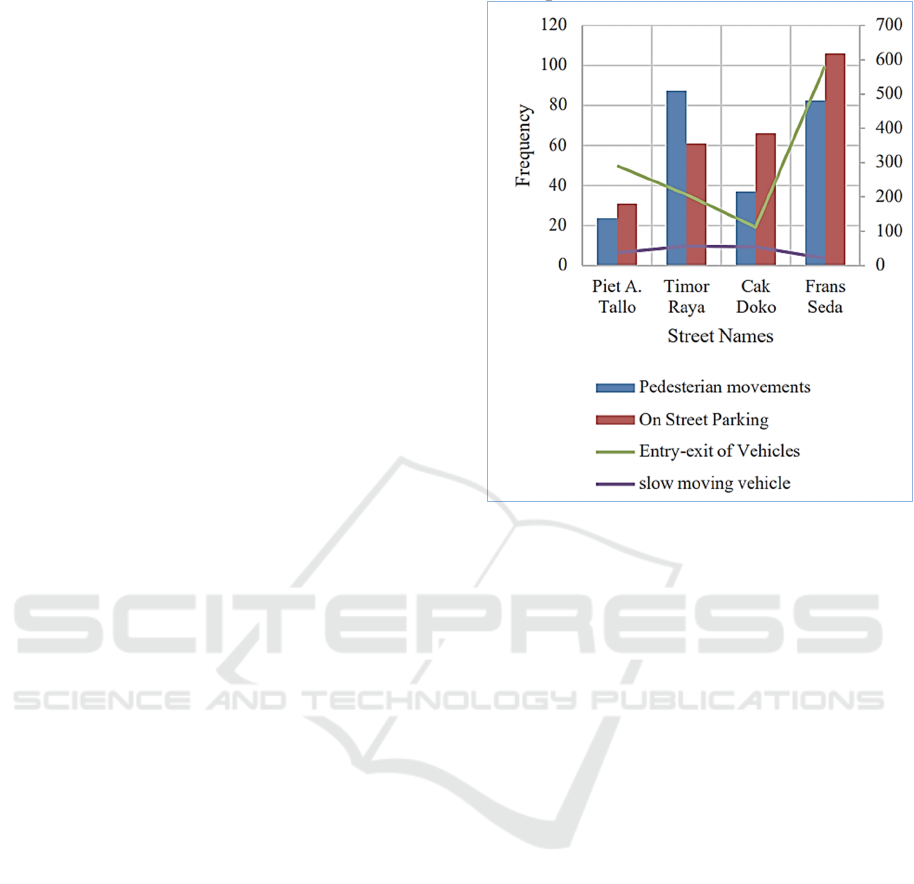
4.3 Roadside Activities
Based on the data shown in Figure 4, pedestrian
activities and on-street parking are the most
dominant activities occurring on 4 main roads in
Kupang City. Parking activity on the Frans Seda
road is the highest when compared to other roads,
with 106 frequency of occurrences per hour per 200
m. This happens because on the Frans Seda road
there is a Kartini hospital. Hospitals are the busiest
health centers during this pandemic. Meanwhile, the
highest pedestrian activity occurs on the East Timor
highway with the number of occurrences per hour
per 200 m reaching 88.
As for the side barriers that occur due to traffic
movements, Figure 4 shows that the incidence of
entering and leaving vehicles on the Frans Seda road
section is the most frequent, reaching 580 frequency
events per hour per 200 m. while the side barriers
due to vehicles slowing down on the road are not too
many on the four roads.
Figure 4: Side Friction.
4.4 V/C Ratio
Based on the v/c ratio data in Figure 5, it is shown
that as a result of this pandemic the Cak Doko road
segment is the road that has the biggest change in
the v/c ratio, namely from 2019 to 2021, the v/c ratio
is 0.69 in a row, 0.29, and 0.33. As for the other
three roads, there were no significant changes due to
the COVID-19 pandemic. On the Piet A. Tallo road
the v/c ratio from 2019-2021 is 0.80, 0.77, 0.82,
respectively, while for the Timor Raya v/c rato road
segment for 2019-2021 it is 0.51, 0.53, respectively.
0.55, and for the Frans Seda road the v/c ratio in
2019- 2021, respectively, is 0.73, 0.73, 0.89.
Based on the data in Figure 5, it further
illustrates that the PPKM carried out by the Kupang
City government only affects school activities. It can
be seen that the most significant decrease in the v/c
ratio only occurred on the Cak Doko road section
which is the center of education from junior high,
high school to vocational school. A slight increase in
saturation on the Frans Seda road that occurred due
to the presence of the Kartini Hospital on that road
segment.
Impact of the Covid-19 Pandemic on Traffic Performance on Urban Roads in Kupang City, Indonesia
165
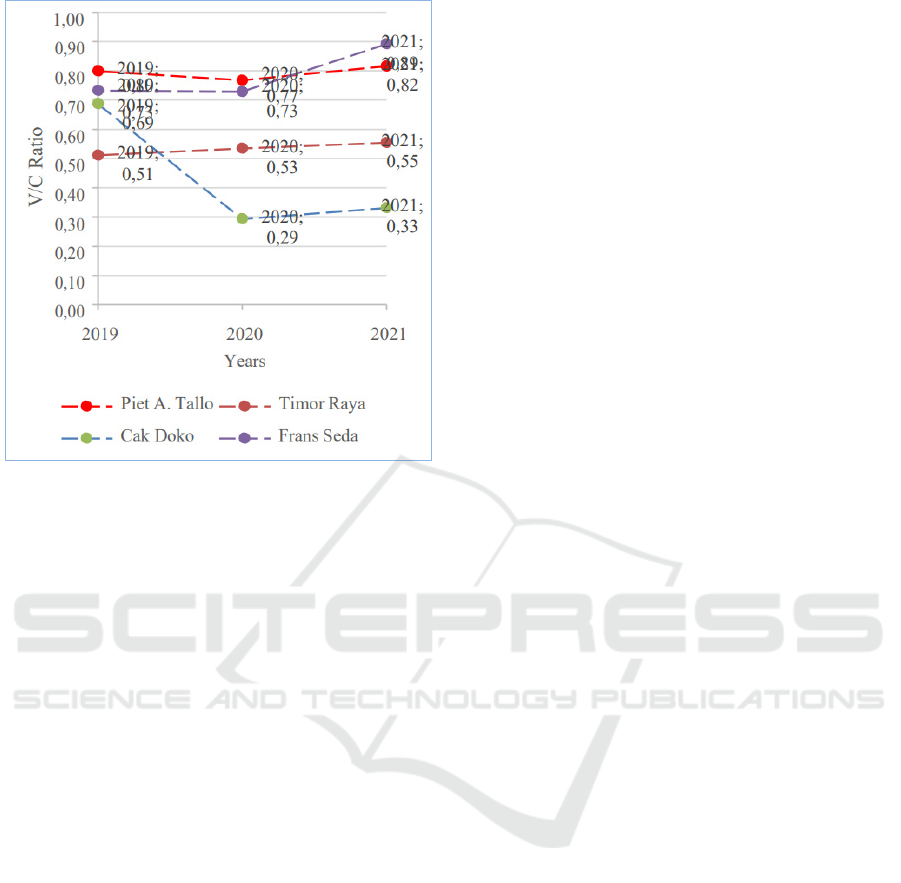
Figure 5: V/C Ratio.
5 CONCLUSIONS
Based on the results and discussion, it can be
concluded that during the COVID-19 pandemic, in
the City of Kupang there was a shift in the use of
motorized vehicles from motorcycles to light
vehicles, meanwhile the implementation of
community activity restrictions (PPKM) carried out
by the Kupang City government only had a major
impact on roads that Usually there are school
activities that have little impact on other community
activities.
REFERENCES
Hurwitz, D. S., Bernhardt, K. L. S., Turochy, R. E., &
Young, R. K. (2015). Transportation Engineering
Instructional Practices: Analytic Review of the
Literature. Transportation Research Record, 2480(1),
45-54.
Goodwin, P., & Noland, R. B. (2003). Building new roads
really does create extra traffic: a response to Prakash
et al. Applied Economics, 35(13), 1451-1457.
Boriboonsomsin, B., & Barth, M. (2008). Real-World CO
2 Impacts of Traffic Congestion. Transportation
Research Record, (951), 1-23.
Sweet, M. (2014). Traffic congestion’s economic impacts:
Evidence from US metropolitan regions. Urban
Studies, 51(10), 2088-2110.
Cui, Z., Zhu, M., Wang, S., Wang, P., Zhou, Y., Cao, Q.,
... & Wang, Y. (2020). Traffic performance score for
measuring the impact of COVID-19 on urban
mobility. arXiv preprint arXiv:2007.00648.
Katrakazas, C., Michelaraki, E., Sekadakis, M., & Yannis,
G. (2020). A descriptive analysis of the effect of the
COVID-19 pandemic on driving behavior and road
safety. Transportation research interdisciplinary
perspectives, 7, 100186.
Jenelius, E., & Cebecauer, M. (2020). Impacts of COVID-
19 on public transport ridership in Sweden: Analysis
of ticket validations, sales and passenger counts.
Transportation Research Interdisciplinary
Perspectives, 8, 100242.
Du, J., Rakha, H. A., Filali, F., & Eldardiry, H. (2021).
COVID-19 pandemic impacts on traffic system delay,
fuel consumption and emissions. International Journal
of Transportation Science and Technology, 10(2), 184-
196.
Goenaga, B., Matini, N., Karanam, D., & Underwood, B.
S. (2021). Disruption and recovery: Initial assessment
of covid-19 traffic impacts in north carolina and
virginia. Journal of transportation engineering, Part
A: Systems, 147(4), 06021001.
Gautama, G., Jaya, F. H., & Meriska, D. (2021). Analisis
Pengaruh U-Turn Terhadap Karakteristik Arus Lalu
Lintas. Teknika Sains: Jurnal Ilmu Teknik, 6(2), 77-83.
Wadu, A., Tuati, A. A., & Sodanango, M. R. (2020).
Strategy To Reduce Traffic Jams On Piet A. Tallo
Street, Kupang City. UKaRsT, 4(2), 138-150.
Wadu, A., Loden, O., & Bria, T. (2019, October).
Analysis of Capacity and Level of Service (LoS) of
Piet A. Tallo Street Kupang, Indonesia. In ICESC
2019: Proceedings of the 1st International Conference
on Engineering, Science, and Commerce, ICESC
2019, 18-19 October 2019, Labuan Bajo, Nusa
Tenggara Timur, Indonesia (p. 73). European Alliance
for Innovation.
iCAST-ES 2021 - International Conference on Applied Science and Technology on Engineering Science
166
