
Application of a Multi-sensor Network in Monitoring of Air Quality
Ade Silvia Handayani
a
, Nyayu Latifah Husni
b
, Ahmad Taqwa and Carlos R. S.
Department of Electrical Engineering, Politeknik Negeri Srwijaya, Jl. Srijaya Negara, Palembang, Indonesia
Keywords: Multi Sensor Network, Monitoring, Air Quality, Pollution.
Abstract: Air pollution is a condition when air quality becomes damaged and contaminated by harmful substances.
Several factors that caused air pollution are increasing infrastructure development, smoke factory, and vehicle
exhaust gases. Air quality in an environment needs to be determined with real-time air quality monitoring
with affordable and accurate sensors. One of the controls and monitoring systems currently being developed
is the Wireless Sensor Network (WSN) which consists of individual nodes that can interact with their
environment by sensing, controlling, and communicating physical parameters. In this research, an air quality
monitoring system will be designed using multi-sensor network technology, which will then be placed in
several locations. This research aimed to measure the parameter of Carbon Monoxide (CO), Carbon Dioxide
(CO2), Hydro Carbon (HC), temperature and humidity, and levels of particulates in the air (PM10). It will
then be collected and sent to the Raspberry Pi's database server via the internet network. Furthermore, the
data will be processed to become information that can be used by users or the general public.
1
INTRODUCTION
Air pollution is a condition when air quality becomes
damaged and contaminated by harmful substances.
Several factors that caused air pollution are increasing
infrastructure development, smoke factory, and
vehicle exhaust gases (Anjum et al, 2021); (Newbury
et al., 2019); (Sheng et al., 2020); (UNECE, 2021). It
can cause various diseases, including eye irritation,
upper respiratory tract infection, sore throat, even
death (WHO, 1992); (Peng et al., 2019); (Qin et al.,
2018); (Handayani et al, 2019).
Based on data from the World Health
Organization (WHO), about 4.2 million people died
from air pollution or about 5% of the 55 million
people who died every year in the world (Anjum et al,
2021); (WHO, 1992). 1500 million people who died
prematurely occurred in Asian cities. The morbidity
rate resulting from air pollution is much higher
(Tarmidi, 2019); (Prihatini et al., 2018); (Kelly and
Fussell., 2015); (Health Effects Institute, 2019).
Air quality in an environment needs to be
determined with real-time air quality monitoring. The
development of technology and information has
brought humans to a new generation of affordable and
a
https://orcid.org/0000-0002-4476-426X
b
https://orcid.org/0000-0003-0072-6664
accurate sensors (detection tools). One of the controls
and monitoring systems currently being developed is
the Wireless Sensor Network (WSN) (Deebak et al,
2020); (Idrees and Zheng, 2020); (Handayani et al,
2020). WSN consists of individual nodes that can
interact with their environment by sensing,
controlling, and communicating physical parameters
(Zervopoulos et al, 2020); (Handayani et al, 2021).
WSN is a network that carries a wireless network
as a link between nodes. It can be used for data
collection and monitoring a system or environment at
the location. WSN consists of several specialized
sensor nodes with sensing and computerized
capabilities (Sahfutri et al, 2018); (Zakaria et al,
2018). It makes WSN can sensing physical
parameters and transmitting the collected data to a
central area using wireless communication
technology (Handayani et al, 2020); (Yahya et al,
2020). The sensor obtains data in real-time, entered
into a database server via an internet network using
the Raspberry Pi to access the data in the monitoring
system application. It shows that the Raspberry Pi has
good complexity and low cost, so it is easy to develop
(Jadon et al, 2020). Multi-Sensor Network (MSN)
system is a new technology that utilizes multiple
sensors and Wireless Sensor Network (WSN) in one
130
Handayani, A., Husni, N., Taqwa, A. and S., C.
Application of a Multi-sensor Network in Monitoring of Air Quality.
DOI: 10.5220/0010941200003260
In Proceedings of the 4th International Conference on Applied Science and Technology on Engineering Science (iCAST-ES 2021), pages 130-140
ISBN: 978-989-758-615-6; ISSN: 2975-8246
Copyright
c
2023 by SCITEPRESS – Science and Technology Publications, Lda. Under CC license (CC BY-NC-ND 4.0)
device. The signal collected from these sensors is
transmitted to the monitoring center using a smart
device to manage distributed resources and optimize
tasks in real-time automatically. This system can
produce object data that is detected by sensors
automatically (Marques et al, 2019); (Taştan and
Gökozan, 2019).
Some of the research was implemented the WSN.
In (Sahfutri et al, 2018), WSN was used to find out
the parking slots available in the parking area. The
monitor serves as a monitoring of the parking slot
area to be displayed so that visitors know whether the
parking slot is still available or even fully charged.
Furthermore, in the research by Xu and Liu (Xu and
Liu, 2017), monitoring water quality using
parameters of oxygen solubility, water pressure, PH,
and temperature by applying the Wireless Sensor
Network (WSN).
In this research, an air quality monitoring system
will be designed using multi-sensor network
technology, which will then be placed in several
locations. For example, in parking areas, on
roadsides, housing estates, industrial sites, etc. The
parameters measured include Carbon Monoxide
(CO), Carbon Dioxide (CO2), Hydro Carbon (HC),
temperature and humidity, and levels of particulates
in the air (PM10). The value of these parameters is
obtained from the sensor's sensing process
periodically. It will then be collected and sent to the
Raspberry Pi's database server via the internet
network. This air quality monitoring system has an
advantage in applying multi-sensor network
technology. More harmful pollutant gases can be
measured in real-time to monitor air quality in the
environment.
2 ENVIRONMENT MONITORING
2.1 Wireless Sensor Network
Wireless Sensor Network (WSN) is one type of
distributed wireless network that utilizes embedded
system technology and a collection of sensor nodes to
perform sensing processes, monitoring, sending data,
and presenting information to users via wireless
network communication (Handayani et al, 2019);
(Handayani et al, 2018). There are many sensors,
including air sensors, temperature sensors, motion
sensors, pressure sensors, radiation sensors, position
sensors, etc. (Zhou et al, 2021). Each sensor also has
software (application, operating system) and
hardware, respectively, which will run into a Wireless
Sensor Network system (Sahfutri et al, 2018).
Each point in the WSN is equipped with a radio
transceiver as a receiving or sending node also other
supporting devices. Therefore, WSN is also known as
a system consisting of several low-cost sensors small
in size and spread over a vast area with one container
node to collect the reading process results for other
sensor nodes (Zervopoulos et al, 2020).
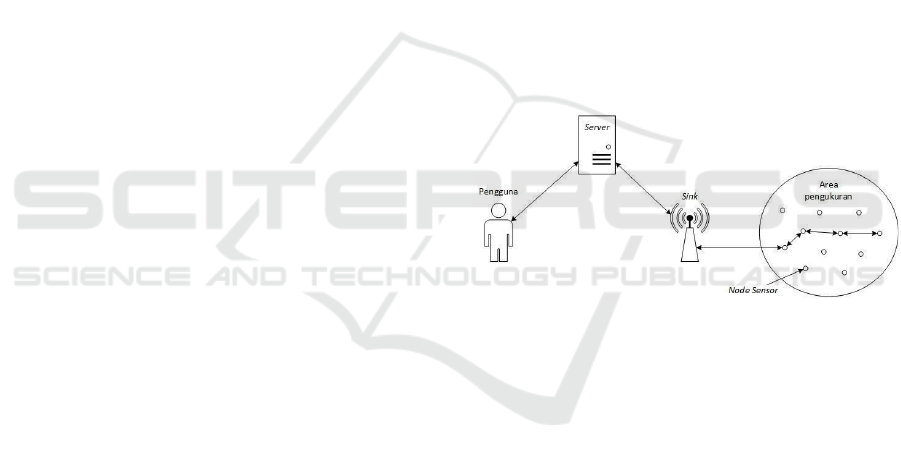
According to the application, the number of nodes
used in a WSN can be in the thousands using low-cost
nodes placed in specific locations. Its small size does
not rule out weaknesses and limitations on sensor
nodes. WSN usually communicates using multi-hop
communication, which aims to save power usage. The
sensor node data will end at a select node called a sink
node. Another communication module or a gateway
to another network equipped is usually called a
gateway in charge of forwarding to cloud storage or
the internet. Sink node processes and computes more
complex data, which sensor nodes may not do. It
makes sink nodes have enough processors, memory,
and energy to properly carry out their tasks. The
architecture of the wireless sensor network can be
seen in Figure 1.
Figure 1: The architecture of the wireless sensor network.
2.2 WSN as Environment Monitoring
Industrial development and construction result in
increased pollution in the environment. Industrial
pollution consists of waste in water, gas, and solid. In
general, this waste is dangerous because most of its
components consist of additives and chemicals that
are difficult to degrade. These substances harm the
environment and threaten the survival of living things
(Yahya et al, 2020).
The environment is currently very polluted
because of the many factors that support pollution.
From industrial waste, environmental pollution also
comes from waste from vehicle emissions. Diesel
engines are considered the single most significant
contributor to environmental pollution caused by
exhaust gas emissions, and they are responsible for
several health problems (Jadon et al, 2020).
WSN is a distributed autonomous device that uses
sensors to monitor physical or environmental
Application of a Multi-sensor Network in Monitoring of Air Quality
131
conditions, such as temperature, sound, vibration,
pressure, and movement in different locations. WSN
cooperatively passes data through the network to the
Base Station. Data can be analyzed in this location
and acts as an interface between the user and the
network (Handayani et al, 2021).
WSN applications are used in commercial and
industrial applications to monitor complicated or
expensive data using wired sensors. WSN is spread
over an area intended to collect data via its sensor
nodes (Handayani et al, 2021).
Currently, the sensor node commonly used is
equipped with an onboard processor. The data
processing component is used to separate the required
data. It is due to many sensor nodes being used and
possible that the distance between nodes will be close
together. Therefore, multi-hop communication is
widely preferred to consume less power than single-
hop communication. Multi-hop communication is
effectively used to overcome some of the signal
propagation effects that often occur in long-distance
wireless communications.
2.3 Sensor TGS 2442 as a Carbon
Monoxide (CO) Detector
Carbon Monoxide (CO) is a gas that is colorless,
odorless, and tasteless. It consists of one carbon atom
covalently bonded to one oxygen atom. There are two
covalent bonds in this bond and one coordinating
covalent bond between the carbon and oxygen atoms.
Most of the CO gas comes from combustion and
emissions from motor vehicles. CO gas is hazardous
if inhaled by humans, especially respiratory problems
and can even cause death (Handayani et al, 2018).
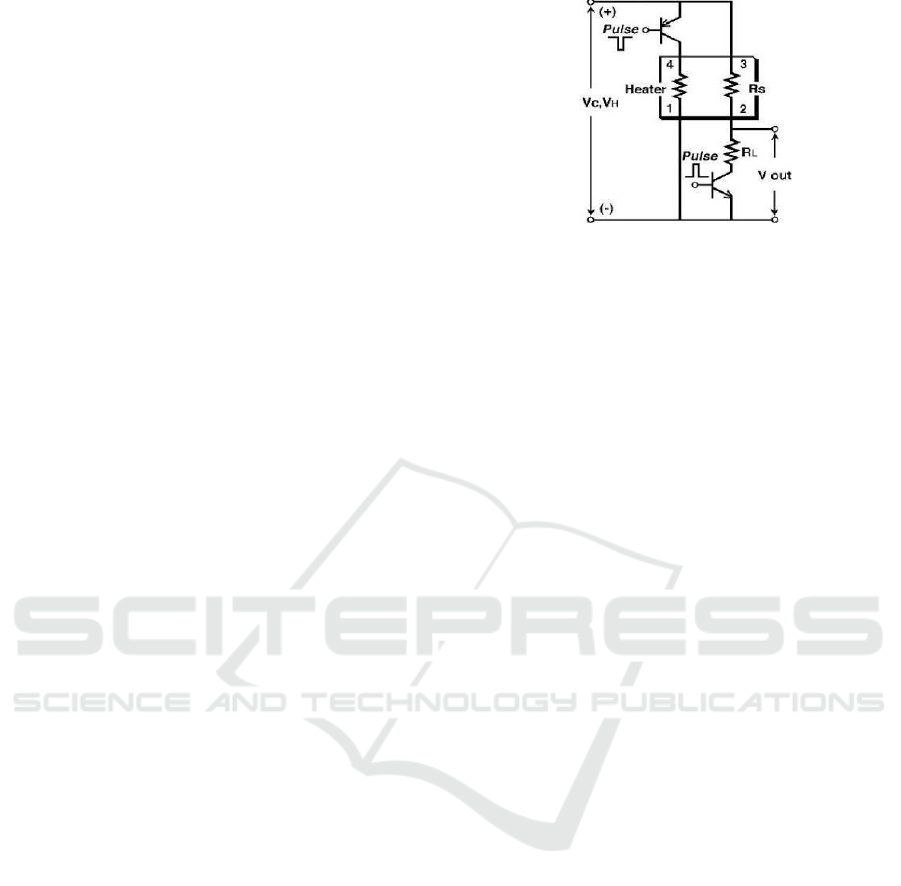
Figure 2 shows the CO sensor used in this system
is the TGS 2442 sensor. This sensor is a carbon
monoxide (CO) gas detector with low power
consumption, minimalist size, and high sensitivity.
This sensor works at a reference voltage of 5 V
connected to the heater (Vh) and Rs. Rs itself is the
sensor's resistance connected to pin 2 and pin 3. Apart
from being a reference voltage, Rs' value is used for
input on the heating element (heater) on pin 1 and pin
2.
2.4 Sensor MG-811 as Carbon Dioxide
(CO2) Detector
Carbon Dioxidant (CO2) is a colorless gas with a
density about 60% higher than air (1,225 g / L) that is
odorless at the concentrations typically encountered.
Carbon dioxide consists of a double covalent carbon
atom bonded to two oxygen atoms. It occurs naturally
Figure 2: Sensor TGS 2442 (Handayani et al, 2018).
in the Earth's atmosphere as a trace gas at a
concentration of about 0.04 percent (400 ppm) by
volume.
In general, the ventilation rate should keep the
carbon dioxide concentration below 1000 ppm to
create indoor air quality conditions that are acceptable
to most individuals (Zhou et al, 2021). In this system,
CO2 detection uses the MG-811 sensor to detect
carbon dioxide gas in the range of 350 - 10000 ppm
with a 5V DC circuit power supply. The MG-811
sensor is suitable for indoor air quality monitoring
systems, fermentation process control systems, etc.
2.5 Sensor GP2Y1010AU0F as PM10
Detector
Particulate matter (PM) is a term for solid or liquid
particles found in the air. Particles that are large or
dark enough can be seen as soot or smoke.
Simultaneously, tiny particles can be seen with an
electron microscope. The particles come from various
sources, both mobile and stationary (diesel trucks,
woodstoves, power plants, etc.) (Mufid et al, 2020).
The PM sensor used in this system is the Sharp
GP2Y1010AU0F sensor. The GP2Y1010AU0F
sensor is a dust sensor that utilizes light scattering or
the so-called optical sensing system. This sensor is
equipped with an LED, and a photodiode arranged
diagonally.
2.6 Sensor TGS 2611 as Hydro Carbon
(HC) Detector
Hydrocarbon (HC) is a gas that is not significantly
detrimental to humans, but it is the cause of the mixed
smog. The hydrocarbon emission in the exhaust gas
is in the form of unburned gasoline. Hydrocarbons are
found in fuel evaporation in the tank, carburetor, and
gas leaks through the gaps between the crank
cylinders commonly called the last gas. For
hydrocarbon gas emission limits in Indonesia, based
on the Decree of the State Minister for the
iCAST-ES 2021 - International Conference on Applied Science and Technology on Engineering Science
132
environment, a maximum HC threshold of 2000 ppm
has been set for 2-wheeled and 3-wheeled vehicles.
For 4-wheeled vehicles or more than 4 wheels, the
maximum HC threshold is 200 ppm (part per million)
(Honeycutt et al, 2019). The HC sensor used in this
system is the TGS 2611 sensor from Figaro, which
has adequate sensitivity and selectivity to methane
gas (CH4). This sensor has a resistance value of Rs,
which changes when exposed to methane gas, and has
a heater that functions to clean the sensor room from
outside air contamination. The TGS 2611 sensor
requires a source voltage of 5 volts, which is well
regulated. This sensor requires two input voltages,
namely heating voltage (VH) and circuit voltage
(VC).
2.7 DHT-11 Sensor as Temperature
and Humidity Detector
Temperature is an energy that can move from a higher
to a lower temperature. Environmental temperature is
the level of hot air in a place expressed in degrees
Celsius (oC). The highest temperature is usually at
01.00 – 14.00 PM, and the lowest is at 04.00 - 05.00
AM.
Humidity is the water vapor content in the air,
measured with a hygrometer in units of %. Air
humidity changes inversely with air temperature
changes, i.e., when the air is cold, the humidity
increases, and when the air is hot, the humidity
decreases ( Honeycutt et al, 2019). The temperature
and humidity sensor used in this system is the DHT-
11 sensor because it has a wide measurement range,
0 to 100% for humidity and -40 degrees Celsius to
125 degrees Celsius for temperature. This sensor also
has a digital output (single-bus) with high accuracy.
3 RESEARCH METHODOLOGY
This study divided the design into two parts, namely
hardware design and software design.
3.1 Hardware Design
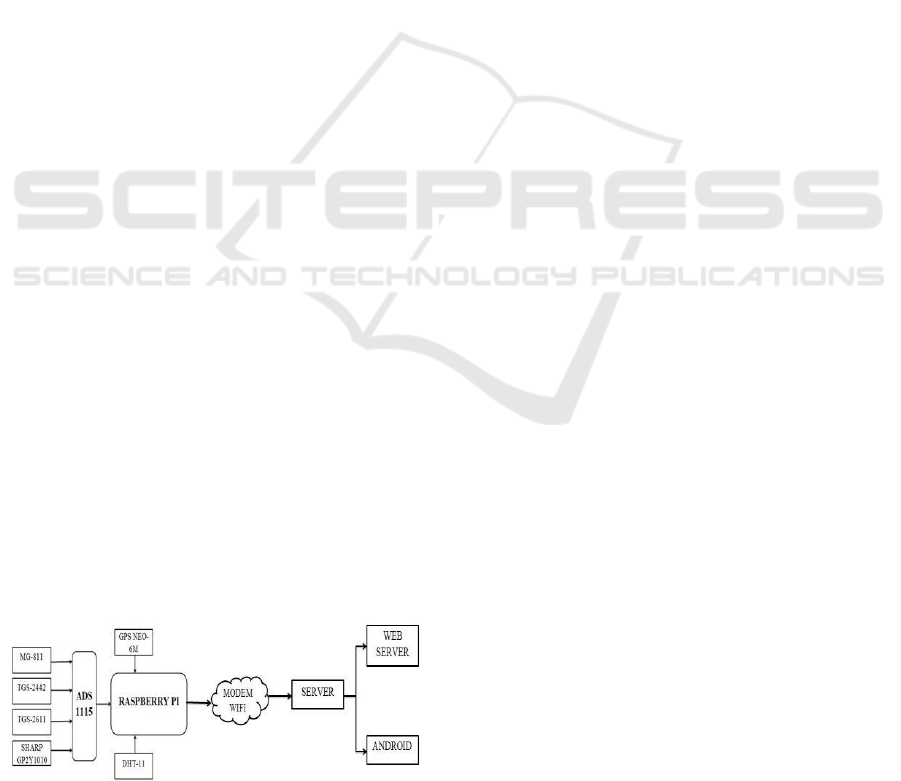
Figure 3: Block Diagram Hardware Systems.
Figure 3, the air quality monitoring system designed
using a Raspberry Pi microprocessor equipped with
Multisensor Network technology. It consists of
several sensors, namely, the Tgs2442 sensor as a CO
sensor, the MG811 sensor as a CO2 sensor, the
Tgs2611 sensor as a Hydrocarbon sensor, the Sharp
GP2Y1010 sensor as a dust sensor, the DHT11 sensor
as a temperature and humidity sensor, and the Neo-
6M GPS module to detect whereabouts. Each node.
The Raspberry Pi can only read the output value in
digital form, while each sensor's output value is
analogous. An ADC or Analog to Digital Converter
module is needed in getting the output value reading,
namely ADS1115 as a sensor reading value
converter. The Raspberry Pi can process it, which
functions as a gateway. The voltage source used in the
tool is a 12V battery.
Raspberry Pi acts as a gateway or intermediary to
forward data transmission before the database server,
which can also be used to store log data. In the
Raspberry pi, an interface called Raspbian is
installed, which functions as data visualization, and
data log storage. The data obtained at the gateway
will be forwarded to the server that has been created.
The communication process from the gateway to
the database server connects the Raspberry Pi to an
available Wi-Fi network, where the SSID and
Password have been predetermined. The Raspberry Pi
has better network capabilities with a dual-band
wireless connection that supports 802.11ac. In this
test, the Wi-Fi network uses a Wi-Fi modem as an
internet service provider. In this test, sensor nodes
will automatically detect air quality levels in a place
and send temperature, humidity, and gas content
information to the server in real-time while the device
is still on. Then the data obtained is entered into a
database table that has been prepared. The data is
used as a caller to display air quality monitoring data
and provide emergency messages about the state of
air quality. The air quality conditions are classified
into 3, namely, Normal, Moderate, and Hazardous.
The complete series of data reading hardware,
data transmission systems, and data storage consists
of 3 parts, namely Node 1, Node 2, and Node 3. In
general, the overall circuit scheme is shown in the
following figure 4.
Application of a Multi-sensor Network in Monitoring of Air Quality
133
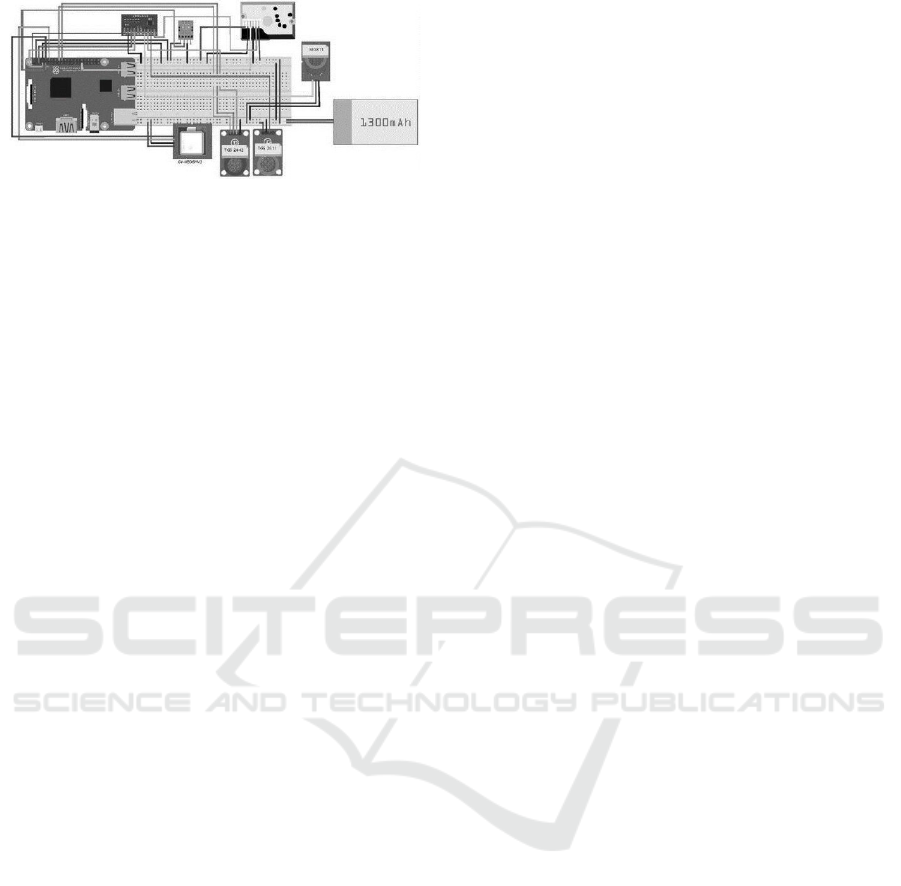
Figure 4: Overall Circuit Design Schematic.
In Figure 4, each Node 1, Node 2, Node 3 has the
same circuit scheme and components. The nodes
consist of several series, including the TGS-2442
sensor circuit, the TGS-2611 sensor circuit, the MG-
811 sensor circuit, the Sharp GP2Y1010 sensor
circuit, the DHT-11 sensor circuit, the NEO-6M GPS
module series, and the ADC-module series. 1115 as
an analog to digital converter.
The TGS-2442 sensor circuit functions to detect
and measure levels of CO gas. This sensor produces
output in the form of analog data, which is converted
into digital data, and calculations are carried out to
have output in the format of ppm (parts per million)
gas units. The primary sensor circuit consists of Vc
(legs 3 and 4) connected to a 5 Volt voltage source on
the Raspberry Pi GPIO pin, Vh (legs 1 and 2)
connected to the ground. In leg 1, before being
connected to the ground, it must first be connected to
a resistor (Rl 20K ohm). The sensor output is
measured at pin 1 connected to the Analog pin (pin
A1) of the ADC and used as input for CO sensor data
readings.
MG-811 sensor circuit functions to measure and
detect CO2 gas. This sensor produces output in
analog data that will later be converted into digital
data on the ADC, and calculations are made to
produce output in ppm (parts per million) gas units.
The MG-811 sensor has 5 pins, namely the VCC,
GND, DOUT (Digital Output), AOUT (Analog
Output), and TCM (Temp Compensation Output)
pins. The VCC pin is given a DC voltage of 5V then
the GND pin is connected to the ground pin on the
Raspberry Pi. In contrast, the AOUT (Analog Output)
pin is connected to the Analog pin (pin A0) ADC
(analog to digital converter), which will be used as
input for reading CO2 sensor data.
The TGS-2611 sensor circuit functions to measure
and detect HC gas. This sensor produces output in
analog data that will later be converted into digital
data by the ADC (Analog to Digital Converter). The
calculation is carried out so that the output is in the
form of ppm (parts per million) gas units. The TGS-
2611 sensor has 4 pins, including VCC, GND, AOUT
(analog output), DOUT (digital output) pins. The
VCC pin is given a DC voltage of 5V. Then the GND
pin is connected to the Raspberry Pi ground pin. At
the same time, the AOUT pin (analog output) is
connected to the analog pin (pin A2) of the ADC
(analog to digital converter), which is used as input
for reading the HC sensor data.
The SHARP GP2Y1010 sensors' series functions
to measure and detect dust particulates with an optical
sensing system. The LED emits an infrared (IRED)
diode, and the photo-transistor is diagonally arranged
in this device. This sensor produces output in analog
data, which will then be converted into digital data by
the ADC (analog to digital converter). The output is
PM10 data with the Dust unit (µg / m3). This sensor
has 6 pins, namely VCC, V-LED, LED-GND, LED,
S-GND, and Vo. The VCC and V-LED pins are
combined and given a DC voltage of 5V, then the
LED-GND and S-GND pins are also integrated to be
connected to the ground pin on the Raspberry Pi. The
LED pin is then connected to the GPIO pin 5
Raspberry Pi. The Vo pin is connected to the analog
pin (pin A3) of the ADC (analog to digital converter),
which will be used to read the PM10 dust particulate
sensor data.
DHT-11 sensor circuit functions to measure the
temperature and humidity of an environment. This
sensor's output data is in digital data where the values
of temperature and humidity measurements have
units of Celsius (˚C) for temperature and in percent
for humidity. This data can be read directly by the
Raspberry Pi by connecting it to the GPIO pin on the
Raspberry Pi. The DHT-11 sensor has 3 pins, namely
the VCC, DATA, and GND (ground) pins. The VCC
pin is given a DC voltage of 5V, and then the DATA
pin is connected to the GPIO 4 Raspberry Pi pin. The
GND pin is connected to the Raspberry Pi's ground
pin.
The GPS-NEO 6M sensor functions to provide
information in the form of latitude and longitude
when the device is on. The GPS-NEO 6M module has
4 pins, including VCC, GND, RX (Receiver), TX
(Transmitter). The VCC pin is given a DC voltage of
5V then the GND pin is connected to the ground pin
available on the Raspberry Pi. Furthermore, so that
the GPS-NEO6M module can communicate with the
Raspberry Pi, the RX pin on the module is connected
to the TX pin on the Raspberry Pi. The TX pin on the
module is connected to the RX pin on the Raspberry
Pi so that the GPS-NEO6M module can send
coordinate point data in the form of latitude and
longitude.
ADS1115 module is a type of ADC with a
resolution of 16 bits. It means that ADC has a high
level of accuracy in the conversion value than ADC
iCAST-ES 2021 - International Conference on Applied Science and Technology on Engineering Science
134
with a little resolution. In this ADC, 4 channels can
convert values for 4 sensors at once with bipolar and
single differentials. The ADS1115 module has 10
pins, including VCC, GND, SCL, SDA, ADDR,
ALRT, and 4 analog pins A0-A3. The VCC pin is
given a DC voltage of 3.3V then the GND pin is
connected to the ground pin on the Raspberry Pi. The
sensor reading data received by the ADS115 will be
sent via I2C serial communication by connecting the
SDA and SCL pins on the ADS1115 with the SDA
and SCL pins on the Raspberry Pi to be processed by
Raspberry pi.
The tool in this final project is to put the sensor in
the right position so that each sensor can work
optimally. The hardware design that will be made is
as follows:
Figure 5: Hardware sensor block design.
(a)
(b)
(c)
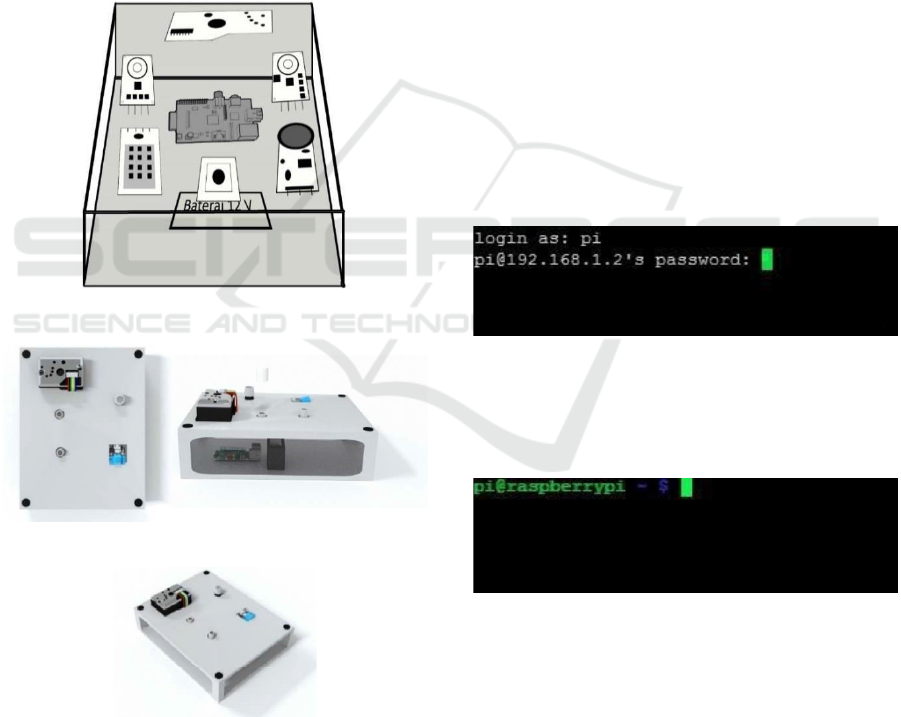
Figure 6: (a) Top View Hardware Design (b) Side View
Hardware Design (c) Front View Hardware Design.
Figure 6 shows the sensor position in the planned
hardware design. This design uses a box made of
plastic. This plastic box aims to make the device
(hardware) more complex and more comfortable to
obtain. The Lippo battery will be arranged alongside
the Raspberry Pi in the box. Meanwhile, each sensor
will be positioned on the box's surface using a screw
to be more robust so that the sensor can read the air
quality around it without any obstruction.
3.2 Software Design
The software design will begin with the tool work
process starting from the sensors' initialization. Then
the sensors will start working on getting air quality
data. The data obtained from the sensor readings will
be sent to the server to be stored and displayed on the
web and Android applications.
3.2.1 Raspberry Pi Configuration
Raspberry Pi uses a Linux operating system called
Raspbian. Using the operating system must be flashed
first on the SD-card because the Raspberry Pi uses an
SD-card as a bootable operating system. After
booting for the first time, it is asked to enter ID: pi
and Password: raspberry, which is the system's
default ID and Password. It can be seen as below,
Figure 7: Login Raspbian.
After logging in, the Raspbian operating system is
ready for use, and the command line will appear as
follows:
Figure 8: Raspbian Command Line Display.
The Raspberry Pi will be connected to the
available internet network and use the SSH protocol
to simplify the operation process. It can remote this
operating system from other clients who are
connected to the same network. After the Raspberry
Pi is connected to the internet network, this mini-
computer will have a local IP.
It can be entering the command "ifconfig" to find
out the local IP, as shown below:
Application of a Multi-sensor Network in Monitoring of Air Quality
135
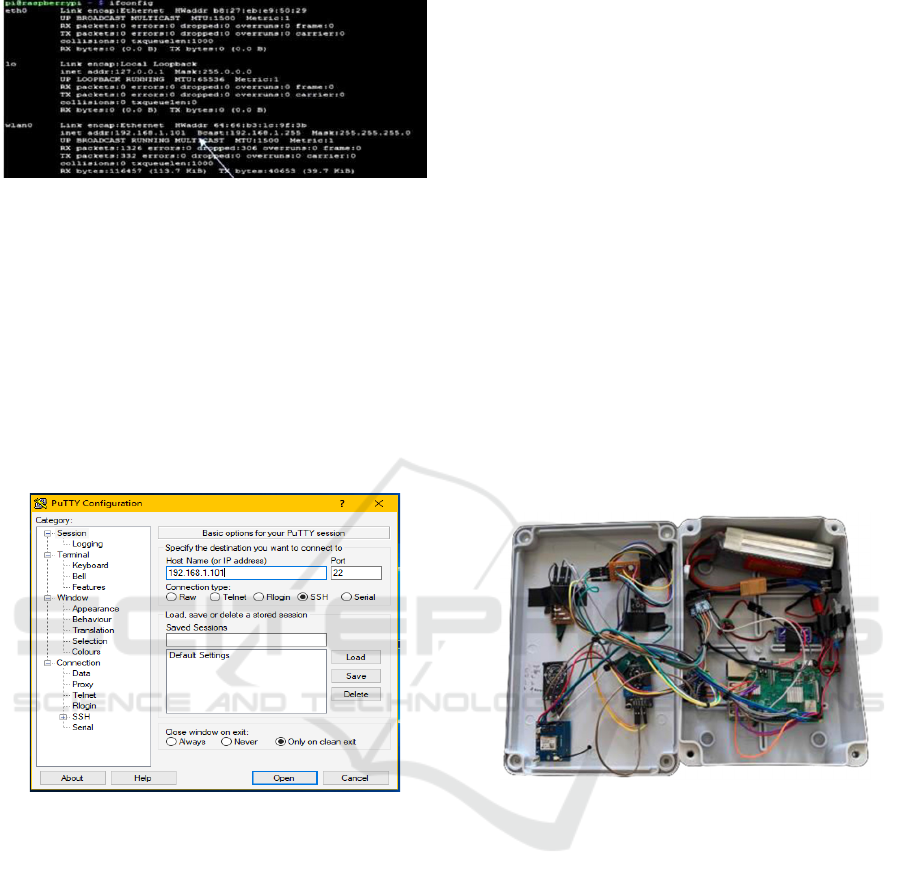
Figure 9: Raspberry Pi’s Local IP.
Other clients can remote on this operating system
after knowing the Raspberry Pi's local IP using the
PuTTY application.
3.2.2 PuTTY Configuration
Ensure the client is connected to the same network as
the Raspberry Pi before running the PuTTY
application. Next, enter the previously known
Raspberry Pi IP address in the Hostname field, then
select the SSH type as follows:
Figure 10: PuTTY Configuration.
If the Host Name is entered and the SSH
connection is selected, then clicking the open button
and successful, the Raspberry Pi is ready to operate.
4 DESIGN RESULT
4.1 Air Quality Monitoring System
Design Results
The system design results are divided into hardware
design and monitoring system software. This system
is designed using Multisensor Network technology to
measure a lot of harmful pollutants. This test's overall
system performance will automatically work when
the sensor reads the pollutant gas levels and sends the
reading data to the server in real-time. Furthermore,
the data will be processed to become information that
users or the general public can use.
4.1.1 Hardware Design
This air quality monitoring system's hardware is
equipped with multi-sensor network technology. This
system used the TGS-2442 sensor as a CO (carbon
monoxide) gas meter, the TGS-2611 sensor as an HC
(hydrocarbon) gas meter, the SHARPGP2Y1010
sensor as a PM10 dust particulate gauge, MG sensor
-811 as a CO2 gas (carbon dioxide) meter, the DHT-
11 sensor as a temperature and humidity meter and
the Neo-6M GPS module as a provider of information
about the coordinates of the points of each node and
the ADS-1115 module as an analog to digital
converter from sensor readings. The system also
equipped with 3 cells 12 volt lithium battery.
Raspberry pi 3 module as a microprocessor, and
communication between hardware and the server as a
database. In the figure below are the results that have
been achieved in making hardware :
Figure 11: Inside of Hardware Display.
The hardware in this air quality monitoring system is
placed in a box to reduce the risk of damage. It
continues to work optimally in conditions of the data
collection process. It makes it easier to find the
location of the tool with location information in
latitude and longitude.
4.1.2 Software Design
Air quality monitoring data will be displayed in
results from readings of each sensor and information
in latitude and longitude. The data obtained from
sensor readings are the result of implementing source
coding on the hardware, which is displayed as
follows:
iCAST-ES 2021 - International Conference on Applied Science and Technology on Engineering Science
136
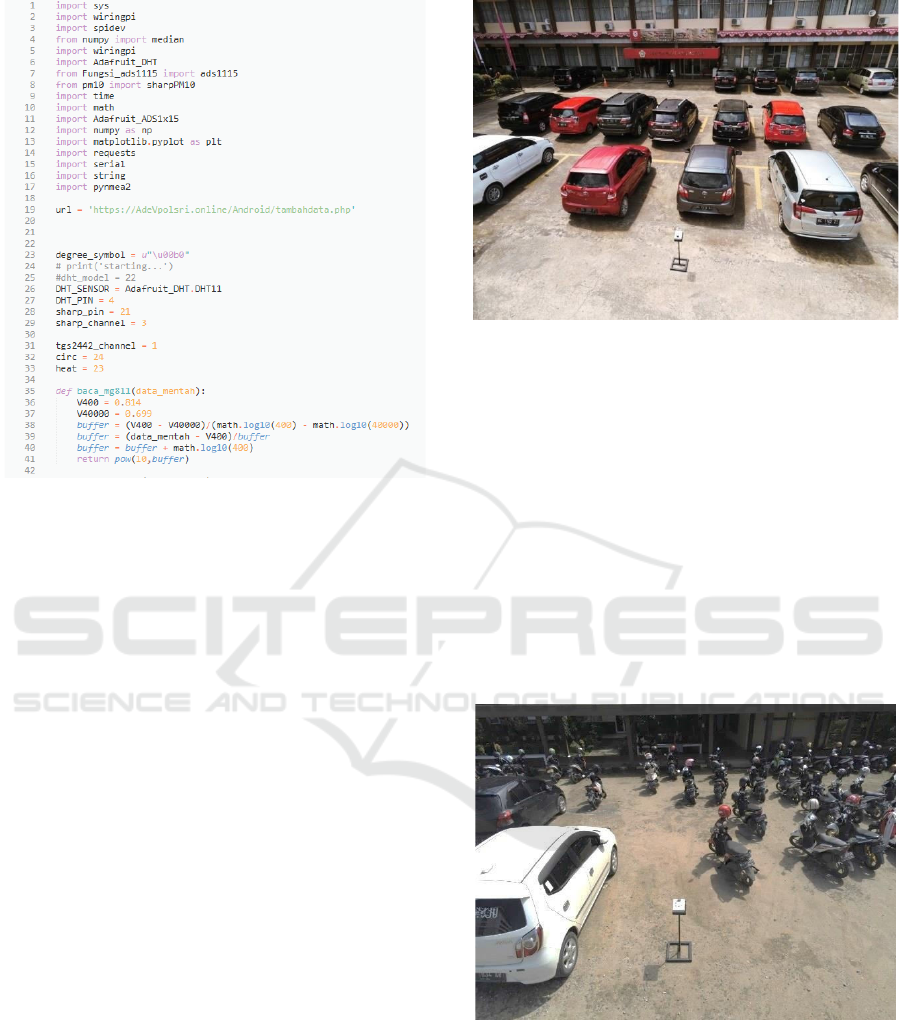
Figure 12: Combined Source Coding Hardware.
Figure 12 is the source coding for each sensor.
The sensor reading data is sent to the database server
using the HTTP post request protocol, which will then
be displayed in the monitoring system application that
has been provided.
4.2 Test Results
In this tool's testing process, each node is distributed
to a predetermined location. The nodes are turned on
simultaneously to monitor air quality at the location.
It sends the read data to the server to be displayed on
the android and webserver interfaces provided in real-
time.
4.2.1 Node 1 Air Quality Monitoring Results
Testing for Node 1 was carried out in the KPA
parking lot of the State Polytechnic of Sriwijaya. This
test is carried out in the morning, afternoon, and
evening which is shown as follows:
Figure 13: Monitoring Node 1 Location.
The results of the sensor slowly show the decrease
in gas levels to normal again with a reading value of
57 ppm of CO, a value of 366-415 ppm of CO2, and
HC value of 275-276 ppm, a value of particulate dust
PM10 17-19 µg / m3, a temperature value of 32 - 33ºC
and humidity 60% - 64%. This is because the location
looks quiet, and there are not many vehicles passing.
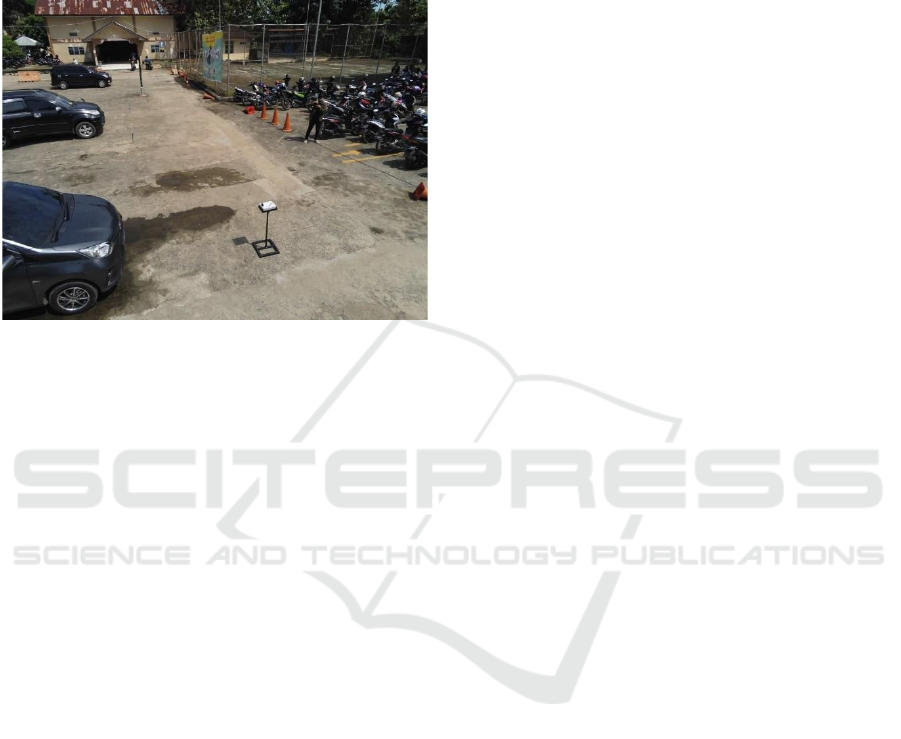
4.2.2 Node 2 Air Quality Monitoring Results
Testing for Node 2 was carried out in the Electrical
Engineering State Polytechnic Sriwijaya parking lot.
This test is carried out in the morning, afternoon, and
evening which is shown as follows:
Figure 14: Monitoring Node 2 Location.
Gas levels at the location returned to normal with
a CO reading of 44 - 45 ppm, a CO2 value of 331 -
336 ppm, an HC value of 365 - 370 ppm, a dust
particulate value PM10 9 - 15 µg / m3, a temperature
value of 32 - 33 ºC and a humidity of 65 % - 66%.
This situation is due to the location that looks
deserted, and there are not many vehicles passing.
Application of a Multi-sensor Network in Monitoring of Air Quality
137
4.2.3 Node 3 Air Quality Monitoring Results
Testing for Node 3 was carried out in the
Management Informatics State Polytechnic Sriwijaya
parking lot. This test is carried out in the morning,
afternoon, and evening which is shown as follows:
Figure 15: Monitoring Node 3 Location.
Gas levels at the Node 3 location returned to
normal with a reading value of CO 52 - 53 ppm, a
CO2 value of 298 - 304 ppm, an HC value of 295 -
298 ppm, a dust particulate value PM10 14-15 µg /
m3, a temperature value of 32 ºC and humidity 62 %-
63%. This condition is due to the location that looks
deserted, and there are not many vehicles passing.
4.3 Air Quality Monitoring System
Performance Analysis
Overall, the multi-sensor network technology works
when the sensor reads pollutant gases' levels in the
surrounding environment. In this study, the system
automatically detects pollutant gas levels and
provides information on each node's location
coordinates. The results will then be sent to the server
in real-time to be processed to provide air quality
information.
The air quality monitoring system has reached 4
parameters in the system testing, i.e., accuracy in
reading data, device durability, device integration,
and ease of use. This system is integrated with an
Android application and a webserver to facilitate the
monitoring process. Therefore, it makes public easier
to access information about air quality in an area.
The sensor testing results showed that the KPA
parking lot air condition at 09.00 AM was still quite
normal. This condition caused the lecture system is
carrying out online activities due to the Covid-19
pandemic. There was an increase in CO2 gas levels
up to 1673 ppm at 12.00 WIB. This condition is
caused by an increase of motorized vehicles so that
the gas from combustion is detected by the sensor,
considering that it is currently a rest time. In the
afternoon, which started at 14.00, the measured gas
levels looked back to normal because the location was
already deserted. There was a change in the value of
the gas during the testing process in other gas level
measurements, but the difference was not seen
significantly and still in normal conditions.
The sensor testing results showed that the air
condition at Electrical Engineering parking lot at
09.00 AM was still quite normal. This condition is
due to the lecture system is carrying out online
activities due to the Covid-19 pandemic. At 12.00
PM, there was an increase in CO2 gas levels up to 647
ppm, but the value of the increase was not as high as
KPA parking lot. At 14.00 , the measured gas levels
looked back to normal because the location
conditions were already deserted. There was a change
in the 0gas value during the testing process in other
gas level measurements, but the difference was not
seen significantly and still in normal conditions. The
results of sensor testing showed that the Management
Informatics parking lot air condition at
09.00 AM increased CO2 gas with a value of 670
ppm. This condition is caused by chemical
engineering students' burning activity while carrying
out practical lessons. Furthermore, at 12.00 PM, the
air had returned to normal because chemical
engineering students' activities had finished. At 14.00
, the measured gas levels still looked normal because
the location conditions were already deserted. There
was a change in the sensor reading value during the
testing process in other gas level measurements.
However, the difference was not seen significantly or
was still in normal conditions.
5 CONCLUSIONS
Based on the result and discussion from this paper,
the air quality monitoring system that has been
designed has a good level of accuracy performance in
determining the levels of gas measured. Measurement
against CO, CO2, HC, PM10, temperature, and
humidity is also good resistance. This monitoring
system successfully sends an “air quality status”
information to the server with an interval of 10-13
seconds. The Raspberry Pi also works well at
managing data and sending it to the server in real-
time.
Based on the conclusions above, authors
recommend developing other sensors such as NO2
iCAST-ES 2021 - International Conference on Applied Science and Technology on Engineering Science
138

sensors, SO2 sensors, and NOx sensors in air quality
monitoring systems. More pollutant gas can be
measured to increase our awareness of air pollution in
the environment.
REFERENCES
Anjum, M. S., Ali, S. M., Subhani, M. A., Anwar, M. N.,
Nizami, A. S., Ashraf, U., & Khokhar, M. F. (2021). An
emerged challenge of air pollution and ever-increasing
particulate matter in Pakistan; a critical review. Journal
of Hazardous Materials, 402, 123943.
Newbury, J. B., Arseneault, L., Beevers, S., Kitwiroon, N.,
Roberts, S., Pariante, C. M., ... & Fisher, H. L. (2019).
Association of air pollution exposure with psychotic
experiences during adolescence. JAMA psychiatry,
76(6), 614-623.
Sheng, Z., Wang, S., Zhang, X., Li, X., Li, B., & Zhang, Z.
(2020). Long-term exposure to low-dose lead induced
deterioration in bone microstructure of male mice.
Biological Trace Element Research, 195(2), 491-498.
Environmental Policy. UNECE, [Online]. Available:
https://unece.org/environment-policy/air.
World Health Organization (WHO). (1992). Urban air
pollution in megacities of the world. Oxford: Blackwell
Reference.
Peng, M., Zhang, H., Evans, R. D., Zhong, X., & Yang, K.
(2019). Actual air pollution, environmental
transparency, and the perception of air pollution in
China. The Journal of Environment & Development,
28(1), 78-105.
Qin, Y., & Zhu, H. (2018). Run away? Air pollution and
emigration interests in China. Journal of Population
Economics, 31(1), 235-266.
Handayani, A. S., Husni, N. L., Permatasari, R., &
Sitompul, C. R. (2019, June). Implementation of Multi
Sensor Network as Air Monitoring Using IoT
Applications. In 2019 34th International Technical
Conference on Circuits/Systems, Computers and
Communications (ITC-CSCC) (pp. 1-4). IEEE.
Tarmidi, T., & Handayani, A. S. (2019). Penerapan
Wireless Sensor Network Sebagai Monitoring
Lingkungan Berbasis Android. Prosiding SENIATI,
224-230.
Prihatini, E., Rasyad, S., Husni, N. L., Handayani, A. S.,
Evelina, E., & Handayani, R. (2018). Robot Pemantau
Kualitas Udara Berbasis Android. Jurnal TIPS: Jurnal
Teknologi Informasi dan Komputer Politeknik Sekayu,
8(1), 74-80.
Kelly, F. J., & Fussell, J. C. (2015). Air pollution and public
health: emerging hazards and improved understanding
of risk. Environmental geochemistry and health, 37(4),
631-649.
Health Effects Institute. (2019). State of global air 2019.
Special Report.
Deebak, B. D., & Al-Turjman, F. (2020). A hybrid secure
routing and monitoring mechanism in IoT-based
wireless sensor networks. Ad Hoc Networks, 97,
102022.
Idrees, Z., & Zheng, L. (2020). Low cost air pollution
monitoring systems: A review of protocols and
enabling technologies. Journal of Industrial
Information Integration, 17, 100123.
Handayani, A. S., Husni, N. L., & Permatasari, R. (2020).
Environmental Application with Multi Sensor
Network. Computer Engineering and Applications
Journal, 9(1), 61-77.
Zervopoulos, A., Tsipis, A., Alvanou, A. G., Bezas, K.,
Papamichail, A., Vergis, S., ... & Oikonomou, K.
(2020). Wireless sensor network synchronization for
precision agriculture applications. Agriculture, 10(3),
89.
UNECE, (2021). Air pollution and health - Air Pollution.
Handayani, A. S. et al., (2021). Air Detection Environment
System (ADeV) Android-Based Application Detect Air
Quality Levels in Parking Area. In 4th Forum in
Research, Science, and Technology (pp. 638-646).
Atlantis Press.
P. A. Sahfutri, N. L. Husni, M. Nawawi, I. Lutfi, A. Silvia.
(2018). Smart Parking Using Wireless Sensor Network
System. Int. Conf. Electr. Eng. Comput. Sci, vol. 17,
pp. 117–122.
Zakaria, N. A., Abidin, Z. Z., Harum, N., Hau, L. C., Ali,
N. S., & Jafar, F. A. (2018). Wireless internet of things-
based air quality device for smart pollution monitoring.
Int. J. Adv. Comput. Sci. Appl, 9(11), 65-69.
Yahya, O., Alrikabi, H., & Aljazaery, I. (2020). Reducing
the data rate in internet of things applications by using
wireless sensor network.
Jadon, A., Varshney, A., & Ansari, M. S. (2020). Low-
complexity high-performance deep learning model for
real-time low-cost embedded fire detection systems.
Procedia Computer Science, 171, 418-426.
Marques, G., Ferreira, C. R., & Pitarma, R. (2019). Indoor
air quality assessment using a CO2 monitoring system
based on internet of things. Journal of medical systems,
43(3), 1-10.
Taştan, M., & Gökozan, H. (2019). Real-time monitoring
of indoor air quality with internet of things-based E-
nose. Applied Sciences, 9(16), 3435.
Xu, Y., & Liu, F. (2017, July). Application of wireless
sensor network in water quality monitoring. In 2017
IEEE International Conference on Computational
Science and Engineering (CSE) and IEEE International
Conference on Embedded and Ubiquitous Computing
(EUC) (Vol. 2, pp. 368-371). IEEE.
Handayani, A. S., Pujiana, D., Husni, N. L., Amin, J. M.,
Sitompul, C. R., Taqwa, A., & Soim, S. (2018,
October). Robustness of Sensors Network in
Environmental Monitoring. In 2018 International
Conference on Applied Science and Technology
(iCAST) (pp. 515-520). IEEE.
Zhou, H., Lai, J., Jin, X., Liu, H., Li, X., Chen, W., ... &
Zhou, X. (2021). Intrinsically adhesive, highly sensitive
and temperature tolerant flexible sensors based on
double network organohydrogels. Chemical
Engineering Journal, 413, 127544.
Application of a Multi-sensor Network in Monitoring of Air Quality
139

Mufid, M. R., Al Rasyid, M. U. H., & Syarif, I. (2018,
October). Performance evaluation of PEGASIS
protocol for energy efficiency. In 2018 International
Electronics Symposium on Engineering Technology
and Applications (IES-ETA) (pp. 241-246). IEEE.
Honeycutt, W. T., Ley, M. T., & Materer, N. F. (2019).
Precision and limits of detection for selected
commercially available, low-cost carbon dioxide and
methane gas sensors. Sensors, 19(14), 3157.
iCAST-ES 2021 - International Conference on Applied Science and Technology on Engineering Science
140
