
Analysing the Characteristics and Behaviours of Travellers for
Developing a Trans Padang New Line
Gusri Yaldi
1
, Imelda M. Nur
2
and Apwiddhal
1
1
Civil Engineering Department, Politeknik Negeri Padang, Kampus Limau Manis, Padang, Indonesia
2
Business Administration Department, Politeknik Negeri Padang, Kampus Limau Manis, Padang, Indonesia
Keywords: Public Transport, Motorcycle, Trans Padang, Trip Behaviors, Demand.
Abstract: Road traffic accidents in Indonesia could generate an economic loss up to 3.1% GDP. It is considerably
related to annual motor vehicles growth rate of private ones. Therefore, it must be controlled and private
motor vehicle users could be shifted to reliable and affordable public transport services like Trans Padang. It
is a Bus Rapid Transit system managed by Padang city. In order to develop a new line for Trans Padang
service according to the traveller characteristics and trip behaviours, a series of Revealed Preference surveys
were employed to collect those data. It was found 72% of the trip makers conduct their journeys by mode of
motorcycles. Commuting trips are 53% and 20.8% for working and school purposes. About 70% of the trip
was undertaken with a maximum travel time of 20 minutes. The traveller spends about an average Rp.5360
for one journey. Travel time was found as the most important factor in selecting a transport mode. Trans
Padang would be chosen due to its safety and convenience factors. The minimum demand of Trans Padang
is expected to be about 17%. However, Trans Padang service must be supported by law enforcement as well
as by combining the public transport and parking schemes.
1 INTRODUCTION
The global road transport problems faced by many
countries are likely similar. Those are the un-
renewable energy crisis, motor vehicle dependence
and its rapid growth, road congestion, air pollution
and increasing number of road traffic accidents
(Yaldi et al. 2016). In Indonesia, the fossil fuel
energy consumed by the road transport sector could
reach 50% of its annual production (BPPN 2006).
Based on the motor vehicle number which tends to
continuously grow, the road transport sector would
remain as the main consumer of fossil fuel energy in
Indonesia. Meanwhile, the annual petrol production
is unable to supply the domestic demand causing the
government to import the deficit from other
countries. Energy crisis would like to occur in the
future.
Road transport in Indonesia is dominated by
Motorcycles where its recorded number in 2018 was
nearly 107 million units followed by Passenger cars
and Trucks. Buses only contributed less than one per
cent of total number motor vehicles. On average,
the motor vehicle number tends to grow 5.68%
annually (BPS 2019). In contrast, road length in
Indonesia grows only about 2500 Km per annum or
about 0.25% (BPS 2018b). There is a wide gap
between the motor vehicle number and road length
growth rate causing negative impacts of transport to
become more severe. Road traffic crashes were the
8th leading cause of death in the world (WHO
2018). In Indonesia, the recorded number of road
traffic crashes tends to increase by more than 5.6%
annually (BPS 2018a). Furthermore, there is an
additional transport related problem for some Asian
developing countries namely motorcycle domination
like in Malaysia as reported by Masuri et al. (2012)
and Vaya et al. (2019) as well as in Indonesia (BPS
2019). Motorcycles are considered as the easiest
transport mode, however it would also be the most
vulnerable ones (Vaya et al. 2019). As
consequences, the total number of road traffic
accidents were dominated by mode of motorcycles
such as in Malaysia (Masuri et al. 2014), Cambodia
(Sarm and Kanitpong 2016) and also Indonesia
where its number could reach 74% of total number
road traffic accidents (WHO 2018). These negative
impacts are already at an alarming level and hence
must be immediately anticipated in order to
minimize its future damages since it could affect a
Yaldi, G., Nur, I. and Apwiddhal, .
Analysing the Characteristics and Behaviours of Travellers for Developing a Trans Padang New Line.
DOI: 10.5220/0010940900003260
In Proceedings of the 4th International Conference on Applied Science and Technology on Engineering Science (iCAST-ES 2021), pages 109-116
ISBN: 978-989-758-615-6; ISSN: 2975-8246
Copyright
c
2023 by SCITEPRESS – Science and Technology Publications, Lda. Under CC license (CC BY-NC-ND 4.0)
109
nation economy lost. For example, economic loss
due to road traffic congestion could reach three to
six per cent of GDP as reported by Gwilliam (2002)
in Ma et al. (2007) while it could reach 3.1% for
economic loss due to road traffic accidents (RI
2011). Yan Ling et al. (2016) suggest that the
negative impact generated by road traffic could be
reduced by providing more transport facilities and
demand controls, for example by controlling parking
supply and by increasing public transport share like
Bus Rapid Transit (BRT). The number of BRT in
Indonesia is growing like Trans Padang, a BRT
operated by the local government of Padang city in
West Sumatra Province; however its application is
still debatable in solving transport problems.
Meanwhile, the local government intends to operate
a new line of Trans Padang service. Therefore,
before adopting a transport solution scheme or a
model which is successful in other countries or
cities, it is necessary to examine its applicability
toward local needs. For examples are its demand and
the behaviours as well as characteristics of its
potential users. This is necessary since different
places could have different or unique characteristics
required by transport planners or modellers to
consider. For example is a study by Yaldi et al.
(2008) where local road user characteristics were
applied into a micro simulation model and hence it
generated more reliable results. In addition, it was
claimed that type of road users and vehicle
ownership as the main factors in road accidents
(Wirawan et al. 2018) which are considerably
related to the road user characteristics. Thus, this
research is aimed at finding the characteristics and
behaviours of the future Trans Padang user prior to
operating a new service line.
2 TRANS PADANG
Padang is a major city with population of about one
million located along a coastal line in West Sumatra,
Indonesia. It was reported that the household
average daily trip rate is nearly 9 trips per day where
more than a half trips are for work and school
purposes (Dishub 2012). This number suggests a
high potential demand for reliable transport
facilities, including affordable and reliable public
transport services.
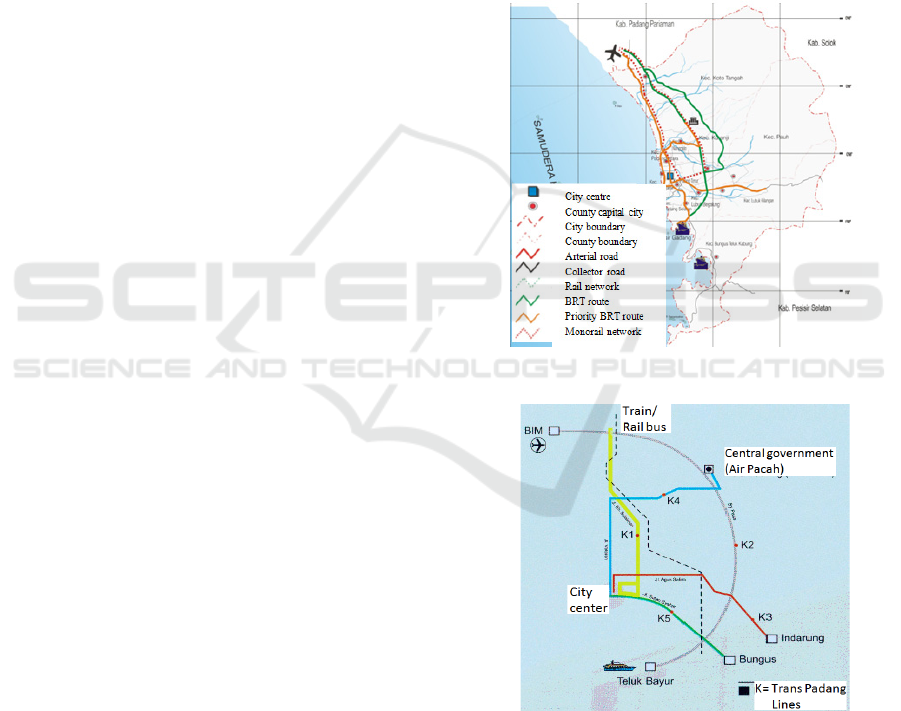
The local government has operated a BRT called
Trans Padang since 2004. It was planned to develop
six lines of Trans Padang as shown by Figures 1 and
2. Those lines are (1) City center-City end, (2) Teluk
Bayur-BIM, (3) City center-Indarung, (4) City
center-Central government, (5) City center-Bungus,
and (6) City center–Andalas university campus.
Lines 1 and 2 have been operating since 2014
and 2021 respectively and other lines would be
operated soon dependent upon its demand and hence
this research becomes essential prior to operating
Trans Padang new lines. It is due to the
characteristics of the future Trans Padang users
including the socio-economic, trip and their
behaviours are analysed through this research. This
is important since the public transport attributes
considered important by the potential user could be
identified based on their socio-economic and trip
characteristics.
Figure 1: Trans Padang Lines.
Figure 2: Existing and future Trans Padang lines.
3 RESEARCH METHOD
The data was collected by using a Revealed
Preference (RP) survey so that the existing trip
maker characteristics and behaviours as well as their
iCAST-ES 2021 - International Conference on Applied Science and Technology on Engineering Science
110
preferences could be identified. This information
includes existing motor vehicle ownership, trip
mode share, trip purpose, trip cost, trip departure and
arrival, factors in selecting transport mode, preferred
public transport facilities, and Ability to Pay (ATP).
This paper only reported for Trans Padang Line 3
only, namely Line City center-Indarung, which is a
dense area in Padang city. RP survey was
undertaken to collect traveller information during
working days and also on weekends with a total
respondent more than 500 including pilot survey by
means of direct interviews. This is considered an
adequate number of respondents compared to the
daily passengers of existing Trans Padang services.
The respondents were randomly selected along the
Line 3 corridor.
4 DISCUSSION
4.1 Traveller Characteristics
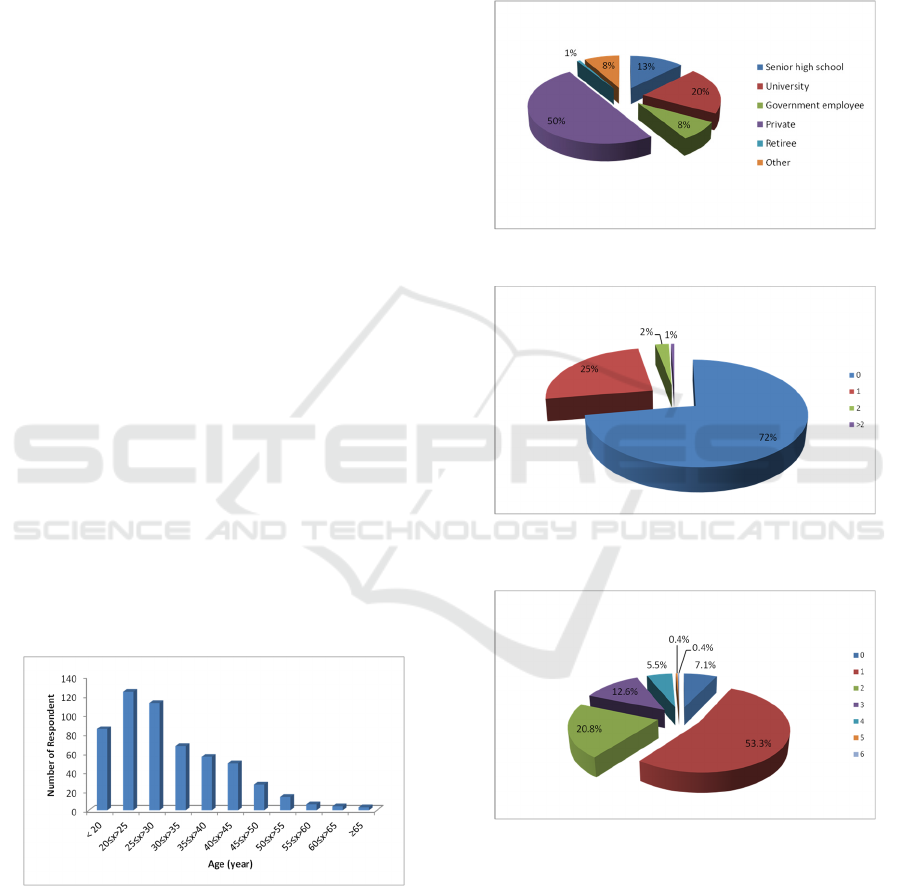
Figure 3 shows that the majority of respondents are
within productive age ranges, where the highest are
within the 20-25 years category followed by 25-30
years. About 50% of respondents work in the private
sector followed by students with a percentage of
33%. The government employees contribute only
8% (see Figure 4 for more details on the respondent
occupation). Once combined together, the work and
school trip percentage becomes 88% indicating a
high commuter number in the study area and hence
required adequate and reliable transport facilities
including public transport services like Trans
Padang.
Figure 3: Respondent distribution based on ages.
Based on motor vehicle ownership, it can be
seen from Figures 5 and 6 that only 28% of
respondents have one private car or more and almost
all of them have motorcycles. It means there is
likely a motorcycle dependent on the traveller daily
life. Furthermore, more than one fourth of travellers
who have private cars also tend to have a
motorcycle. Then, it was found that the percentage
of working or employed respondents is 62% as
depicted by Figure 7 with an average monthly
income of Rp.2.2 million. Thus, one third of
respondents have no income and hence could affect
their decision in selecting transport mode.
Figure 4: Respondent distribution based on profession.
Figure 5: Respondent distribution based on private car
ownership.
Figure 6: Respondent distribution based on motorcycle
ownership.
4.2 Travel Behaviours
The RP survey data suggests that majority
respondents start their journey from homes where
the highest trip purpose is for working followed by
school and shopping with percentages of 53%,
20.8%, and 12.6% consecutively as shown by
Figures 8 and 9. The average travel time was found
Analysing the Characteristics and Behaviours of Travellers for Developing a Trans Padang New Line
111
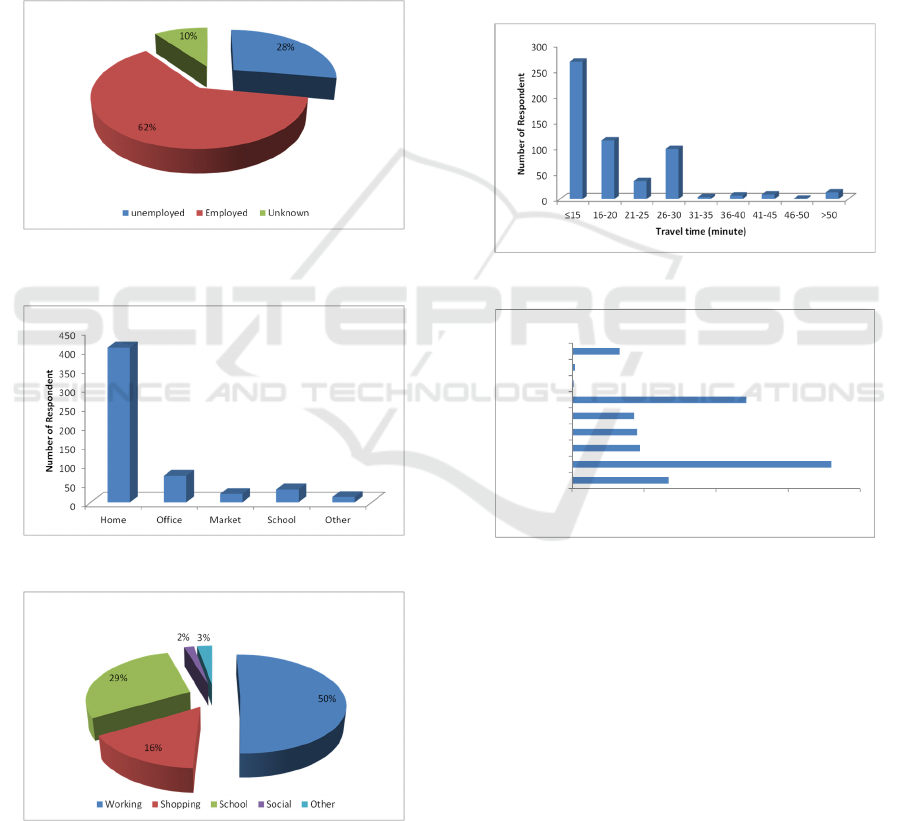
to be 19.4 minutes where nearly a half of the
traveller required 15 minute reaching their
destination (see Figure 10). Moreover, about 21% of
the trip makers travelled between 16 to 20 minutes.
It means 70% of the trip was undertaken with a
maximum travel time of 20 minutes. The survey data
also suggest that more than 90% of interviewed
travellers have a motorcycle and some of them have
more than one motorcycle. Thus, it could be
estimated that the average daily trip length
conducted by the respondent in Padang city is about
10 Km with the majority transport mode is
motorcycles.
Figure 7: Respondent distribution based on occupation
status.
Figure 8: Respondent distribution based on trip origin.
Figure 9: Respondent distribution based on trip purpose.
The traveller spends about an average Rp.5360
for one journey (Rp. stands for Rupiah= Indonesia
currency, one USD equals to about RP.15000). One
third of travellers spend about Rp.2000-Rp.3000
followed by 2.4% respondents spend about Rp.6000-
Rp.7000 for a trip as shown by Figure 11. These
findings could be related with the transport mode
used by the respondent which the majority is
motorcycles. It was found 72% of the trip makers
conduct their journey by mode of motorcycles. Thus,
in order to attract more motorcyclists to use public
transport, the road transport authority should
consider these travel costs in providing affordable
public transport services as well as a regulation
regarding motorcycle ownership and hence its
growth rate could be controlled. Then, the number of
road traffic accidents could be minimized.
Figure 10: Respondent distribution based on travel time.
Figure 11: Respondent distribution based on travel cost.
It was explained before that almost all of
interviewed travellers have a motorcycle, and nearly
40% of them have more than two motorcycles. Only
38%of respondents have a private car. These
statistics would determine the main transport mode
used by the traveller to conduct their trips as can be
seen in Figure 12. There are six main transport
modes, namely (1) Car, (2) Para Transit, (3) Taxi,
(4) Trans Padang, (5) Bicycle, and (6) Others. Para
transit is a common public transport used by
travellers in Padang city as can be seen in Figure 13.
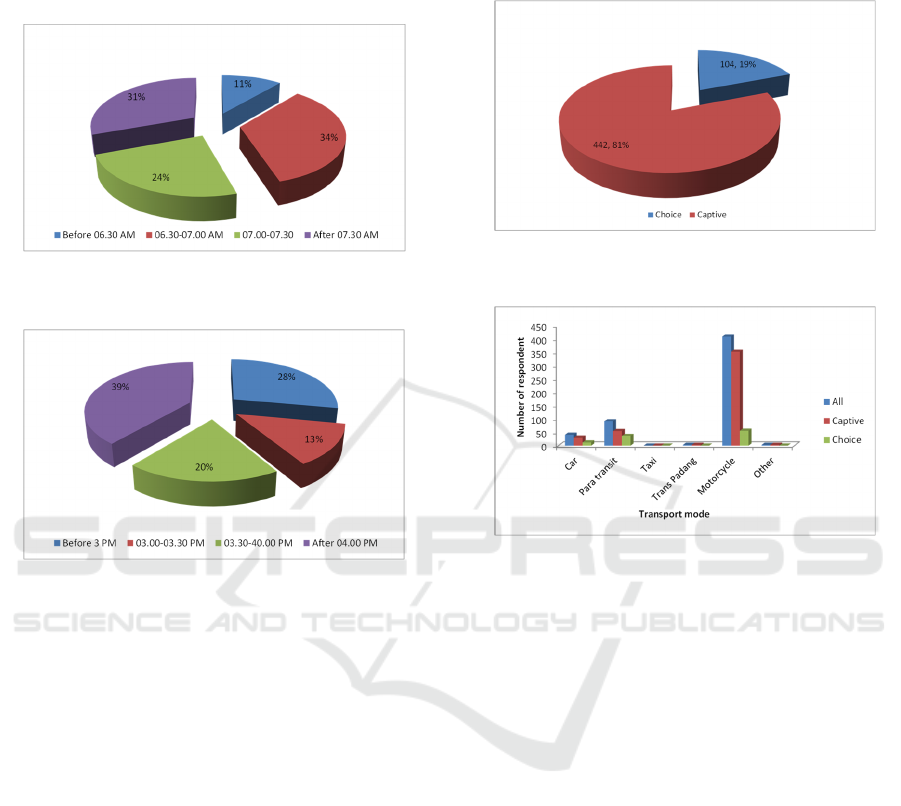
The highest percentage for main transport mode
used by the traveller belongs to Motorcycle,
followed by Para transit and Private car with
percentages of 75%, 17%, and 7% respectively (see
0 50 100 150 200
1000-2000
2000-3000
3000-4000
4000-5000
5000-6000
6000-7000
7000-8000
8000-9000
>9000
Number of Respondent
Travel cost (Rp.)
iCAST-ES 2021 - International Conference on Applied Science and Technology on Engineering Science
112
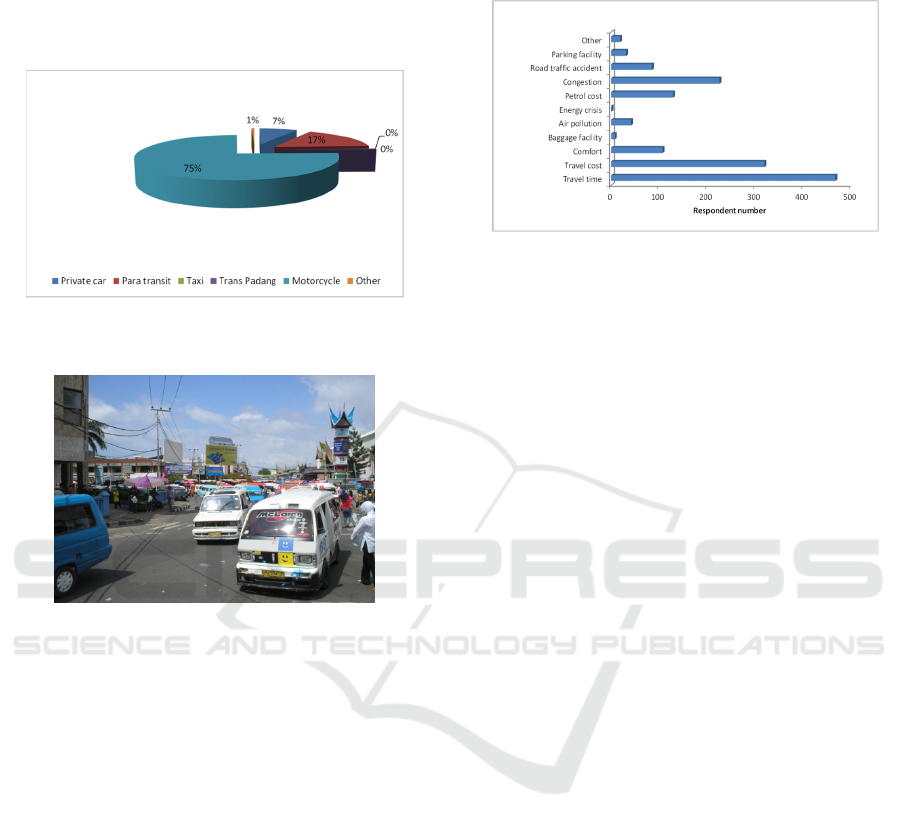
Figure 12 for more details). This trend is strongly
related with the motorcycle ownerships explained
before. Once combined with private cars, the total
percentage of travellers using private motor vehicles
(motorcycle and private car) could reach 82%.
Figure 12: Respondent distribution based on main
transport modes.
Figure 13: Para transit used in Padang city.
4.3 Factors in Selecting Trip Mode
Travel time was found as the most important factor
in selecting a transport mode as reported by Figure
14. It is followed by travel cost, accessibility, safety
and comfort. There is a huge gap between the first
factor and others and it is likely due to a high
motorcycle ownership. This study also investigates
traveller awareness regarding negative impacts of
road traffic such as (1) Energy crisis, (2) Air
pollution, (3) Congestion, (4) Petrol price, and (5)
Road traffic accidents. It seems travel cost and travel
time are considered more important than the
transport negative impacts.
It previously explained that 82% of travellers
conducted their trip by using private motor vehicles
such as motorcycles and private cars. Therefore, the
waiting time was found as zero. It indicates that the
travellers expect transport modes with short waiting
and travel time, and hence private vehicles are
preferred. The government and public transport
operators should consider these preferences in
increasing public transport share and hence the
negative impact resulting from road transport could
be minimized.
Figure 14: Respondent distribution based on factors in
selecting transport mode.
The traveller was also asked their opinion
regarding future Trans City center-Indarung Line
service. Trans Padang would be chosen due to its
safety and convenience factors. The next factor
considered by the traveller is its fare. However, the
travellers prefer to use other transport modes due to
Trans Padang long waiting and travel time as well as
its high stop frequency. It could be influenced by the
poor quality of previous public transport services in
Padang city. In order to capture more travellers
using Trans Padang, it is necessary to provide BRT
service hours based on the traveller trip schedules.
Therefore, the information of traveller working
hours is required. Based on the survey data as
depicted by Figure 15, it is known that 69% of
travellers started their journey before 07.30 AM.
About 11% of travellers start it earlier, namely
before 06.30 AM. Meanwhile, 31% of travellers
begin their journey after 07.30AM. About 61% of
travellers return to their residence before 04.00 PM,
however it is distributed in three different time
ranges namely before 03.00PM,15.00-15.30PM and
1.30-16.30PM where the percentages are 28%, 13%
and 20% respectively (see Figure 16). Then, 39% of
travellers return to their residence starting at
04.00PM. Thus, the peak demand could be predicted
and would occur during 06.30-07.30AM for
morning peak and after 04.00PM for afternoon peak.
This information could be considered by the Trans
Padang operator in designing its operating hours so
that it fits with the traveller needs. The survey data
suggests that the traveller is likely to travel alone
and hence the occupation rate of used transport
mode could be considered only one and the majority
of used transport mode is private motor vehicles.
This trend would result in more vehicles on the road,
especially motorcycles. It could cause more road
traffic accidents involving motorcycles.
Analysing the Characteristics and Behaviours of Travellers for Developing a Trans Padang New Line
113
Furthermore, it also could worsen congestion levels
since road length growth rate is much lower than
motor vehicles as suggested by Morichi (2005) and
Soehodho (2007).
Figure 15: Respondent distribution based on departure
time.
Figure 16: Respondent distribution based on trip end
schedule.
4.4 Estimated Trans Padang Demand
This research also explores the estimated demand of
Trans Padang for the City center-Indarung Line.
Firstly the traveller was asked regarding their
alternative mode of transport as can be seen in
Figures 17 and 18. It can be seen that 81% of
travellers remain with their current transport modes
or called as captive users, and only 19% would use
other transport modes or called as choice users. This
information indicates that the traveller tends to use
private motor vehicles more than others. However,
10.6% of existing captive user transport modes is
public transports (Para transit and Trans Padang).
Once public transport users from captive users
combined with public transport users from choice
users, the percentage becomes 17.1%. This
percentage could be assumed as the minimum
demand of public transports like Trans Padang for
the new line, and it needs to be maintained. The
Trans Padang operator is required to convince them
to use Trans Padang by providing reliable and
affordable Trans Padang services as expected by the
traveller. It includes bus fare, service time table,
travel time and on board convenience facilities as
previously discussed.
Figure 17: Respondent distribution for captive and choice
users.
Figure 18: Captive and choice users based on existing
transport mode.
The choice user was then asked regarding their
type of alternative modes. The options are (1)
Private car; (2) Chartered vehicle; (3) BRT/Trans
Padang; (4) Taxi; (5) Motorcycle; (6) Train; (7)
Bicycle; and (8) Others. The result is displayed in
Figure 19. It can be seen that motorcycles are still
the main alternative transport mode and followed by
private cars. However, About 33% of travellers are
still undecided about their alternative transport
modes. Further, it was found that 11% of choice
users would shift to Trans Padang services. This is
interesting since the Trans Padang service for City
center-Indarung is still unavailable. This promising
information suggests that the traveller expects this
line to be immediately operated.
The average travel cost for different road user
categories are reported in Table 1. The highest one
belongs to captive road users which is Rp.5630 per
trip and followed by all traveller categories which is
Rp.5360. Meanwhile, it is Rp.4414 per trip for
choice users. This data indicates that in order to
encourage more travellers using Trans Padang
services the bus fare should be lower than these
travel costs, especially for choice road users where
iCAST-ES 2021 - International Conference on Applied Science and Technology on Engineering Science
114
the average cost for a trip is much lower compared
to other road user categories.
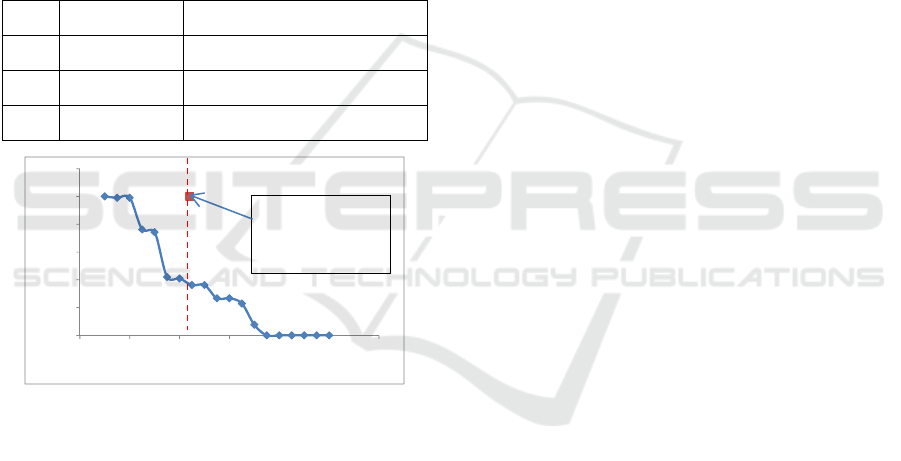
Furthermore, Figure 19 shows the Ability to Pay
(ATP) of choice user as illustrated by full
continuous line. It can be seen that there is a huge
gap between the travellers ATP for one trip once
using public transports compared to the existing
average travel cost for one trip. The highest ATP is
Rp.7000 per trip and the lowest one is Rp.1000 per
trip. The average ATP is Rp.2399 per trip which is
much less than the average travel cost per trip. It can
also be seen that only about 36% choice users have
the same ATP with average travel cost per trip. This
gap could arise since the traveller seems to use the
motorcycle as the benchmark in defining their ATP
once using public transport.
Table 1: Traveller average cost per trip.
No. Traveller type Average travel cost/trip (Rp.)
1. All 5360
2. Captive 5601
3. Choice 4414
Figure 19: Captive and choice users based on existing
transport mode.
5 CONCLUSIONS
Based on the findings from this research it can be
seen that the majority of travellers along the future
Line of Trans Padang discussed in this study (Line
3) tends to use motorcycles as the main transport
modes. Although motorcycles use much less road
space than other kinds of transport modes and hence
its contribution in road congestion seems also minor,
it may cause other negative impacts of road transport
like road traffic crashes. Therefore, its growth rate is
required to be controlled and motorcyclists are
encouraged to use safer trip modes like Trans
Padang service. However, the road transport
authority and public transport operator are
recommended to fulfil the motorcyclist preferences
regarding public transport facilities so that mode
shift could occur, especially for City center-Indarung
Line.
Those preferences include bus fare, service time
table, travel time and on board convenience
facilities. The minimum service standard for road
public transport could be referred to Indonesian
Ministry of Transportation Rule No.10 published in
2012 (Mangindaan 2012). It is admitted that reliable
and affordable public transports itself is perhaps
unable to encourage a significant number of
motorcyclists to use public transports. It must be
supported by serious law enforcement as well as by
combining the public transport schemes and parking
schemes. The future research would be directed to
these two aspects.
ACKNOWLEDGEMENTS
The researcher would like to thank The Indonesian
Ministry of National Education, Culture, Research,
and Technology for funding this research.
REFERENCES
BPPN. (2006). "Effort to minimize the petrol consumption
in transportation sector (in Bahasa)". City: Bappenas
(National Planning Body) of Indonesian Republic:
Jakarta.
BPS. (2018a). "Road crash number, Victim, and Material
Loss". City.
BPS. (2018b). "Road length in Indonesia (in Bahasa)".
City: Statistics Indonesia: Jakarta.
BPS. (2019). "Motor vehicle number in Indonesia (in
Bahasa)". City: Statistics Indonesia: Jakarta.
Dishub. (2012). Mass Transit Program of Padang City (in
bahasa). Padang Transport Department, Padang.
Gwilliam, K. (2002). Cities on the Move: A World Bank
Urban Transport Strategy Review. World Bank,
Washington, DC.
Ma, H., Yang, X., and Shi, Q. (2007). "Motorization
Process and Management in Big Cities in China."
IATSS Research, 31(2), 42-47.
Mangindaan, E. E. (2012). "Minimum standard for road
public transport", U. S. D. o. Transportation, (ed.).
City.
Masuri, M. G., Dahlan, A., Danis, A., and Isa, K. A. M.
"Public Participation in Shaping Better Road Users in
Malaysia." Presented at Asia Pacific International
Conference on Environment-Behaviour Studies Berlin.
Masuri, M. G., Isa, K. A. M., and Tahir, M. P. M. (2012).
"Children, Youth and Road Environment: Road
0
20
40
60
80
100
120
0 2000 4000 6000 8000 10000 12000
Respondent percentage (Rp.)
Public transport fare (Rp.)
Average
cost/trip
(Rp.2399/trip)
Analysing the Characteristics and Behaviours of Travellers for Developing a Trans Padang New Line
115

Traffic Accident." Procedia - Social and Behavioral
Sciences, 38, 213-218.
Morichi, S. (2005). "Long-term Strategy for Transport
System in Asian Megacities." Journal of the Eastern
Asia Society for Transportation Studies, 6, 1-22.
RI. (2011). "National Plan for Road Safety 2011-2035".
City: Dirjen Hubdat.
Sarm, S. A., and Kanitpong, K. (2016). "Analysis of
Factors Affecting the Severity of Motorcycles
Casualties in Phonm Penh Usinga a Bayesian
Approach " Asian Transport Studies, 4(2), 430-443.
Soehodho, S. (2007). "Motorization in Indonesia and Its
Impact to Traffic Accidents." IATSS Research, 31(2),
27-33.
Vaya, P., Simon, R., and Khatri, S. K. "Motorcycle Safety
Solution using the Internet of Things." Presented at
2019 4th International Conference on Information
Systems and Computer Networks (ISCON).
WHO. (2018). Global Status Report on Road Safety 2018.
Wirawan, M., Syaaf, R. Z., and Susilowati, I. H. (2018).
"Road Accident Investigation in Indonesia: An
Analysis from Human Aspect Perspective." Indian
Journal of Public Health Research & Development,
9(11).
Yaldi, G., Nur, I. M., Momon, and Apwiddhal. (2016).
"Defining Suitable Parking Controls to Minimize
Negative Impacts of Road Traffic: A Case Study in
Padang City." International Journal on Advanced
Science, Engineering and Information Technology,
6(5), 600-606.
Yaldi, G., Yue, W. L., and Syofyan, E. R. (2008).
"Finding alternative ways of minimising the impacts
of local problems in using micro simulation
software"31st ATRF Conference. City: Gold Coast, pp.
511-525.
Yan-ling, W., Xin, W., and Ming-chun, Z. (2016).
"Current Situation and Analysis of Parking Problem in
Beijing." Procedia Engineering 777 – 785.
iCAST-ES 2021 - International Conference on Applied Science and Technology on Engineering Science
116
