
Decision Support System for Exported Grade Coffee Selection using
AHP and TOPSIS
Putu Indah Ciptayani
a
, Ni Gusti Ayu Putu Harry Saptarini
b
and Putu Manik Prihatini
c
Electrical Engineering Department, Politeknik Negeri Bali, Jalan Kampus Bukit Jimbaran, Badung, Indonesia
Keywords: Decision Support System, DSS, AHP, TOPSIS, Coffee Quality, Export Coffee.
Abstract: Coffee is one of the most famous commodities in the world. Indonesia is one of the largest coffee exporting
countries in the world. Determination of the quality of coffee for export follows the Indonesian National
Standard (SNI). In the SNI there are several criteria for determining the quality of export coffee. Each criterion
has its own nature and importance according to the preferences of the decision maker. This study aims to
apply the AHP and TOPSIS methods to build a decision support system (DSS) in selecting export coffee.
AHP was succeed in determine the weight of each criterion by building a pairwise comparison matrix between
criteria according to the preferences of the decision maker. The combination with TOPSIS was used to deal
with benefit and cost criteria. On the last step, TOPSIS was succeed in rank all the alternatives by determine
the closeness score of each alternative.
1 INTRODUCTION
Coffee is one of the most consumed beverages in the
world (Neves et al., 2011). The website
http://www.ico.org reported that coffee traded in the
world is mostly Arabica dan Robusta (ICO, 2021). By
October 2020 – May 2021, total Robusta traded
worldwide was 31.435.000 bags (36%), while
Arabica was 55.864.000 bags (64%). Based on the
report of production in each country, Indonesia is one
of the largest coffee producers after Brazil, Colombia
and Vietnam.
Indonesia has a national standard for coffee bean
quality. The assessment of the coffee beans takes
quite a long time. The decision-making process to
decide which coffee has better quality is also a
complex process. The challenge in decision-making
process is the subjective judgment. One of the
alternatives to simplify the process of multi criteria
decision making is to use the decision support system
(DSS). DSS was widely used to help the decision
maker (Belaid & Razmak, 2013).
There are many decision support system methods
that widely used recently. Simple Additive Weighting
(SAW)(Tanjung & Adawiyah, 2019), Analytic
a
https://orcid.org/0000-0002-6923-3852
b
https://orcid.org/0000-0002-4007-929X
c
https://orcid.org/0000-0001-7538-3235
Hierarchy Process (AHP)(Liu, 2017), Technique for
Order of Preference by Similarity to Ideal Solution
(TOPSIS)(Panda & Jagadev, 2018) and Promethee
(Taillandier et al., 2013) were the DSS method that
already implemented in real-life case. Most of DSS
use one method, but there was the study to combine
AHP and SAW conducted by Ciptayani et al.
(Ciptayani et al., 2018).
This study aims to build the decision support to
help the decision maker in deciding the Robusta
coffee quality to be exported. The coffee quality
assessment based on general and specific criteria
listed in SNI-01-2907-2008. The decision-making
process can be a complex and time consuming
because it involves multi criteria and alternatives.
Some criteria may have sub criteria, while each
criterion has their own weight based on the decision
maker preferences. Besides that, the criteria in coffee
quality assessment consists of two type, benefit and
cost. The selection of DSS method plays an important
role in order to build a great DSS.
The AHP method is one of the DSS method that
widely used. This method builds a comparison matrix
to define the weight of each criterion based on the
decision maker priority dan preferences. Demirtas et
Ciptayani, P., Saptarini, N. and Prihatini, P.
Decision Support System for Exported Grade Coffee Selection using AHP and TOPSIS.
DOI: 10.5220/0010939700003260
In Proceedings of the 4th International Conference on Applied Science and Technology on Engineering Science (iCAST-ES 2021), pages 47-54
ISBN: 978-989-758-615-6; ISSN: 2975-8246
Copyright
c
2023 by SCITEPRESS – Science and Technology Publications, Lda. Under CC license (CC BY-NC-ND 4.0)
47

al. stated that comparing each criterion can guarantee
the result decision(Aktar Demirtas et al., 2015).
Recent study in AHP method conducted by Pujadi at
el. for teacher placement (Pujadi et al., 2017),
Hutasuhut et al. implemented AHP to find the best
restaurant (Hutasuhut et al., 2019), while Retrialisca
et al. using AHP on SBMPTN Try-Out (Retrialisca
et al., 2019). Considering that the criteria in coffee
quality assessment consist of benefit and cost criteria,
the method that deal with it was needed. TOPSIS
method calculated the closeness score of each
alternative and guaranteed that the best alternative has
the shortest distance to the positive ideal solution and
the farthest distance to the negative ideal solution
(Madi et al., 2016). The objective of this study is to
combine the AHP and TOPSIS method to build a DSS
in assessing quality of coffee to be exported. AHP
was used to comparing each criterion in order to get
the criteria weight, while TOPSIS was used to rank
each alternative based on the closeness score. The
combination of AHP and TOPSIS was study by
Iswari et al. (2019) to select the outstanding student
and Bagi et al. (2020) for high achieving student. Bagi
et al (2020) found that combining both methods can
speed up the selection process and making the results
more objective. Iswari et al. (2019) found that
combining AHP and TOPSIS was better than
TOPSIS.
2 METHODOLOGY
This study combining the AHP and TOPSIS to build
a DSS for coffee selection to be exported. The AHP
method was used to calculate the weight of criteria by
build the comparison matrix. Finally, TOPSIS was
implemented to rank the alternatives.
2.1 Analytic Hierarchy Process (AHP)
Every decision-making process has criteria and
alternatives. Although using the same criteria and
alternatives, the decision result may be different
between one decision maker and others. This can be
happened because each decision maker has their own
preference and priority. This study using AHP to
compare the priority of each criterion to other criteria
using comparison matrix. The AHP follows the steps
below (Qing, 2011):
Step 1: Build the comparison matrix A of each
criterion based on Saaty scale (Irvanizam, 2017)
Step 2: Build the the normalized comparison matrix
B using Equation 1
𝑏
=𝑎
𝑎
(1
)
where n is the number of criteria, i,j = 1, 2, … n and
a
kj
is the element of matrix A.
Step 3: Calculate the row-sum (v) of matrix B using
Equation 2
𝑣
= 𝑏
(2
)
where n is the number of criteria, i = 1, 2, … n and b
ij
is the element of matrix B.
Step 4: Normalize the v
i
to get the weight (W) of each
criterion using Equation 3
𝑤
=𝑣
𝑣
(3
)
where n is the number of criteria, i = 1, 2, … n, and v
i
is the row-sum of i
th
criterion.
Step 5: Consistency check. This step is conducted to
guarantee that the matrix A inputted by user is
consistent. First of all, the eigen value (λ
max
) will be
calculated using Equation 4.
𝜆
=
∑
𝑎
𝑤
𝑛𝑤
(4
)
where n is the number of criteria, a
ij
is element of
matrix A, and w
i
is the weight of i
th
criterion.
The value of CI was calculated using Equation 5
𝐶𝐼=(𝜆
−𝑛)(𝑛−1
⁄
)
(5
)
where n is the number of criteria and 𝜆
is the
eigen value.
The consistency ratio (CR) is calculated using the
Equation 6
𝐶𝑅=𝐶𝐼 𝑅𝐼
⁄
(6
)
where RI is random index value. The RI value used in
this study was taken from(Franek & Kresta, 2014).
The matrix is considered to be consistent if the value
of CR was no more than 0.1.
2.2 Technique for Order of Preference
by Similarity to Ideal Solution
(TOPSIS)
TOPSIS method is one of the methods for DSS. The
coffee selection case in this study has two kinds of
criteria, named benefit and cost. The TOPSIS method
final result is the closeness score. The closeness score
indicates the distance of the alternative from the
positive and negative ideal solution. The positive
iCAST-ES 2021 - International Conference on Applied Science and Technology on Engineering Science
48
ideal solution maximizes the benefit criteria and
minimize the cost. On the other hand, the negative
ideal minimize the benefit criteria and maximize the
cost (Madi et al., 2016).
Consider there is matrix X
mxn
, where m is the
number of alternatives and n is the number of criteria.
The matrix element x
ij
is the value of the i
th
alternative
in j
th
criterion. TOPSIS method follows the step
below (Pavić & Novoselac, 2013):
Step 1: Build normalized decision matrix R using
Equation 7.
𝑟
=
𝑥
∑
𝑥
(7)
Step 2: Build normalized weighted matrix (V) using
Equation 8
𝑣
=𝑤
𝑟
(8)
where w
j
(j= 1, 2, …n) is the weight of j
th
criterion.
Step 3: Determine the positive (A
+
) and negative (A
-
) ideal solution using Equation 9 and 10 respectively
𝑎
=
𝑚𝑎𝑥
𝑣
,𝑖𝑓 𝑐
𝑖𝑠 𝑏𝑒𝑛𝑒𝑓𝑖𝑡
𝑚𝑖𝑛
𝑣
,𝑖𝑓 𝑐
𝑖𝑠 𝑐𝑜𝑠𝑡
(9)
𝑎
=
𝑚𝑖𝑛
𝑣
,𝑖𝑓𝑐
𝑖𝑠 𝑏𝑒𝑛𝑒𝑓𝑖𝑡
𝑚𝑎𝑥
𝑣
,𝑖𝑓 𝑐
𝑖𝑠 𝑐𝑜𝑠𝑡
(10)
where c
j
is the j th criterion.
Step 4: Calculate the alternative distance (D) from A
+
and A
-
using Equation 11 and 12 respectively
𝐷
=
(𝑣
−𝑎
)
(11)
𝐷
=
(𝑣
−𝑎
)
(12)
Step 5: Calculate the closeness (C) using Equation 13
𝐶
=𝐷
(𝐷
+𝐷
)
⁄
(13)
the closeness score is the final score used to rank the
alternatives.
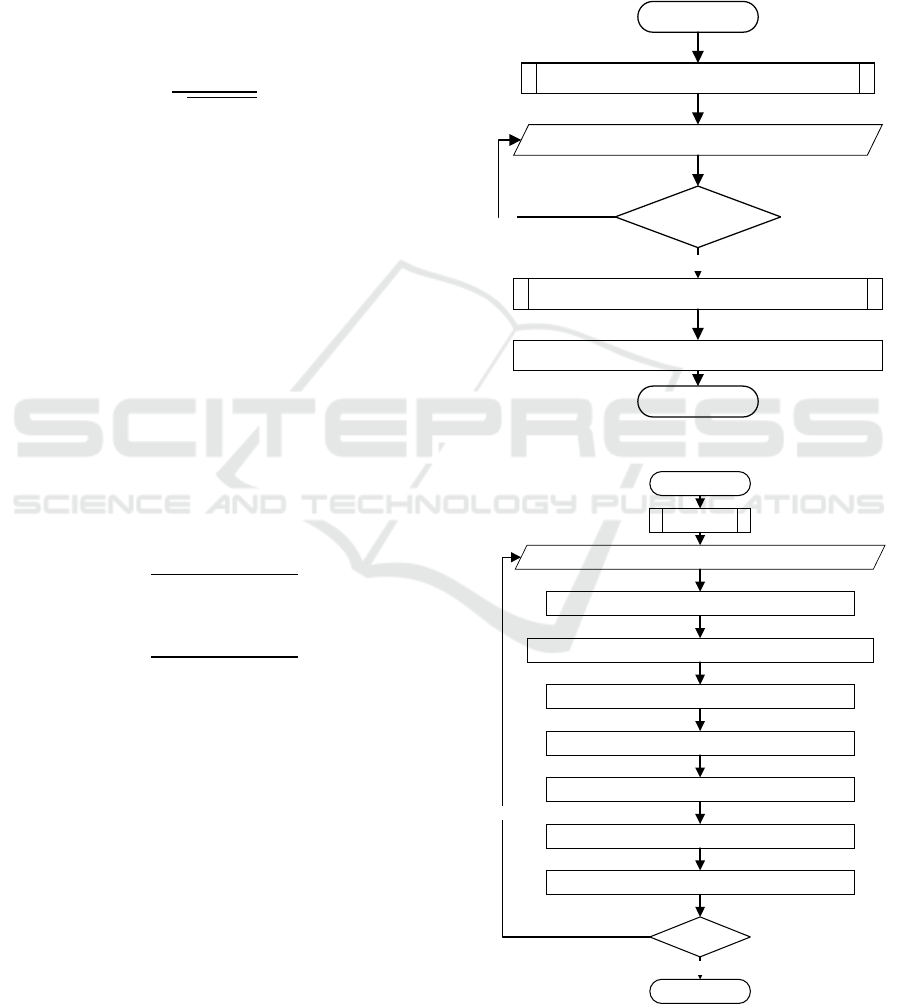
2.3 Combining AHP and TOPSIS
The combination of AHP and TOPSIS in this study is
expected to give the best result of DSS. The AHP
suits for determining the weight of criteria, while
TOPSIS will deal with the benefit and cost criteria to
rank the alternatives. Combination of these two
methods is shown in Figure 1. Before conducting the
TOPSIS, it is need to read all the alternatives and the
value/score of each alternative in each criterion. The
closeness score resulted by the TOPSIS method will
be sorted descending to rank the alternatives.
The flowchart of AHP step is shown in Figure 2.
The first step is to read all the priority of each
criterion compare to other criteria. The value of
Start
Calculate the criteria weight using AHP
Read alternative
More alternative?
Calculate the closeness score using TOPSIS
Sort the alternatives based on the closeness score
Finish
yes
no
Figure 1: The combination of AHP and TOPSIS.
Start
Finish
Build the comparison matrix
Build normalized comparison matrix based on Equation 1
Calculate the row-sum(v) using Equation 2
Calculate the criteria weight (W) using Equation 3
Calculate eigen value (lamda) using Equation 4
Calculate CI value using Equation 5
Calculate CR value using Equation 6
CR < 0.1?
yes
no
Read the priority comparison of criteria
AHP
Figure 2: The flowchart of AHP.
Decision Support System for Exported Grade Coffee Selection using AHP and TOPSIS
49
priority using Saaty scale (1-9). The decision maker
only needs to input the upper triangle of comparison
matrix, and the algorithm will automatically calculate
the rest. After the comparison matrix build, the next
step is followed all the step describe in the previous
section.
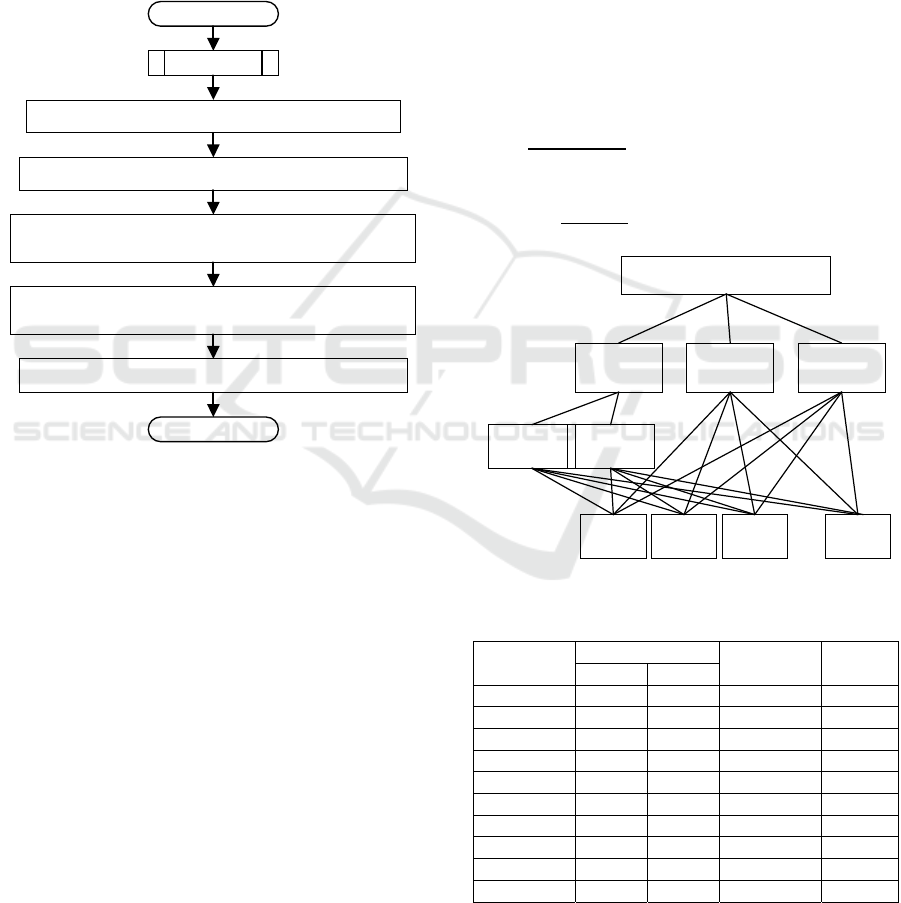
All of the steps in TOPSIS are shown in Figure 3.
Using criteria weight from AHP step, the normalized
weighted matrix was built. This matrix was used to
calculate the positive and negative ideal solution in
order to find the closeness score of each alternative.
Start
Finish
Build normalized decision matrix using Equation 7
Build normalized weighted matrix using Equation 8
Calculate positive and negative ideal solution using
Equation 9 and 10
Calculate the distance to ideal positive and negative
solution using Equation 11 and 12
Calculate closeness score using Equation 13
TOPSIS
Figure 3: The flowchart of TOPSIS.
3 RESULTS
3.1 Criteria and Data
All criteria used in this study was adapted from
Indonesia National Standard SNI 01-2907-2008
about coffee bean. The criteria consist of benefit
criteria: general criteria (C1), bean size (C2) and cost
criteria: grade (C3). The C1 has two sub criteria:
water content (G1) and dirt level/waste (G2). The
water content of coffee must be no more than 12.5%,
while the waste of coffee has to be less than 0.5%.
Water level was determined by calculating the
reduction in coffee weight before and after the drying
process in the oven. Waste was the percentage of
placenta, attached seeds (clusters), seed fragments,
skin fragments, flat seeds and twigs found in 1000
grams of coffee sample. The bean size was classified
in three category namely big (≥ 7.5 mm), medium (6.5
mm – 7.5 mm), small (5.5 mm – 6.5 mm). The grade
of coffee was determined by counting the imperfect
bean in 300 grams of coffee. This study used ten
alternatives. Table value of each alternative in every
criterion is shown in Table 1. Figure 4 shows the
multilevel tree of the coffee selection.
This study used ten alternatives for simulating the
algorithm performance. All of the alternatives was
wet processing Robusta from varied suppliers. Score
of alternatives in G1 and G2 will be normalized using
Equation 14 and 15. Table 2 shows the normalized
result and the final score of C1. Because the G1 and
G2 have the equal weight, so the C1 score is the
average of both G1 and G2. The value of each
criterion will be converted into scale of 1 to 5 and
shown in Table 3.
𝑥=
100 ,𝑖𝑓𝑤𝑎𝑡𝑒𝑟𝑐𝑜𝑛𝑡𝑒𝑛𝑡≤1%
1
𝑤𝑎𝑡𝑒
𝑟
𝑐𝑜𝑛𝑡𝑒𝑛𝑡
∗ 100,𝑖𝑓𝑤𝑎𝑡𝑒𝑟𝑐𝑜𝑛𝑡𝑒𝑛𝑡>1%
(14)
𝑥=
100 ,𝑖𝑓𝑑𝑖𝑟𝑡𝑙𝑒𝑣𝑒𝑙≤0.1%
1
𝑑𝑖
𝑟
𝑡
𝑙𝑒𝑣𝑒𝑙
∗ 100,𝑖𝑓 𝑑𝑖𝑟𝑡 𝑙𝑒𝑣𝑒𝑙>0.1%
(15)
Goal : Select coffee to be
exported
C1 : General
criteria
C2 : bean
size
C3 : grade
Alt 1 Alt 2 Alt 3 Alt n
Criteria
Alternatives
G1 : water
content
G2 : dirt
level/waste
Figure 4: The multilevel tree of coffee selection.
Table 1: Data of Alternatives.
Alternative
C1
C2 C3
G1(%) G2(%)
Alt 1 10 0.32 Big 22
Alt 2 2 0.21 Bi
g
201
Alt 3 5 0.48 Medium 20
Alt 4 7 0.12 Bi
g
57
Alt 5 1 0.21 Big 8
Alt 6 1 0.25 Mediu
m
120
Alt 7 3 0.39 Mediu
m
19
Alt 8 4 0.10 Bi
g
45
Alt 9 8 0.10 Bi
g
39
Alt 10 11 0.18 Mediu
m
189
iCAST-ES 2021 - International Conference on Applied Science and Technology on Engineering Science
50
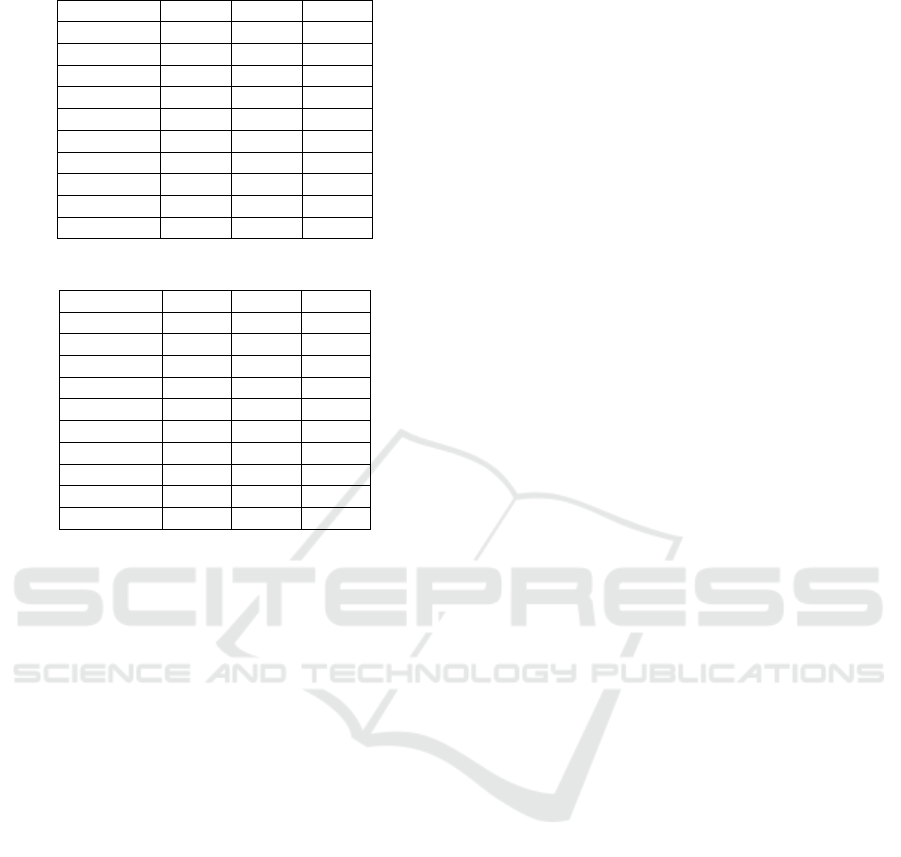
Table 2: The final score of C1.
Alternative G1 G2 C1
Alt 1 10.00 31.25 20.63
Alt 2 50.00 47.62 48.81
Alt 3 20.00 20.83 20.42
Alt 4 14.29 83.33 48.81
Alt 5 100.00 47.62 73.81
Alt 6 100.00 40.00 70.00
Alt 7 33.33 25.64 29.49
Alt 8 25.00 100.00 62.50
Alt 9 12.50 100.00 56.25
Alt 10 9.09 55.56 32.32
Table 3: The criteria conversion value.
Alternative C1 C2 C3
Alt 1 2 5 1
Alt 2 3 5 5
Alt 3 2 3 1
Alt 4 3 5 3
Alt 5 4 5 1
Alt 6 4 3 4
Alt 7 2 3 1
Alt 8 4 5 3
Alt 9 4 5 2
Alt 10 2 3 5
3.2 Criteria Weight using AHP
The AHP calculate the criteria weight by build the
comparison matrix A. First of all, user have to input
the priority of one criterion compare to others using
Saaty scale. Figure 5 shows the comparison matrix of
each criterion. Based on Saaty scale, the criteria C1 is
almost absolutely important than C2 as the value of
A(1,2) = 8. On the other hand, the value of element
A(2,1) will be 1/8.
The normalized comparison matrix B will be build
using Equation 1. The matrix B is shown in Figure 6.
The value of each element is equals to the value of the
corresponding element in matrix A divided by the
sum of corresponding column. For example:
B(1,1) = A(1,1)/ (A(1,1) + A(1,2) + A(1,3))
B(1,1) = 1/ (1 + 1/8 + 1/5) = 0.75
After the normalizing the comparison matrix, the
row-sum (V) will be calculated using Equation 2. The
matrix V is shown in Figure 7. The element of V(1,1)
equals to the sum of B(1,1), B(1,2) and B(1,3), so
B(1,1) = 0.75 + 0.67 + 0.79 = 2.21.
The weight of each criteria W can be calculated
from V using Equation 3. The weight of criteria is
calculated by dividing the corresponding in V by the
sum of all V element. The weight of each criteria is
shown in Figure 8.
One of the advantages of AHP is the guarantee of
consistency input from decision maker. To ensure
that the priority inputs is consistent, then the
consistency ratio (CR) will be calculated. The first
step to get CR is to calculate the λ
max
based on
Equation 4. The matrix X consist of element from
matrix V divided by the corresponding W multiply by
the number of alternatives. For example X(1,1) =
V(1,1)/(W(1,1)*n) = 2.21/(0.74*3) = 1.032. The
matrix X is shown in Figure 9. The value of λ
max
=
1.032 + 1.003 + 1.009 = 3.045
𝐴=
𝐶1
𝐶2 𝐶3
𝐶1
𝐶2
𝐶3
18
5
1
8
1
1
5
3
1
3
1
Figure 5: Comparison matrix of each criterion.
𝐵=
𝐶1
𝐶2 𝐶3
𝐶1
𝐶2
𝐶3
0.75 0.67
0.79
0.09 0.08
0.15 0.25
0.05
0.16
Figure 6: Normalized comparison matrix.
𝑉=
𝐶1
𝐶2
𝐶3
2.21
0.23
0.56
Figure 7: Normalized comparison matrix.
𝑊=
𝐶1
𝐶2
𝐶3
0.74
0.08
0.19
Figure 8: Weight matrix.
𝑋=
𝐶1
𝐶2
𝐶3
1.032
1.003
1.009
Figure 9: Matrix X.
The next step is to calculate the value of CI based on
Equation 5.
CI = (λ
max
-n)/(n-1)
CI = (3.045 -3)/(3-1)
CI = 0.02
The last step is to calculate the value of CR using
Equation 6. The value of RI for n = 3 is 0.58, so the
CR is:
CR = CI/RI
CR = 0.02/0.58 = 0.04
Because CR is below 0.1, then the input of
comparison matrix is considered to be consistent and
the weight W can be used for the next step.
Decision Support System for Exported Grade Coffee Selection using AHP and TOPSIS
51
3.3 Alternative Rank using TOPSIS
The first step in TOPSIS is to build the normalized
decision matrix R. To make it easy to read, the matrix
was described as a table. The normalized decision
matrix was build using Equation 7. The matrix R was
built from the Table 3. To build matrix R, there were
some steps as follow:
1. Square all the element in Table 3;
2. Summing all the element in column and store
the value as s
i
;
3. Calculate the square root of s
i
and store it as t
i
;
4. The value of R is equals to the corresponding
element in Table 3 divided by t
i
in
corresponding column (in the same criterion).
The next step is to build the weighted normalized
matrix (V) based on Equation 8. The value of elemen
V shown in Table 4 is calculated from the
multiplication of the corresponding element in matrix
R and the corresponding weight of criteria (w
i
) from
the Figure 8.
Positive (A
+
) and negative (A
-
) ideal solution is
calculated using Equation 9 and 10 respectively.
Because C1 and C2 are benefit criteria, then the
positive ideal solution will be the maximum value of
all alternative in the corresponding criterion from
matrix V (Table 4), while for C3 as the cost criteria,
the positive ideal solution is the minimum value. The
value of A
-
is the vice versa. Figure 10 show the value
of A
+
and A
-
.
Table 4: The weighted normalized matrix.
Alternative C1 C2 C3
Alt 1 0.298 0.141 0.019
Alt 2 0.670 0.141 0.486
Alt 3 0.298 0.051 0.019
Alt 4 0.670 0.141 0.175
Alt 5 1.191 0.141 0.019
Alt 6 1.191 0.051 0.311
Alt 7 0.298 0.051 0.019
Alt 8 1.191 0.141 0.175
Alt 9 1.191 0.141 0.078
Alt 10 0.298 0.051 0.486
Figure 10: Positive and negative ideal solution.
Table 5: The distance to positive and negative ideal
solution.
Alternative D
+
D
-
Alt 1 0.89332 0.89332
Alt 2 0.69914 0.69914
Alt 3 0.89785 0.89785
Alt 4 0.54377 0.54377
Alt 5 0.00000 0.00000
Alt 6 0.30492 0.30492
Alt 7 0.89785 0.89785
Alt 8 0.15537 0.15537
Alt 9 0.05826 0.05826
Alt 10 1.01163 1.01163
Table 6: The ranking and closeness score.
Rankin
g
Alternative Closeness
1 Alt 5 1.00
2 Alt 9 0.94
3 Alt 8 0.86
4 Alt 6 0.75
5 Alt 4 0.48
6 Alt 2 0.35
7 Alt 1 0.35
8 Alt 3 0.34
9 Alt 7 0.34
10 Alt 10 0.00
The distance of the alternative in to the A
+
(D
+
) and
A
-
(D
-
) is calculated using Equation 11 and 12
respectively and shown in Table 5. The step to
calculate the distance is as follow:
1. Substract the value of matrix v
i,j
in Table 4 by
the corresponding a
+
j
for positive distance a
-
j
for negative one, then store the value in e
i,j
;
2. Square the value of e
i,j
;
3. The distance of alternative Alt
i
from the A
+
is
the square root of the sum all from the e
i,j
2
in
the corresponding alternative.
The last step is to calculate the closeness score based
on Equation 13. The ranking of alternatives and
closeness score is shown in Table 6.
3.4 Discussion
The analysis is done by building a chart of the
closeness score and a chart of the value of each
alternative on the criteria. The chart of the closeness
score in Figure 11 shows that Alternative 5 be the 1
st
rank, followed by Alternatives 9 and 8 respectively.
The chart in Figure 12 show that the four alternatives
have the same score on criteria C1 and C2. For the
score on criteria C1, the three alternatives have the
highest score compared to other alternatives (except
for Alternative 6). Because the C1 criterion has a
much higher weight than the other criteria, it is make
iCAST-ES 2021 - International Conference on Applied Science and Technology on Engineering Science
52
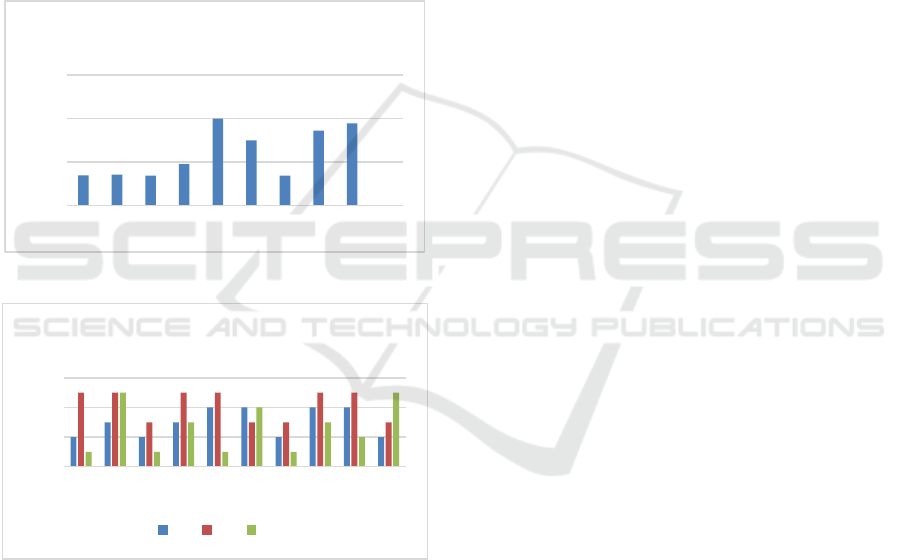
sense that alternatives with a high score in C1 will
have a greater chance of to be in the top rank. C3
weight is higher than C2, although not as high as C1,
but this will affect rankings. Because of the same
score in C1 and C2, then the score in C3 will affect
the ranking order of the three alternatives. In this case
Alternative 5 becomes the 1
st
rank because the value
of C3 is the lowest, then followed by Alternative 9
and finally Alternative 8. The value of C3 is cost, so
the bigger the value, the lower the ranking.
Alternative 6 becomes the 4
th
rank, although its C1
score is the same as the three other alternatives in the
top position, but the high C3 and lower C2 scores
make Alternative 6 rank below the other three
alternatives.
Figure 11: The closeness chart.
Figure 12: The score of all alternatives in each criterion.
Although C1 has a much higher weight than the
other two criteria, it is clear that ranking is not always
the same as the value of C1. For example, the score
of C1 for Alternative 2 is one level greater than
Alternative 1, but it turns out that Alternative 2 and
Alternative 1 have the same closeness value. This
shows that the other two criteria, C2 and C3 still play
a role in determining the ranking, although they are
not as strong as C1. Alternative 2 has a much higher
C3 value than Alternative 1.
From the chart that has been described, it can be
seen that the C1 criterion has a significant weight
compared to the other two criteria in determining the
ranking of an alternative. However, the other two
criteria still have a contribute in determining the
ranking, so that the ranking is not always in line with
the C1 criteria.
4 CONCLUSIONS
Decision support systems (DSS) can provide
recommendations for decision makers according to
their preferences against existing criteria. This study
aims to build a DSS for the selection of export coffee.
The method used in this research was AHP and
TOPSIS. AHP was used to determine the weight of
the criteria based on input in the form of priority by
users following the Saaty scale. The calculated
weights by AHP were used for rank all alternatives
using TOPSIS. TOPSIS resulted the closeness score
that guarantee the alternative have closest distance to
the positive ideal solution and the furthest from the
negative ideal solution. The combination of these two
methods has succeeded in building DSS and
providing recommendations in the form of ranking
alternatives according to the preferences of decision
makers and the value of each alternative. The best
closeness score was Alternative 5 with the final score
1. This final score is achieved because the value of C1
as the most significant benefit criteria was high and
the criteria C3 as the cost criteria was low. System
development still has to be done. System testing
needs to be done by making detailed and clear test
scenarios, so that the tester will be able to test the DSS
correctly and structured.
ACKNOWLEDGEMENTS
We sincerely thank to the Politeknik Negeri Bali for
the research fund through the agreement with.
REFERENCES
Aktar Demirtas, E., Buruk, Y., & Sağır, M. (2015). a Multi-
Criteria Job Evaluation Method for a State Bank.
International Journal of the Analytic Hierarchy
Process, 7(2). https://doi.org/10.13033/ijahp.v7i2.264
Bagi,Y. S., Suyono, S. & Tomatala, M. F. (2020). Decision
Support System for High Achieving Students Selection
Using AHP and TOPSIS. 2020 2nd International
Conference on Cybernetics and Intelligent System
0,00
0,50
1,00
1,50
A1 A2 A3 A4 A5 A6 A7 A8 A9 A10
Closeness
0,00
2,00
4,00
6,00
A1 A2 A3 A4 A5 A6 A7 A8 A9 A10
Alternative Score
C1 C2 C3
Decision Support System for Exported Grade Coffee Selection using AHP and TOPSIS
53

(ICORIS), 1-5, https://doi:10.1109/ICORIS50180
.2020.9320823
Belaid, A., & Razmak, J. (2013). Multi-Criteria Decision
Support Systems: A glorious history and a promising
future C3 - 2013 5th International Conference on
Modeling, Simulation and Applied Optimization,
ICMSAO 2013. https://www.scopus.com/inward/rec
ord.uri?eid=2-s2.0-84881409317&doi=10.1109%2FI
CMSAO.2013.6552678&partnerID=40&md5=651660
7cf04f36dce0d8f4efb62799cd
Ciptayani, P. I., Saptarini, N. G. A. P. H., Santiary, P. A.
W., & Astawa, I. N. G. A. (2018). Decision Support
System for Tourist Destination using the Combination
of AHP and SAW. Proceedings - 2nd East Indonesia
Conference on Computer and Information Technology:
Internet of Things for Industry, EIConCIT 2018, 271–
275. https://doi.org/10.1109/EIConCIT.2018.8878638
Franek, J., & Kresta, A. (2014). Judgment Scales and
Consistency Measure in AHP. Procedia Economics and
Finance, 12(March), 164–173. https://doi.org/10.101
6/s2212-5671(14)00332-3
Hutasuhut, D. I. G., Adhar, D., Alfma, O., Nasution, A. B.,
& Ginting, E. (2019). Decision Support System for
Finding the Best Restaurant Using AHP Method. 2018
6th International Conference on Cyber and IT Service
Management, CITSM 2018, Citsm, 6–10.
https://doi.org/10.1109/CITSM.2018.8674269
ICO, I. C. O. (2021). Coffee year production by country.
Data, May 2021(August), 7–9.
Irvanizam, I. (2017). Multiple attribute decision making
with simple additive weighting approach for selecting
the scholarship recipients at Syiah Kuala university.
Proceedings - 2017 International Con. on Electrical
Engineering and Informatics: Advancing Knowledge,
Research, and Technology for Humanity, ICELTICs
2017, 2018-January(October 2017), 245–250.
https://doi.org/10.1109/ICELTICS.2017.8253272
Iswari, V., Arini, F., & Muslim, M. (2019). Decision
Support System for the Selection of Outstanding
Students Using the AHP-TOPSIS Combination Method.
Lontar Komputer: Jurnal Ilmiah Teknologi Informasi,
40-48. https://doi:10.24843/LKJITI.2019.v10.i01.p05
Liu, H. & Qi,F. (2017). Analytic hierarchy process based
judgment model of highly cited papers in journal. IEEE
2nd International Conference on Big Data Analysis
(ICBDA) 2017, 649-652, https://doi.org/10.1109/ICB
DA.2017.8078716.
Madi, E. N., Garibaldi, J. M., & Wagner, C. (2016). An
exploration of issues and limitations in current methods
of topsis and fuzzy TOPSIS. 2016 IEEE International
Conference on Fuzzy Systems, FUZZ-IEEE 2016,
2098–2105. https://doi.org/10.1109/FUZZ-IEEE.2016.
7737950
Neves, M. F., Trombin, V. G., Lopes, F. F., Kalaki, R., &
Milan, P. (2011). World consumption of fruit juices,
nectars, and still drinks. The Orange Juice Business,
119–119.https://doi.org/10.3920/978-90-8686-739-4_32
Panda, M., & Jagadev, A. K. (2018). TOPSIS in Multi-
Criteria Decision Making: A Survey. Proceedings - 2nd
International Conference on Data Science and
Business Analytics, ICDSBA 2018, 51–54.
https://doi.org/10.1109/ICDSBA.2018.00017
Pavić, Z., & Novoselac, V. (2013). Notes on TOPSIS
Method. International Journal of Research in
Engineering and Science, 1(2), 5–12.
https://www.researchgate.net/publication/285886027_
Notes_on_TOPSIS_Method%0Awww.ijres.org
Pujadi, T., Fathurrozi, A., & Theresia, S. (2017). Using
Analytical Hierarchy Process for the decision support
system in teacher placement. Proceedings of 2016
International Conference on Information Management
and Technology, ICIMTech 2016, November, 182–187.
https://doi.org/10.1109/ICIMTech.2016.7930326
Qing, K. (2011). A Research on the Entrepreneurial
Opportunity Identification Based on the AHP-TOPSIS
Method. Proceedings of the 8Th International
Conference on Innovation and Management, 650–655.
Retrialisca, F., Effendi, Y. A., & Nuzulita, N. (2019).
Decision Support System and Recommendation on
SBMPTN Try-Out with Analytic Hierarchy Process
(AHP). Proceedings - 2019 International Conference
on Computer Science, Information Technology, and
Electrical Engineering, ICOMITEE 2019, 1, 169–174.
https://doi.org/10.1109/ICOMITEE.2019.8921040
Taillandier, P., Stinckwich, S., Taillandier, P., Stinckwich,
S., Taillandier, P., & Stinckwich, S. (2013). Using the
PROMETHEE multi-criteria decision making method
to define new exploration strategies for rescue robots
To cite this version : Using the PROMETHEE Multi-
Criteria Decision Making Method to Define New
Exploration Strategies for Rescue Robots. 321–326.
Tanjung, D. Y. H., & Adawiyah, R. (2019). Optimizing
Selection of Decision Support System with Fuzzy
Simple Additive Weighting. 2018 6th International
Conference on Cyber and IT Service Management,
CITSM 2018, Citsm, 1–4. https://doi.org/10.1109
/CITSM.2018.8674360
iCAST-ES 2021 - International Conference on Applied Science and Technology on Engineering Science
54
