
The Effect of Rewards and Punishment, Job Rotation, Employee
Engagement and Career Development on Employee Performance at
PT XYZ
Ruri Tantyyana Pardosi
1
a
, Nur Rahmah Andayani
1
and Patyot Dechsiri
2
1
Applied Business Administration, Politeknik Negeri Batam, Jl. Ahmad Yani, Batam Centre 29461, Indonesia
2
MaejoUniversity,63 Sansai-Phrao Road, Nongharn, Sansai District, Chiang Mai, 50290 Thailand
Keywords: Reward & Punishment, Job Rotation, Employee Engagement, Career Development, Performance.
Abstract: This research aims to find out the effect of working conditions on performance of employee at PT XYZ.
Respondents as well as the population studied are employees of PT XYZ, with a total sample of 168
employees. The sampling technique used by the researcher is disproportionate stratified random sampling,
using the Slovin equation. The data collection technique in this study used a questionnaire with Google Form
media. The data analysis method used by the researcher is quantitative associative analysis using Multiple
Linear Regression, Classical Assumption Test, t-test, and F-test with a significance level of 0.05 and a
coefficient of determination. The results of this study are: Rewards and punishment, job rotation, employee
engagement, career development simultaneously have an effect on employee performance.
1 INTRODUCTION
1.1 Background
For employees who have achievements in the
company, it is necessary to give awards to continue to
motivate their performance. Tohardi (2002),
explained that the award is a reward given so that
employees are motivated to increase their
productivity. With this award, it is hoped that
employees can feel valued by the company for their
performance results, employees will also be
motivated to work harder and increase their
productivity. In addition to awards, companies must
also act decisively by imposing punishment on
employees violate the rules or commit negligence at
work. Employees who are negligent or lazy to work
must be given strict warnings/punishment, so as not
to repeat the mistake again. With appropriate
punishment, it is hoped that it can be a warning to
improve performance and reduce the possibility of the
employee repeating his mistake again. If employees
continue to be lazy to work, repeat negligence, it will
have a bad impact on the company's productivity,
causing losses.
a
https://orcid.org/0000-0002-3417-5584
When working in a company, boredom often
arises, even boredom experienced by employees,
especially with working periods that are too long in a
position. Therefore, it is necessary to implement a
work rotation system (transfer), at the right time and
for employees who are in accordance with certain job
desks. In Robbins (2006), job rotation is an
alternative to reduce the level of boredom and
repetitive routines. Therefore, the application of the
work rotation system is one of the breakthroughs that
should be implemented, to reduce boredom at work.
It is also hoped that after the implementation of this
work rotation system, it can increase the knowledge
and work experience of employees, which will also
hone their skills so as to provide the best performance
for the company.
According to Siddhanta & Roy (2010), employee
engagement can create success for a company,
because it can bring the positive effect on employee
performance. With the implementation of the
employee engagement program in the company, it is
expected to make employees feel bound to the
company environment. One example of
implementing employee engagement programs, for
example, is holding gatherings between employees,
Tantyyana Pardosi, R., Rahmah Andayani, N. and Dechsiri, P.
The Effect of Rewards and Punishment, Job Rotation, Employee Engagement and Career Development on Employee Performance at PT XYZ.
DOI: 10.5220/0010934200003255
In Proceedings of the 3rd International Conference on Applied Economics and Social Science (ICAESS 2021), pages 207-212
ISBN: 978-989-758-605-7
Copyright
c
2022 by SCITEPRESS – Science and Technology Publications, Lda. All rights reserved
207
so as to build a sense of kinship with one another. And
if good relations between employees in the company
have been established, then this will create good work
collaboration which will certainly have a positive
impact on employee performance.
Another thing that can motivate employees is the
company's career development program. According
to Nawawi (2005), the application of career
development is an encouragement (motivation) for
employees to move forward in a company
environment, also more motivated to excel so as to
improve their performance. Career development is
something that should not be ignored, because the
career development program also depicts the
development of an organization or company.
Therefore, career development must be a serious
concern for company management, for the sake of
mutual interest and progress.
Good performance from employees is the key to
achieving high productivity in every company. If a
work target is completed on time or does not exceed
the set time limit, then the employee's performance is
said to be high (Nawawi, 2006). Employee
performance also reflects the ability of the company's
management, in managing and allocating human
resources in the company. So that this aspect of
employee performance needs to be analyzed and
developed according to the needs of the company.
Optimizing employee performance will keep the
company moving forward, and of course will have a
positive impact on the welfare of the company's
employees themselves.
Figure 1: Framework.
1.2 Methods
The population is the employees from production
division of PT XYZ, with the total sample 168
employees. The sampling technique is
disproportionate stratified random sampling, because
the population is stratified but not proportional. The
population in this study has 3 organizational units,
namely QA, OP, and EA. And in each of these
organizational units has a different number of
employees. From each organizational unit, a sample
will be taken according to the population comparison.
The number of samples obtained by the following
calculations:
Table 1: Sample Calculation.
Organizational
Unit
Employee
Population
Sample
QA Technician
0
-
Specialist
1
𝑛=
1
288
× 168
=0,58=𝟏
Operator
17
𝑛=
17
288
× 168
=9,91=𝟏𝟎
OP Technician
55
𝑛=
55
288
× 168
= 32,08 = 𝟑𝟐
Specialist
13
𝑛=
13
288
× 168
=7,58=𝟖
Operator
194
𝑛=
194
288
× 168
= 113,1 = 𝟏𝟏𝟑
EA Technician
1
𝑛=
1
288
× 168
=0,58=𝟏
Specialist
3
𝑛=
3
288
× 168
=1,75=𝟏
Operator
4
𝑛=
4
288
× 168
=2,33=𝟐
TOTAL 288 168
In answering the questions on the questionnaire using
a Likert scale, with details of the value scale as
follows:
Strongly Disagree : 1
Disagree : 2
Agree : 3
Strongly Agree : 4
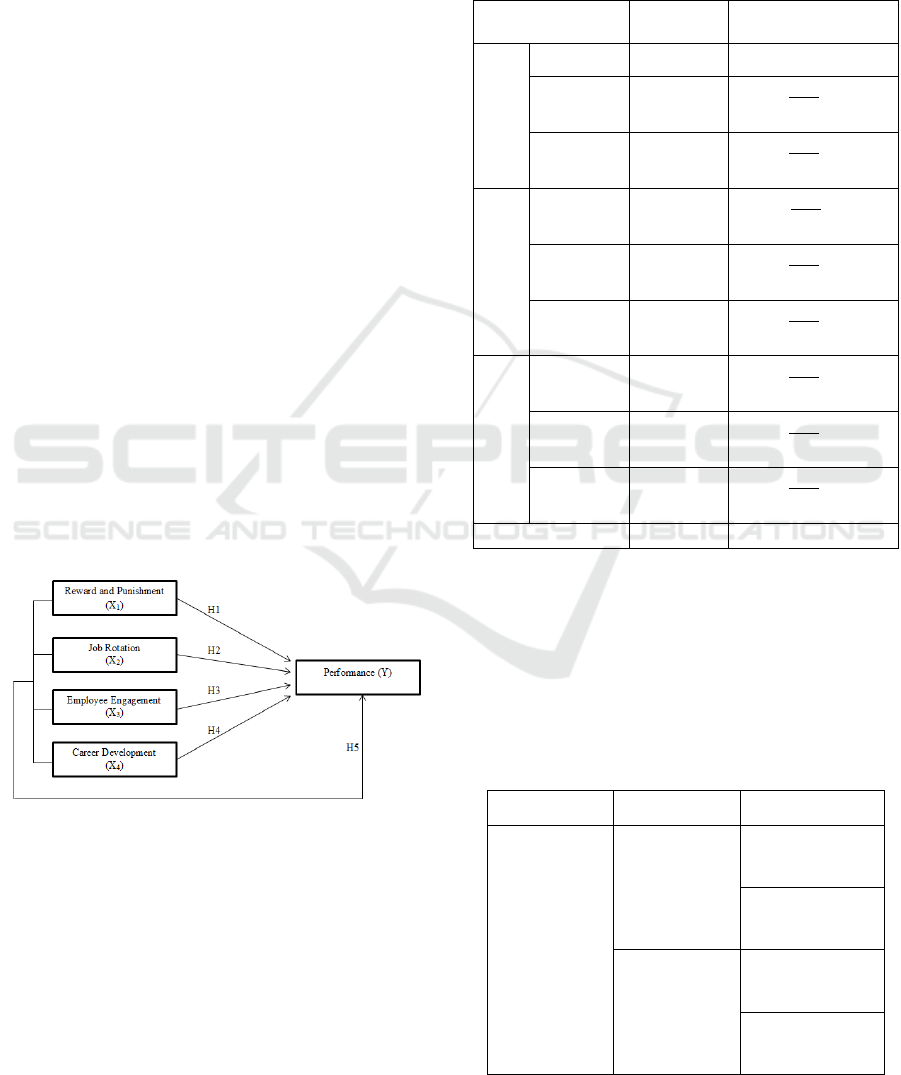
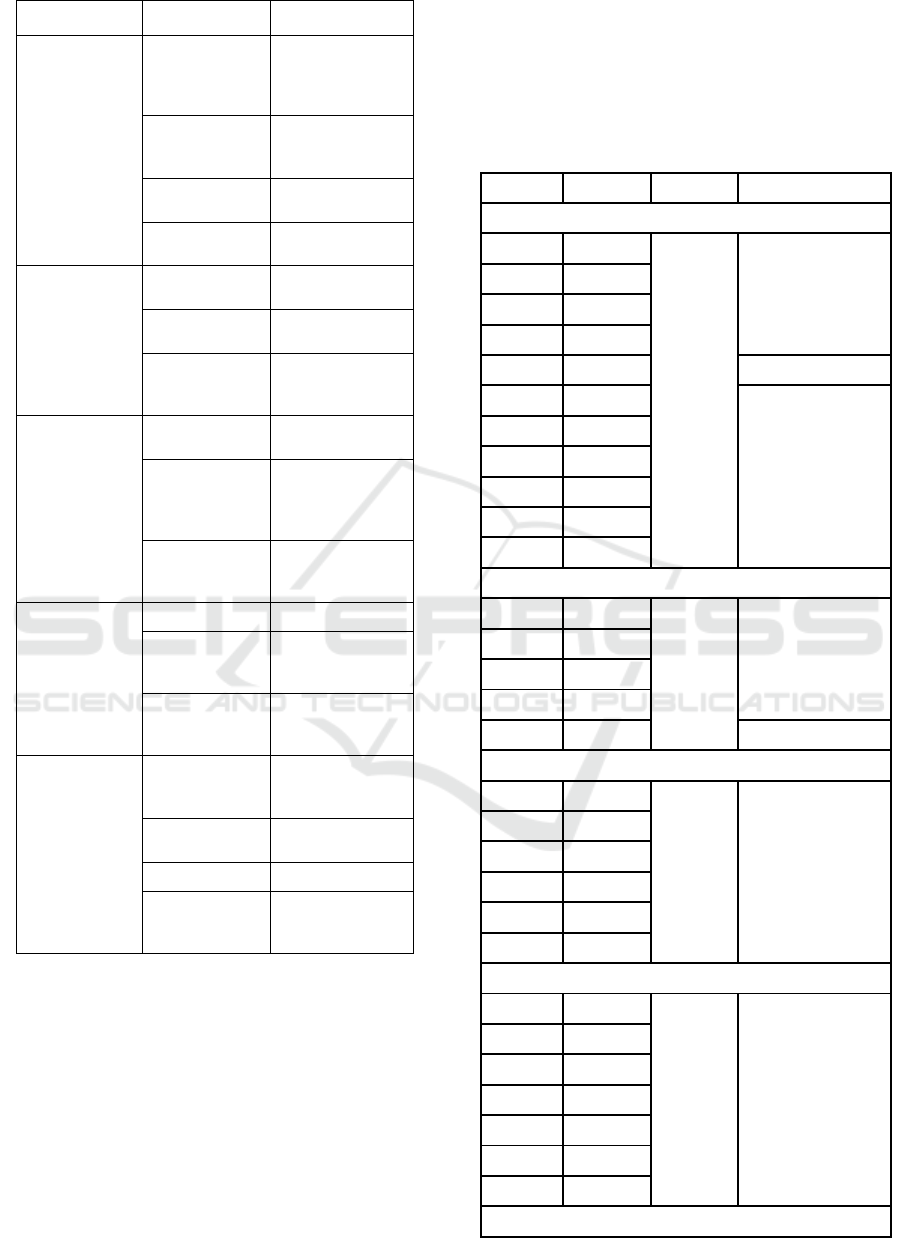
Table 2: Variable Operational.
Variable
Dimension Indicator
Rewards &
Punishment (X
1
)
Extrinsic Reward
Financial Rewards
(Wages,
Compensation)
Non-Financial
Awards (Promotion,
status/recognition)
Intrinsic Reward
Completion, namely
the ability to
complete work
Achievement, i.e.
results in achieving
work targets/goals
ICAESS 2021 - The International Conference on Applied Economics and Social Science
208
Variable
Dimension Indicator
Personal growth,
namely the
development of self-
ability
Light Punishment
Light
reprima
nd
Medium
Punishment
Warning Letter
1&2
Heavy Punishment
Warning Letter 3
or termination
Job Rotation (X
2
)
Saturation
Reducing boredom /
boredom at work
Motivation
Working with
new people
Ability and
knowledge
Utilization of job
rotation to increase
skills and knowledge
Employee
Engagement (X
3
)
Spirit
Employee gathering
program
Dedication
Commitment to the
company, work
productivity,
innovation
Absorption
Work environment,
interaction between
employees
Career
Development (X
4
)
Work performance Promotion
Organizational
Loyalty
Career Planning,
monitoring work
results
Opportunity to
grow
Training (training),
opportunity to
develop potential
Peformance (Y)
Quality
Work errors,
Correction of work
results
Quantity
Work weight and
target
Punctuality Timely attendance
Effectiveness
Independence in
work, utilization of
company facilities
2
RESULTS AND DISCUSSION
2.1
Validity Test
In this validity test, 30 respondents were used to be
tested. The questionnaire item is said to be valid, if it
has an r-count value greater than or equal to r-table
(N=30; equal to 0.361 based on the statistical book
table r) with a significance value of 5%. If the value
of r-count is less than r-table, then the questionnaire
item is invalid. And from the validity test of this
study, there are 3 invalid questions, so the total
measuring instrument that can be used is 34 valid
items. The following table is the results of validity
test:
Table 3: Validity Test Results.
Item r-count r-table Information
Rewards & Punishment (X
1
)
1 0.742
0,361
Valid
2 0.804
3 0.804
4 0.757
5 0.214 Invalid
6 0.572
Valid
7 0.638
8 0.491
9 0.522
10 0.776
11 0.668
Jobs Rotation (X
2
)
1 0.668
0,361
Valid
2 0.694
3 0.763
4 0.788
5 0.270 Invalid
Employee Engagement (X
3
)
1 0.817
0,361 Valid
2 0.520
3 0.669
4 0.778
5 0.414
6 0.759
Career Development (X
4
)
1 0.570
0,361 Valid
2 0.728
3 0.661
4 0.839
5 0.480
6 0.846
7 0.535
Performance (X
5
)
The Effect of Rewards and Punishment, Job Rotation, Employee Engagement and Career Development on Employee Performance at PT
XYZ
209
Item r-count r-table Information
1 0.916
0,361
Valid
2
-
0.238
Invalid
3 0.700
Valid
4 0.622
5 0.738
6 0.730
7 0.517
8 0.805
2.2 Realiability Test
This test used Cronbach's Alpha, if the Cronbach's
Alpha coefficient of an instrument is > 0.60, then the
instrument in the questionnaire is reliable. The results
of Cronbach's Alpha coefficient values in table 4,
show that all variables have Cronbach's Alpha
coefficient values> 0.60. Therefore, it is concluded
that all instruments in this study have a good level of
reliability.
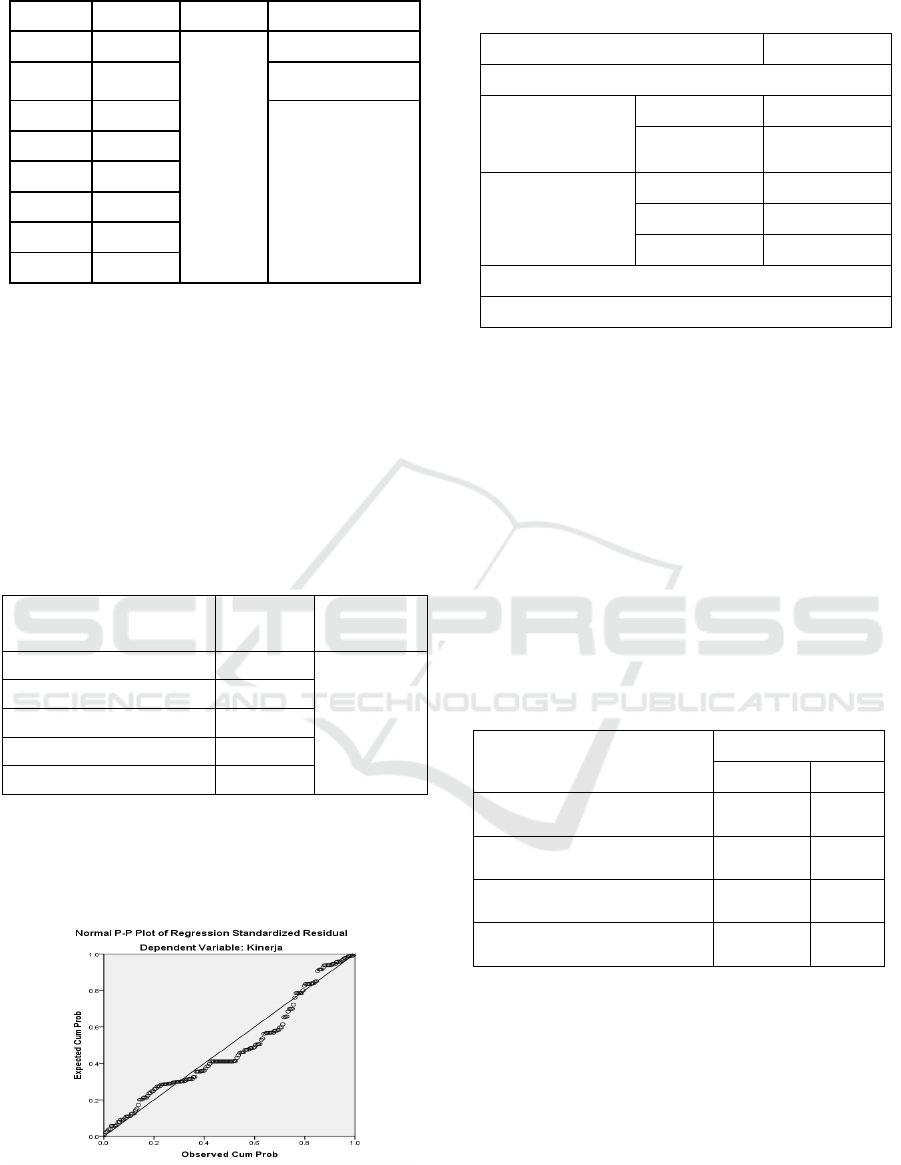
Table 4: Reliability Test Result.
Variable Cronbach’s
Alpha
Information
Rewards & Punishment (X
1
) 0,872
Reliable
Jobs Rotation (X
2
) 0,782
Employee Engagement (X
3
) 0,754
Career Development (X
4
) 0,787
Performance (X
5
) 0,853
2.3 Normality Test
Normality test is presented with P-Plot graph analysis
and Kolmogorov-Smirnov test as follows:
Figure 2: P-Plot Chart.
Table 5: Kolmogorov-Smirnov Test.
Residual
N 168
Normal
Parameters
Mean 0,0000
Std.
Deviation
127,135
Most Extreme
Differences
Absolute 0,104
Positive 0,104
Negative -0,065
Kolmogorov-Smirnov Z 1,346
Asymp. Sig. (2-tailed) 0,054
In the P-Plot graph, it shows that the distribution of
the data has followed the normal distribution pattern.
And also the results of the Kolmogorov-Smirnov
Test, namely the significance value is greater than
0.05, namely Kolmogorov Smirnov 1.346 > 0.05 and
the Asymp sign value is greater than 0.05, namely
0.054 > 0.05. So, from the result, the data can be
concluded has been normally distributed.
2.4 Multicollinearity Test
This test is intended to find a correlation on an
independent variable in the regression model. The
result of multicollinearity test in the following table:
Table 6: Multicollinearity Test.
Variable
Collinearity Statistics
Tolerance VIF
Rewards & Punishment (X
1
)
0,882
1,1
34
Jobs Rotation (X
2
)
0,884
1,1
31
Employee Engagement (X
3
)
0,875
1,1
42
Career Development (X
4
)
0,881
1,1
35
Table 6 shows that all independent variables have
a tolerance value of > 0.1 and VIF < 10. It can be seen
from the reward and punishment variable that the
tolerance value is 0.882 > 0.1 and VIF 1.134 < 10.
The job rotation variable has a tolerance value of
0.884 > 0.1 and VIF 1.131 < 10. Employee
engagement variable has a tolerance value of 0.875 >
0.1 and VIF 1.142 < 10. And career development
variable has a tolerance value of 0.881 > 0.1 and VIF
1.135 < 10. This means that all independent variables
ICAESS 2021 - The International Conference on Applied Economics and Social Science
210
there are no symptoms of multicollinearity (non-
multicollinearity).
2.5 Heteroscedasticity Test
This test is to see the similarities and differences in
variance in the observer residuals from a regression
model. Heteroscedasticity test of this study was
presented using Spearman's rho test.
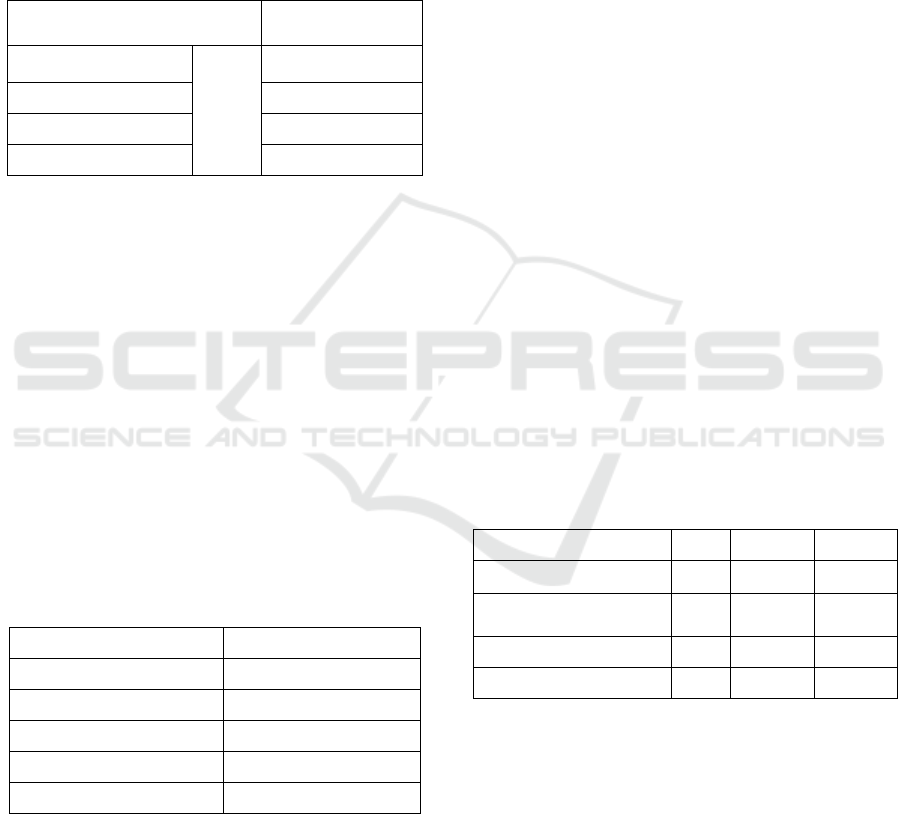
Table 7: Spearman's rho Test.
Spearman's rho
Unstandardized
Residual
Rewards & Punishment
Sig.
(2-
tailed)
0,973
Jobs Rotation 0,973
Employee Engagement 0,965
Career Development 0,686
Table 7 shows that the Unstandardized Residual
correlation value of the all independent variables have
significance values greater than 0.05. With a sign
value of 0.973 > 0.05, a sign value of job rotation
0.973 > 0.05, a sign value of employee engagement
0.965 > 0.05, and a career development sign value of
0.686 > 0.05. So it can be concluded that there is no
heteroscedasticity problem.
2.6 Multiple Linear Regression
Analysis
This analysis is needed to find out how much
influence the variables of reward & punishment, job
rotation, employee engagement, and career
development have on the performance variable.
Table 8: Regression Model.
Model Coeficient
(Constant) 7983
Rewards & Punishment 0,200
Jobs Rotation - 0,253
Employee Engagement 0,300
Career Development 0,245
Based on the description of the table above, the
following regression equation is obtained:
Y = 7.983 + 0.200 X
1
- 0.253 X
2
+ 0.300 X
3
+ 0.245 X
4
(1)
Information :
Y = Performance
X
1
= Rewards & Punishment
X
2
= Job Rotation
X
3
= Employee Engagement
X
4
= Career Development
Based on the regression model above, the
variables of rewards and punishment (X
1
), (employee
engagement (X
3
), and career development (X
4
) have
a positive effect, while job rotation (X
2
) has a
negative effect. In this case, if the rewards and
punishment variables increase by one unit, then the
performance variable (Y) will increase by 0.200.
Furthermore, if the job rotation variable (X
2
)
increases by one unit, then the performance variable
(Y) will decrease by 0.253. Furthermore, if the
employee engagement variable (X3) increases by one
unit, then the performance variable (Y) will increase
by 0.300. Furthermore, if the career development
variable (X4) increases by one unit, then the
performance variable (Y) will increase by 0.245. The
constant value is 7.983, indicating that the
performance value will be 7.983 without being
influenced by the variables of rewards and
punishment, job rotation, employee engagement and
career development.
2.7 T Test
This test is conducted to determine how much This
test is intended to determine whether rewards and
punishment (X
1
), job rotation (X
2
), employee
engagement (X
3
), and career development (X
4
)
partially have a significant effect on performance (Y).
Table 9: T Test Results.
Independent Variable B t Sig.
Rewards & Punishment
0,200 2,239 0,026
Jobs Rotation
-
0,253 -3,175 0,002
Employee Engagement
0,300 3,578 0,000
Career Development
0,245 3,851 0,000
The following are the results of the hypothesis of
each independent variable:
1)
The regression coefficient value is 0.200 with a
positive direction and the t-count value is 2.239,
which is greater than t-table 1.654 and the
significance value is 0.026 which is less than 0.05.
So the third hypothesis is as follows: there is a
positive and significant influence between
rewards and punishment on the performance of
employees of PT XYZ.
The Effect of Rewards and Punishment, Job Rotation, Employee Engagement and Career Development on Employee Performance at PT
XYZ
211

2)
The t-count value of the job rotation variable is -
3.175 which is less than t-table 1.654 and the
significance value is 0.002 which is less than 0.05
and the regression coefficient is -0.253 in a
negative direction. This means that work rotation
has a significant negative effect on performance.
So the third hypothesis is as follows: there is a
negative and significant influence between job
rotation on the performance of PT XYZ’s
employees.
3)
The t-count value of the employee engagement
variable is 3.578 which is greater than 1.654 and
the significance value is 0.000 which is less than
0.05 and the regression coefficient is 0.300 in a
positive direction. This means that the employee
engagement variable has a significant positive
effect on performance. So the third hypothesis is
as follows: there is a positive and significant effect
between employee engagement on the
performance of PT XYZ’s employees.
4)
The t-count value of the career development
variable is 3.851 which is greater than 1.654 and
the significance value is 0.000 which is less than
0.05 and the regression coefficient is 0.245 in a
positive direction. This means that career
development variables have a significant positive
effect on performance. So the fourth hypothesis is
as follows: there is a positive and significant
influence between career development on the
performance of employees of PT XYZ.
2.8 F Test
The F test is used to determine whether rewards and
punishment (X
1
), job rotation (X
2
), employee
engagement (X
3
), and career development (X
4
) have
a simultaneous positive effect on employee
performance.
Table 10: F Test Results.
Model
Sum of
Squares
Df
Mean
Square
F Sig.
Regression 80.786 4 20.196 12.132 .000
b
Residual 301.305 181 1.665
Total 382.091 185
The results of the F statistic test obtained that the
significance of the F test (probability) was 0.000 (p <
0.05) and the F-count value of 12.132 which was
greater than F-table which was 2.43. This means that
there is a positive and significant influence between
rewards and punishment, job rotation, employee
engagement and career development on the
performance of PT XYZ’s employees.
3
CONCLUSION
Based on the results of the description of the
discussion above, the formulation of the conclusions
is as follows:
1. Rewards and punishment have a positive and
significant effect on employee performance. The
higher the level of rewards and punishment, it can
improve employee performance.
2. Job rotation has a negative and significant effect
on employee performance. The higher the job
rotation rate, the lower the employee's
performance.
3. Employee engagement has a positive and
significant effect on employee performance. The
higher the level of employee engagement, it can
improve employee performance.
4. Career development has a positive and significant
effect on employee performance. The higher the
level of career development, it can improve
employee performance.
5. Rewards and punishment, job rotation, employee
engagement, and career development have a
simultaneous and significant effect on employee
performance. When all independent variables are
managed properly and appropriately, it will
improve employee performance.
REFERENCES
Ghozali, I. (2012). Aplikasi Analisis Multivariate Dengan
Program IBM SPSS. Yogyakarta: Universitas
Diponegoro.
Nawawi, H. (2005). Manajemen Sumber Daya Manusia
Untuk Bisnis Yang Kompetitif (Cetakan ke-4).
Yogyakarta: Gajah Mada Univercity Press.
Rivai, V. (2005). Manajemen Sumber Daya Manusia Untuk
Perusahaan. Jakarta: PT Raja Grafindo Persada.
Robbins, S. P., & Judge, T. A. (2009). Organizational
Behaviour, 13th edition. USA.
Siddhanta, A., & Roy, D. (2010). Employee Engagement
Engaging the 21st Century Workforce.
Sugiyono. (2014). Metode Penelitian Kuantitaif Kualitatif
dan R&D. Bandung: ALFABETA.
Tohardi, A. (2002). Pemahaman Praktis Manajemen
Sumber Daya Manusia . Bandung: Mandar Maju.
Mangkunegara, A. P. (2015). Sumber Daya Manusia
Perusahaan (Cetakan kedua belas). Bandung: Remaja
Rosdakarya.
ICAESS 2021 - The International Conference on Applied Economics and Social Science
212
