
The Impact of Financial Inclusion on Financial Stability in Indonesia
Wulan Pudji Lestari and Doni Putra Utama
Department of Business Management, Politeknik Negeri Batam, Jl. Ahmad Yani, Batam, Indonesia
Keywords: Financial Stability, Financial Inclusion
Abstract: The financial system has a strategic role in an economy. In the last 22 years, Indonesia has experienced two
economic crises. This event reminds of the importance of maintaining financial system stability. The data
used in this study is quarterly data for the period 2008-2019 from Indonesia Financial System Statistics and
Financial Stability Review of Bank Indonesia as well as the Annual Report of the Deposit Insurance
Corporation. Data analysis method used a t-test and f-test. The result of this investigation showed that
financial inclusion that was proxied using the number of savings accounts and the number of bank service
offices had no influence on financial stability. Meanwhile, financial inclusion that is proxied using the
number of ATMs, third-party funds-to-GDP ratio and SMEs credit account ratio to bank credit accounts has
a positive and significant effect on financial stability. This research also shows that financial inclusion
jointly has a positive and significant effect on financial stability. Based on this research, the government is
expected to create a policy that attracts the public to use financial services that are fully available.
1 INTRODUCTION
Indonesia has experienced two economic crises over
a span of 22 years. In mid-1997 until its peak in
1998 Indonesia experienced an Asian Financial
Crisis. At the beginning of 1998, the rupiah
exchange rate on the US dollar reached Rp
10.700,00, - and significantly weakened during the
first half of 1998 (Harvie & Hoa, 2016). Not just the
Asian Financial crisis, during the global economic
crisis from 2008 to 2009, the rupiah depreciated
again at a point of Rp 12,100 per US dollar. This
then became a lesson for Indonesia on the
importance of maintaining the stability of the
country’s financial system. Bank Indonesia reported
in April 2020 that Indonesia experienced a
devaluation of the exchange rate with a middle value
of Rp 16,413 per US dollar caused by the influx of
the COVID-19 pandemic in Indonesia.
Several times the economic crisis proved that
financial system stability in Indonesia is still not
gppd enough to ward off all pressures both internally
and externally. Currently, increasing financial
inclusion is a priority for many countries after global
financial crisis in 2008. The high level of financial
inclusion contributes to the increasing stability of
banks as financial service providers (Ahamed &
Mallick, 2017). Financial inclusion itself is one of
the strategies used by many countries to increase the
inclusive growth of the country (Dienillah,
Anggraeni, & Sahara, 2018). Financial inclusion in
also likely to negatively affect the stability of the
country’s financial system. According to Dienilla,
Anggraeni and Sahara (2018), the possibility of
instability in a financial system is caused by a
decline in credit standards, increased risk to the
bank’s reputation, and the absence of action on
microeconomic regulations. Bank Indonesia stated
that financial inclusion itself is a factor that can
substantially boost financial system stability and
economic growth of a country (Bank Indonesia,
2014). This is based on the role and distribution of
financing sources to national economic growth that
can only occur if the financial system can survive all
kinds of vulnerabilities both internally and
externally (Bank Indonesia, 2014).
Camara and Tuesta (2014) stated that Indonesia
is ranked 61
st
out of 82 countries that serve as the
object of research on the ease of people in accessing
financial services, as well as the 71
st
rank regarding
the absence of barriers for people in access to
financial services. This is far from the vision and
mission of inclusive finance that has been
formulated, namely creating a financial system that
can be accessed by all people easily in order to
improve the economy, prevent squalor, allign
income and realize a good financial system stability
in Indonesia (Bank Indonesia, 2014).
40
Pudji Lestari, W. and Putra Utama, D.
The Impact of Financial Inclusion on Financial Stability in Indonesia.
DOI: 10.5220/0010894600003255
In Proceedings of the 3rd International Conference on Applied Economics and Social Science (ICAESS 2021), pages 40-47
ISBN: 978-989-758-605-7
Copyright
c
2022 by SCITEPRESS – Science and Technology Publications, Lda. All rights reserved

Research conducted by Dienillah, Anggraeni and
Sahara (2018) found that countries with high income
levels have inclusive financial levels and financial
stability is better than countries with middle and low
incomes. The study also mentioned that financial
inclusion has no influence on low and middle
income countries as well as in high income countries
that have a positive effect on financial system
stability, and that the country needs to increase the
availability of financial services and improve
financial development to achieve financial inclusion
and good financial stability.
Researchers previously used the ratio of the
number of savings accounts, the ratio of the number
of bank services offices, the ratio of Third Party
Funds to Gross Domestic Product (GDP), as well as
the total credit accounts of SMEs and Banks as
independents variables that become proxies of
financial inclusion. In this study, researcher added
independent variables in the form of the number of
Automated Teller Machines (ATM) ratios as a proxy
of financial inclusion. Rusdianasari (2018) in her
research mentioned that ATM as a form of financial
technology has a role to play in the creation of good
financial inclusion in terms of the availability of
financial services. Quoted from
www.worldbank.org, Indonesia is classified as a
middle income country, which then encourages
researcher to examine the impact of financial
inclusion on financial system stability in Indonesia.
This study aims to find out whether financial
inclusion affects financial system stability in
Indonesia during the period 2008 to 2019
quarteredly, as well as to find the empirical evidence
related to the impact of financial inclusion on
financial system stability in Indonesia during the
period 2008-2019.
2 LITERATURE REVIEW
2.1 Classical Theory
According to Adam Smith (1776), all economic
resources can be used with maximum (full
employment) if there is a prefect competitive
economy, this is believed by classical economists.
They also argue that full employment can only be
achieved if the country’s economy is not mixed by
the government but rather the market mechanism has
full control over the state economy (Smith, 1776).
The accumulation of capital is also seen as the key
to progressed by the classical. This resulted in the
storage of large amounts of money tends to be done
by the classics.
2.2 Banking
The definition of banking has been first regulated by
Law Number 10 of 1998 about Banking. Banking is
an institution, business activity, and process in a
business activity related to the bank. The law also
explains that the entire community fund covered by
a business entity intended to improve the standard of
living of the community is referred to as a bank.
Banking is an activity carried out with the intention
to raise funds (funding) and channel them back
(lending), as well as a financial institution that
receives deposits from the public in the form of
savings, current accounts, and deposits and provide
credit to the community as its main (Kasmir, 2013).
Bank is also a place for exchange, transfer of money
and receipt of all forms of payments and deposits.
The bank itself is defined as a financial business
entity that serves as a storage of money from the
community that will be channelled again to the
community in the form of credit intended to improve
people’s living standard (Darmawi, 2012).
2.3 Bank Penetration
Inclusive finance must have a large number of
financial service users, so an inclusive financial
system requires bank penetration to reach all levels
of society (Sarma, 2012). Bank penetration is one of
the driving factors in the creation of financial
inclusion is what a state needs to do to encourage the
creation of a good inclusive financial system, as
evidenced by the increasing number of users of
financial services (Sarma, 2012). The number of
savings accounts owned by the public as an indicator
of bank penetration measurement has a positive and
significant effect on financial system stability
(Dienillah, Anggraeni, & Sahara, 2018). Based on
research conducted by Ahamed and Mallick (2017)
found that the number of savings accounts held per
100,000 adult population has no significant effect on
financial system stability. Therefore, the penetration
of banks as a proxy of financial inclusion measured
using the number of savings accounts is estimated to
affect the stability of the financial system in
Indonesia, so the hypothesis that will be tested in
this study as follows:
H1: Financial inclusion proxied by the ratio of
the number of savings accounts affects financial
system stability in Indonesia in the period 2008-
2019.
The Impact of Financial Inclusion on Financial Stability in Indonesia
41

2.4 Availability of Access to Financial
Services
The availability of financial services and the ease of
access to financial services by all levels of society
must exist in an inclusive financial (Sarma, 2012).
The availability of access to financial services is
indicated by the number of ATM and financial
services offices available in a region. The
availability of financial services in an area both in
urban and rural areas will result in easy public
access to these financial services, so that the
involvement of the community supports the creation
of a stable financial system.
According to Camara and Tuesta (2014) in their
research, the availability of access and the absence
of barriers in access to financial services are the
main factors in the growth of good financial
inclusion in a country, which can then also
positively affect the stability of the financial system.
Rusdianasari (2018) found that the number of bank
services offices that are indicators of financial
inclusion measurement in terms of availability of
access to financial services has a significant effect
on financial system stability in Indonesia, but this
does not apply to the number of ATM available that
do not have a significant effect on financial system
stability in Indonesia. Dienillah, Anggraeni, and
Sahara (2018) in their research, showed that the
availability of financial access proxied using the
ratio of the number of bank service offices has a
significant positive effect on financial system
stability in countries with high income levels.
Contrary, Irmayasari and Adry (2020) found that the
number of bank branch offices had no effect on
financial system stability. The of the number of bank
service offices and ATM in circulation is expected
to affect the stability of the financial system in
Indonesia, so the next hypothesis to be tested as
follows:
H2: Financial inclusion proxied by the ratio of
the number of Automatd Teller Machines (ATM)
affects the stability of the financial system in
Indonesia in the period 2008-2019.
H3: Financial inclusion proxied by the ratio of
the number of bank service offices has an effect
on financial system stability in Indonesia in the
perio 2008-2019.
2.5 the Usefulness of Financial Services
According to Sarma (2012), bank account owners
should make adequate use of these financial
services, because ownership of bank accounts alone
is not enough to encourage financial inclusion of a
country. Therefore, the deposit-to-GDP ratio as well
as the ratio of SMEs credit accounts to the number
of banking credit accounts are measuring the extent
to which people use financial services to promote
financial system stability.
The number of users of financial services is not
enough to encourage the creation of good financial
inclusion, but it must be followed by the utilization
of financial services itself (Sarma, 2012). Han and
Melecky (2013) mentioned that increased access to
bank savings can increase the resilience of the
funding base of savings collected in the form third-
party funds, the study also found that third-party
funds negatively and significantly affect the stability
of the financial system. Dienillah and Anggraeni
(2016) in their research found that the ratio of
deposit to third-party funds is positively related to
financial stability in Asian countries. This is in line
with research conducted by Laksamana and
Suryahana (2018), showing that the increase in
third-party funds also has a positive impact directly
on financial stability in Indonesia. The increase in
the number of SMEs accounts alone has an effect on
improving financial stability related to decreasing
the credit risk of SMEs (Laksamana & Suryadhana,
2018). Similarly, Siddik and Kabiraj (2018) found
that financial inclusion measured using SME credit
amounts to banking credit had a positive and
significant contribution to financial system stability.
From this explanation, the ude of financial services
as a proxy of financial inclusion as measured using
the ratio of deposit to third-party funds as well as the
ratio of the number of SMEs credit accounts to the
number of banking credit accounts is estimated to
affect the stability of the financial system in
Indonesia, do the next hypothesis that will be texted
in this study as follows:
H4: Financial inclusion proxied by deposit-to
third-party funds ratio affects financial system
stability in Indonesia in the period 2008-2019.
H5: Financial inclusion proxied by the ratio of
SME credit accounts to banking credit accounts
has an effect on financial system stability in
Indonesia in the period 2008-2019.
2.6 Financial Inclusion
Financial inclusion is defined as an overall effort
aimed at eliminating all material and non-material
obstacles to the ease of public access in utilizing
financial services (Bank Indonesia, 2014). It is still
far in fact of the world achieved, evidenced by the
number of people who have difficulty in accessing
ICAESS 2021 - The International Conference on Applied Economics and Social Science
42
financial services that result in financial inclusion in
Indonesia is no better that financial inclusion from
other countries (Camara & Tuesta, 2014). This is far
from the criteria for creating a good economic
system, based on community involvement in the
economic system is an important factor in the
creation of a good economic system, marked by the
ease of access to financial services by all levels of
society as a form of community involvement in the
country’s economic system (Bank Indonesia, 2014).
It is also based on research conducted by Dienillah
and Anggraeni (2016), mentioning that financial
system stability in Asia is significantly affected by
financial inclusion. Financial inclusion has several
factors that affected whether or not financial
inclusion, namely bank penetration, availability of
access to financial services, as well as the usefulness
of financial services (Sarma, 2012).
The three driving factors of financial inclusion,
especially the availability of financial services, are
believed to encourage the growth of financial
inclusion that has positive impact on financial
system stability (Camara & Tuesta, 2014). Financial
inclusion is explained to have both positive and
negative effects on financial system stability (Khan,
2011). Research conducted by Dienillah, Anggaraeni
and Sahara (2018), shows that financial inclusion
only has a significant effect on countries with high
income levels and has no effect on middle-income
countries. Based on this, financial inclusion is
expected to simultaneously affect the stability of the
financial system in Indonesia so, the next hypothesis
to be tested as follows:
H6: Financial inclusion significantly affects
financial system stability in Indonesia in the
period 2008-2019.
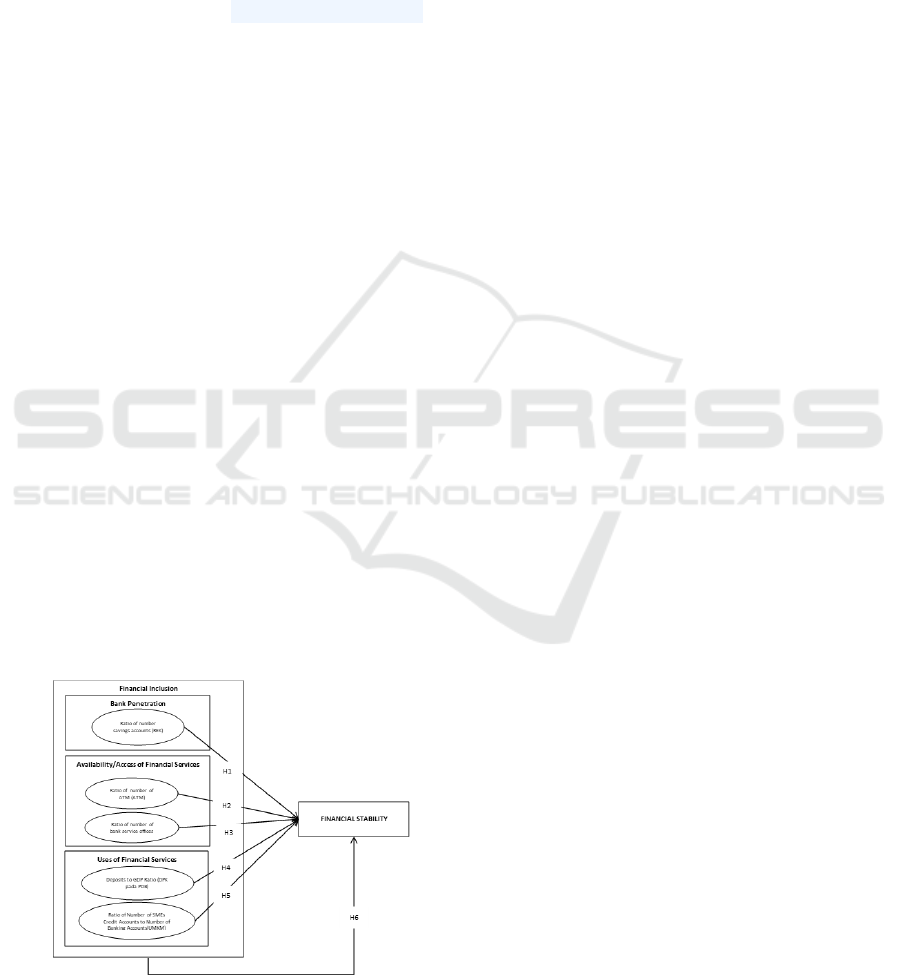
Based on the hypotheses that have been
presented, the research model is obtained as follows:
Figure 1: Research Model.
3 RESEARCH METHOD
The method approach used in this study is the
hypothesis test, where there are data analysed in the
form of numbers and this study there is an influence
test that requires quantitative approach in processing
the data.
This type of research is descriptive using
quantitative data. The object of this research is banks
in Indonesia. The sampling technique in this study is
to use census sampling.
4 RESEARCH RESULT AND
DISCUSSION
4.1 Characteristic of Sample
The characteristics of the sample on this study
divided in two characteristics, based on the amount
of core capital of bank, and based on operational
bank. This study has 110 banks in Indonesia which
is become the sample of this study. Based on the
amount of core capital of banks in Indonesia, banks
in Indonesia are classified in four category which is
called General Banks Business Activity (GBBA).
Bank which classified in GBBA I have a core capital
of less than 1 trillion, GBBA II with a core capital
above 1 trillion to 5 trillion, GBBA III with a core
capital above 5 trillion to 30 trillion, while for the
category of GBBA IV is a bank that has a core
capital above 30 trillion. Based on 110 banks in
Indonesia, most of the sample classified in the
category of GBBA II with total 61 banks (55%).
GBBA, I have 14 banks (13%), GBBA III has 28
banks (25%), and GBBA IV only has 7 banks (6%).
It can be explained that the amount of core capital of
banks Indonesia is above 1 trillion to 5 trillion.
Based on the operational bank, banks in
Indonesia classified in two, conventional banks and
sharia banks. Conventional bank itself is a bank that
in providing services and financial traffic as a
business activity is carried out in accordance with
the provisions previously stipulated. On the other
hand, sharia banks are banking whose business
activities are in accordance with Islamic law and
Law Number 21 of 2008 about Sharia banking.
From 110 banks in Indonesia, most of them is
classified into conventional banks with has 96 banks
on total (87%) and sharia banks has 14 banks (13%).
It can be explained that the operational banks
Indonesia is conventional bank.
The Impact of Financial Inclusion on Financial Stability in Indonesia
43

4.2 Descriptive Statistics
Descriptive statistics are statistics that describe the
characteristics of the data to be examined.
Descriptive statistics also have frequency,
dispersion, measurement of central tendencies, and
measurement of shapes. A frequency that indicates
the number of times a phenomenon occurs.
Measurement of central tendency is used to measure
the central value of data distribution in the form of
average, median, mode (Ghozali, 2011). The
purpose of this analysis is to determine the state of
the variables used during the study period. The result
of the descriptive statistical analysis can be seen as
follows:
Table 1: Descriptive Statistics.
N Min Max Mean Std. Dev
Y 48 0.74 2.43 1.2844 0.48687
X1 48 46.57 148.34 81.692 30.6966
X2 48 20.00 56.00 37.646 11.75
X3 48 10.00 20.00 14.563 3.10734
X4 48 31.64 39.17 37.354 1.71376
X5 48 18.93 28.37 20.035 1.80764
Source: The data is processed using SPSS software
Based on the descriptive statistical test result in
table 1, N shows the amount of data that is 48 data
obtained secondary and the processed. Minimum
shows the lowest value of each variable data. On the
Y variable, namely financial system stability index,
the minimum value of 0,74, this figure is the
financial system stability index of Indonesia in third
quarter of 2017. On variable X1, ratio of the number
of savings accounts per 100,000 adults shows a
value of 46,57 which is the value of ratio of the
number of saving accounts in Indonesia in first
quarter on 2008, while in the variable X2 shows the
minimum value of 20,00 is the value of ratio of
ATM number per 1,000 km
2
in Indonesia in fourth
quarter of 2008. In X3 variable the ratio of the
number of bank service offices per 1,000 km
2
shows
the minimum value of 10,00 is the value of
Indonesia’s ratio of the number of bank service
offices per 1,000 km
2
. Variable X4 shows the
minimum value of 31,64 is the value of ratio of
third-party funds to GDP in Indonesia in fourth
quarter of 2008, and variable X5, namely the ratio
SMEs credit accounts to banking credit accounts
showed a value of 18,93 in first quarter of 2008 in
Indonesia.
Maximum shows the highest value of each
variable data. In variable Y, the maximum financial
system stability index value is 2,43, which is the
financial system stability index of Indonesia in
fourth quarter of 2008. In variable X1, the ratio of
the number of saving accounts per 100,000 adults
shows a maximum value of 148,34, which is the
value of ratio of the number of saving accounts per
100,000 adults in Indonesia in fourth quarter of
2019, while on the ratio of number of ATM per
1,000 km
2
, X2 shows the maximum value of 56,00
is the value of Indonesia’s ratio of the number of
ATM per 1,000 km
2
in fourth quarter of 2017. On
the value of the ratio of the number of bank service
offices per 1,000 km
2
, X3 shows the maximum
value of 20,00 in fourth quarter of 2018. Variable
X4 shows the maximum value of 39,17 is the value
of ratio of third-party funds to GDP in Indonesia in
third quarter of 2017, and variable X5, namely the
ratio SMEs credit accounts to banking credit
accounts showed a value of 28,37 in fourth quarter
of 2015 in Indonesia.
Means showing the average value of each data
variable. In variable Y, the financial system stability
index average value is 1,2844. In variable X1, the
ratio of the number of saving accounts per 100,000
adults shows an average value of 81,692, while on
the ratio of number of ATM per 1,000 km
2
, X2
shows the average value of 37,646. On the value of
the ratio of the number of bank service offices per
1,000 km
2
, X3 shows the average value of 14,563.
Variable X4 shows the average value of 37,354, and
variable X5, namely the ratio SMEs credit accounts
to banking credit accounts showed an average value
of 20,035.
Standard deviations indicate the heterogenicity
contained in the tested data or the average amount of
variability of the data examined. In variable Y, the
financial system stability index, the standard
deviation is 0,48687. In variable X1, the ratio of the
number of saving accounts per 100,000 adults shows
a standard deviation of 30,6966, while on the ratio of
number of ATM per 1,000 km
2
, X2 shows the
standard deviation of 11,75. On the ratio of the
number of bank service offices per 1,000 km
2
, X3
shows the standard deviation of 3,10734. Variable
X4 shows the standard deviation of 1,71376, and
variable X5, namely the ratio SMEs credit accounts
to banking credit accounts showed a standard
deviation of 1,80764.
ICAESS 2021 - The International Conference on Applied Economics and Social Science
44

4.3 Classical Asumption Testing
Results
The result of testing the classic assumptions of the
regression model is usually referred to as good
models if they meet the test requirements, the results
of the test that have been carried out consist of
normality test, heteroscedasticity test and
multicollinearity test.
4.3.1 Normality Test
Normality tests are performed to determine the value
of group deployments and data variables whether
they are distributed normally or not. A data variable
is said to be distributed normally if the significant
value is greater than 0.05 or 5% (Santoso, 2012).
The normality test results are follows:
Table 2: Normality Test.
Variable
Kolmogorov-Smirnov
a
Shapiro-Wilk
Sig. Sig.
Y 0.117 0.197
X1 0.119 0.158
X2 0.2 0.096
X3 0.188 0.051
X4 0.2 0.516
X5 0.2 0.708
Source: The data is processed using SPSS software
4.3.2 Heterocedasticity Test
Heteroscedasticity testing is conducted to determine
whether there are similarities of a research
regression model used, which if the research
variable does not experience heteroscedasticity, then
indicates the research regression model used well
(Sunyoto, 2016). Scatterplot charts are used as
heteroscedasticity testing, taking into account
scatterplot points at standardized value (ZPRED)
and stundentized residual (SRESID). A regression
model is said not to experience heteroscedasticity
when the points in ZPRED and SRESID do not form
a particular pattern. The heteroscedasticity test
results are follows:
Source: The data is processed using SPSS software
Figure 2: Heterocedasticity Test.
4.3.3 Multicolinenieritas Test
Multicolieniertas test is the existence of a definite
liner relationship between the free changes. To find
out if there is a problem with data related to
multicollinearity test can be seen from the value of
Tolerance and VIF (Value Infaltion Factor). If the
value of tolerance is more than 0,10 and the value of
VIF is less than 10 then the variable has no problem
related to the multicollinearity test with other
independent variables (Ghozali, 2011). The
multicollinearity test results are follows:
Table 3: Multicolieniertas Test.
Variable Tolerance
VIF
X1 0.247 4.048
ATM 0.252 3.973
X3 0.804 1.244
X4 0.693 1.444
X5 0.764 1.309
Source: The data is processed using SPSS software
4.4 Hypothesis Testing Results
Table 4: Multiple Linear Regression Analysis Results.
Variables B T Sig
(Constant) -2.871 -3.21 0.003
X1 -0.001 -0.571 0.571
X2 -0.017 -3.302 0.002
X3 -0.016 -1.475 0.148
X4 0.101 4.704 0.000
X5 0.067 3.451 0.001
Source: The data is processed using SPSS software
The Impact of Financial Inclusion on Financial Stability in Indonesia
45

From table 4, obtained the multiple linear regression
equation is as follows:
Y = α + β
1
X1+ β
2
X2 + β
3
X3 + β
4
X4 + β
5
X5
(1)
The multiple regression explained that a constant
value of -2,871 which means that if ratio of the
number of saving accounts per 100,000 adults (X1),
ratio of number of ATM per 1,000 km
2
(X2), ratio of
number of bank service offices per 1,000 km
2
(X3),
ratio of third-party funds to GDP (X4), and ratio of
SMEs credit accounts to banking credit accounts
(X5) have a zero value, then the level of financial
system stability index (Y) is the value -2,871. The
regression coefficient for the ratio of the number of
saving accounts per 100,000 adults (X1) is -0,001,
the ratio of number of ATM per 1,000 km
2
(X2) is -
0,017, the ratio of number of bank service offices
per 1,000 km
2
(X3) is -0,016, the ratio of third-party
funds to GDP (X4) is 0,101, and ratio of SMEs
credit accounts to banking credit accounts (X5) is
0,067.
Based on the equation model above, it can be
explained that if ratio of the number of saving
accounts per 100,000 adults increase by 1 value,
then the financial system stability index will be
decreased by 0,001. Based on the table above, it can
be explained that the significance of the ratio of the
number of saving accounts per 100,000 adults
variable is 0,571, which means that there is no
significant effect because the value is greater than
0,05, it can be conclude that H1 not supported.
Based on table 4, it can be explained that if ratio
of number of ATM per 1,000 km
2
increase by 1
value, then the financial system stability index will
be decreased by 0,017. Based on the table above, it
can be explained that the significance of the ratio of
number of ATM per 1,000 km
2
variable is 0,002,
which means that there is has significant effect
because the value is lesser than 0,05, it can be
conclude that H2 is supported.
Based on table 4, it can be explained that if ratio
of number of bank service offices per 1,000 km
2
increase by 1 value, then the financial system
stability index will be decreased by 0,016. Based on
the table above, it can be explained that the
significance of the ratio of number of ATM per
1,000 km
2
variable is 0,148, which means that there
is no significant effect because the value is greater
than 0,05, it can be conclude that H3 not supported.
Based on table 4, it can be explained that if ratio
of third-party funds to GDP increase by 1 value,
then the financial system stability index will be
increased by 0,101. Based on the table above, it can
be explained that the significance of the ratio of
third-party funds to GDP variable is 0,000, which
means that there is has significant effect because the
value is lesser than 0,05, it can be conclude that H4
is supported.
Based on table 4, it can be explained that if ratio
of SMEs credit accounts to banking credit accounts
increase by 1 value, then the financial system
stability index will be increased by 0,067. Based on
the table above, it can be explained that the
significance of the ratio of SMEs credit accounts to
banking credit accounts variable is 0,001, which
means that there is has significant effect because the
value is lesser than 0,05, it can be conclude that H5
is supported.
Table 5: Simultan Test Result (F-Test)
F Si
g
.
Regression 41.718 .000
b
Source: The data is processed using SPSS software
Based on table 4, it can be explained that all
independent variables are ratio of the number of
saving accounts per 100,000 adults, ratio of number
of ATM per 1,000 km
2
, ratio of number of bank
service offices per 1,000 km
2
, ratio of third-party
funds to GDP, and ratio of SMEs credit accounts to
banking credit accounts significantly affect
simultaneously to financial system stability index in
Indonesia. Therefore, it can be concluded that H6 is
supported.
5 CONCLUSIONS
This study aims to find out and provide empirical
evidence of the influence of financial inclusion on
financial system stability, which is financial
inclusion is projected with a ratio of the number of
savings accounts per 100,000 adults, the ratio of the
number of bank service offices per 1,000 km
2
, the
ratio of ATM numbers per 1,000 km
2
, the ratio of
third-party funds to GDP, and the ratio SMEs credit
accounts to banking credit accounts and FSSI as a
proxy of financial system stability. After conducting
research, the conclusion can be taken as follows:
1. Financial inclusion measured using the ratio of
the number of savings accounts per 100,000
adults and the ratio of the number of bank
service offices per 1,000 km
2
had no effect on
ICAESS 2021 - The International Conference on Applied Economics and Social Science
46

the stability of the financial system measured
using Y.
2. Financial inclusion measured using the ratio
number of ATM per 1,000 km
2
, third-party
funds to GDP ratio and the ratio of SMEs credit
accounts to banking credit accounts had a
positive and significant effect on financial
system stability, which was indicated by a
significant value of the variable which is
smaller than 0,05.
3. Financial inclusion measured using the ratio of
the number of savings accounts per 100,000
adults, the ratio of the number of bank service
offices per 1,000 km
2
, the ratio number of ATM
per 1,000 km
2
, third-party funds to GDP ratio
and the ratio of SMEs credit accounts to
banking credit accounts together have a positive
and significant influence on stability of the
financial system in Indonesia.
REFERENCES
Ahamed, M. M., & Mallick, S. K. (2017). Is Financial
Inclusion Good for Bank Stability? International
Evidence. Journal of Economic Behaviour &
Organization, 1-53.
Bank Indonesia. (2014). Buku Saku Keuangan Inklusif.
Jakarta: Departemen Pengembangan Akses Keuangan
dan X5.
Camara, N., & Tuesta, D. (2014). Measuring Financial
Inclusion: a Multidimensional Index. Working Paper,
1-40.
Darmawi, H. (2012). Manajemen Perbankan. Jakarta:
Bumi Aksara.
Dienillah, A. A., & Anggareni, L. (2016). Dampak Inklusi
Keuangan terhadap Stabilitas Sistem Keuanga di Asia.
Buletin Ekonomi Moneter dan Perbankan, 409-430.
Dienillah, A. A., Anggraeni, L., & Sahara. (2018). Impact
of Financial Inclusion on Financial Stability Based on
Income Group Countries. Bulletin of Monetary
Economics and Banking, 1-14.
Ghozali, I. (2011). Aplikasi Analisis Multivariate dengan
Progran SPSS 19. Semarang: BP Universitas
Diponegoro.
Han, R., & Melecky, M. (2013). Financial Inclusion for
Financial Stability : Access to Bank Deposits and the
Growth of Deposits in the Global Financial Crisis.
Policy Research Working Paper Series 6577, 1-24.
Harvie, C., & Hoa, T. V. (2016). The Causes and Impact
of The Asian Financial Crisis. Berlin: Springer.
Irmayasari, & Adry, M. R. (2020). Pengaruh Inklusi
Keuangan Terhadap Stabilitas Sistem Keuangan dan
Pertumbuhan Ekonomi di ASEAN. Jurnal Kajian
Ekonomi dan Pembangunan, 161-176.
Kasmir. (2013). Bank dan Lembaga Keuangan Lainnya.
Jakarta: Raja Grafindoi Persada.
Khan, H. R. (2011). Financial Inclusion and Financial
Stability: are they two sides of the same coin?
Chennai: Indian Bankers Association and Indian
Overseas Bank.
Laksamana, K. R., & Suryadhana, N. A. (2018). Dampak
Pertumbuhan Inklusi Keuangan terhadap Stabilitas
Sistem Keuangan di Indonesia. Prosiding Warmadewa
National Conference of Economic (WNCE), 20-36.
Le, T. H., & Chuc, A. T. (2019). Financial Inclusion and
its Impact on Financial Efficiancy and Sustainability:
Empirical Evidence from
Republik Indonesia. (Lembaran Negara Republik
Indonesia Tahun 1988 Nomor 182). Undang-Undang
Republik Indonesia Nomor 10 Tahun 1982 Tentang
Perbankan. Jakarta: Sekretariat Negara.
Rusdianasari, F. (2018). Peran Inklusi Keuangan melalui
Integrasi Fintech dalam Stabilitas Sistem Keuangan di
Indonesia. Jurnal Ekonomi Kuantitatif Terapan, 244-
253.
Santoso, S. (2012). Statistik Parametrik. Jakarta: PT
Gramedia Pustaka Umum.
Sarma, M. (2012). Index of Financial Inclusion - A
Measure of Financial Sector Inclusiveness. Working
Paper, 472-476.
Siddik, M. A., & Kabiraj, S. (2018). Does Financial
Inclusion Induce Financial Stability? Evidence from
Cross-country Analysis. Australian Accounting,
Business and Finance Journal, 34-46.
Smith, A. (1776). An Inquiry into the Nature and Causes
of the Wealth of Nations. London: Methuen & Co.
Ltd.
Sunyoto, D. (2016). Metodologi Penelitian Akuntansi.
Bandung: PT Refika Aditama.
World Bank. (2019, July 1). New Country Classification
by Income Level: 2019-2020. Retrieved from World
Bank Web site: www.worldbank.org
The Impact of Financial Inclusion on Financial Stability in Indonesia
47
