
Analysis of Customer Satisfaction Level of Small and Medium Micro
Enterprises (SMEs) using Importance Performance Analysis (IPA)
Method and SWOT Analysis at PT Perusahaan Gas Negara Sales
Area Batam
Thifany Ruth Simatupang
a
, Nur Rahmah Andayani and Fandy Bestario Harlan
Applied Business Administration, Politeknik Negeri Batam, Jl. Ahmad Yani, Batam Centre 29461, Indonesia
Keywords: Customer Satisfaction, Importance Performance Analysis (IPA) and SWOT Analysis.
Abstract: This research aims to determine the level of SMEs customer satisfaction and identify the best strategies in
increase customer satisfaction at PT Perusahaan Gas Negara Sales Area Batam. The research uses field
research type with qualitative descriptive type approach. The analytical methods used: Importance
Performance Analysis (IPA) and SWOT Analysis. The sample in the study was as many as 62 sources who
based from MSME customers and 2 Sources from sr. of the Analysis Industry and Batam Commercial Sales
Area. The results of this study explained that customer satisfaction is 95%. There are 3 attributes that need to
be improving, i.s: first, Gas usage facilities meet eligibility attributes. Second, PGN provides consultation on
the use of natural gas clear and Directional. Third, PGN is quick in answering any information that customers
need. According to the SWOT analysis, the company has a strong position in the industry so it can maintain
its aggressive business strategy.
1 INTRODUCTION
1.1 Background
The growth of the small and medium micro
enterprises (SMEs) sector during the Covid-19
pandemic is currently the top priority that must be
done in maintaining economic balance in Batam. This
is because the existence of SMEs has a large
contribution as a contributor to gross domestic
product (GDP) that can open more job opportunities
for people affected by the pandemic.
Based on data from the Ministry of Small and
Medium Enterprises Cooperatives Batam is also one
of the largest contributory cities of SMEs business
activities in Indonesia, Batam city has 12,859 MSME
sectors that are officially registered and eligible to
receive direct assistance from the government
(Batampos.co.id, 2020).
PT Perusahaan Gas Negara Sales Area Batam
(PGN), is a company engaged in providing clean
natural gas and economic connection distribution
services that has an economic improvement program
a
https://orcid.org/0000-0001-9817-5500
of SMEs activities with the motivation of creating
new jobs for the people in Batam City (ir.pgn.co.id,
2019).
Therefore, PT Perusahaan Gas Negara (PGN)
Batam Area continuously makes improvements and
improvements to the products and services they offer
to SMEs customers in Batam as a form of concern and
commitment given by the government to the
community, especially small businesses such as
SMEs. Based on this, measurement of MSME
customer satisfaction level needs to be done to
support the company.
This research uses Importance Performance
Analysis (IPA) method where this method aims to
find out the factors that greatly affect the level of
customer satisfaction and what factors need to be
improved, for the performance that has been received
and the expectations that exist in SMEs customers in
PT Perusahaan Gas Negara Sales Area Batam.
Furthermore, in improving customer satisfaction
SWOT analysis (Strength, Weakness, Opportunities,
and Threat) in this study was conducted with the aim
to describe the conditions faced by the company
Simatupang, T., Rahmah Andayani, N. and Bestario Harlan, F.
Analysis of Customer Satisfaction Level of Small and Medium Micro Enterprises (SMEs) using Importance Performance Analysis (IPA) Method and SWOT Analysis at PT Perusahaan Gas
Negara Sales Area Batam.
DOI: 10.5220/0010888900003255
In Proceedings of the 3rd International Conference on Applied Economics and Social Science (ICAESS 2021), pages 289-297
ISBN: 978-989-758-605-7
Copyright
c
2022 by SCITEPRESS – Science and Technology Publications, Lda. All rights reserved
289

related to internal and external factors when
delivering natural gas to SMEs customers. Internal
factors component in the form of weaknesses and
strengths of the company and external factors identify
opportunities and threats.
Therefore, this research is used to measure the
level of customer satisfaction of natural gas through
the use of Importance Performance Analysis (IPA)
method and SWOT analysis with the approach of
analysis of SMEs customer satisfaction strategy
through observation and dissemination of
questionnaires to decision makers. PT Perusahaan
Gas Negara Sales Area Batam.
2 REVIEW OF LITERATURE
2.1 Empirical Study
The previous research in this study is by: Rival
Fahrial (2019) with the research title " Surabaya-
Lombok Crossing Ship Service Performance Review
with IPA and SWOT Methods ". The results of this
study indicate that the Service on board does not yet
have maximum performance results and the strategy
that can be used is to equip the ship's facilities.
Mukti Ali (2019) with the research title" SWOT
analysis in formulating marketing strategies at Grand
celino hotel in Makassar ". The results of this study
are: The hotel must make efforts to improve the
quality of products, services, and product distribution.
Diaz Muhammad Juniawan, Ahmad Wicaksono,
& Rahayu Kusumaningrum (2018) with the research
title " Study of Land Side Service Performance of
Banyuwangi Airport With IPA and SWOT Methods
". From the results of this study, the level of service
performance based on customer interests is in the
category of quite satisfied or good enough.
Rido Insan Raharjo (2018) with the research title
" Marketing Strategy Through Strength Weakness
Opportunity Threat (SWOT) Analysis on Futsal Field
Rental Business in Banyuwang Futsal Scudetto " the
results of this study concluded that the Internal
environmental analysis has the power in dealing with
threats such as competitors and development
strategies that can be done is to promote and provide
safe facilities.
Hayu Kartika (2015) with the research title "
Analysis of Service Quality and Customer
Satisfaction on Household natural gas networks " "
the results of this study concluded that the The level
of natural gas customer satisfaction is still low and
has not been in line with customer expectations so it
was concluded that the customer was not satisfied.
2.2 Theoretical Review
2.2.1 Definition of Quality Service
According to Tjiptono (2011), quality is the value of
good or bad products and services that have been
received based on perceptions about the expectations
of the recipient. According to Fandy Tjiptono (2015),
there are 5 indicators that affect the quality of service
provided to consumers, including the following:
a. Tangibles
Physical evidence indicators contained in the
quality of service include a real view of the
company’s physical facilities and infrastructure
and the surrounding environment situation.
b. Reliability
Reliability indicators are the expertise of a
company to provide services as promised
accurately and reliably.
c. Responsiveness
Response indicator is the company’s ability
tohelp and provide fast and appropriate service
d. Assurance (guarantee and certainly)
The assurace indicator aims to grow customer’s
trust in the product or service on time
e. Empathy (level of concern)
The indicator of concern is done by giving
sincere attention by understanding the
customer's wishes based on the characteristics
of each customer.
2.2.2 Definition of Service
According to Kotler (2002), the definition of service
is an act or act from one party to another that is
intangible and cannot transfer ownership related to
physical products or not.
2.2.3 Definition of Customer Loyalty
According to Tjiptono (2011), the understanding of
customer satisfaction leads to a relatively long and
continuous growth in sales growth with the aim of
increasing purchases by returning customers.
2.3 Conceptual Framework
The thought frameworks is described in the following
figure:
ICAESS 2021 - The International Conference on Applied Economics and Social Science
290
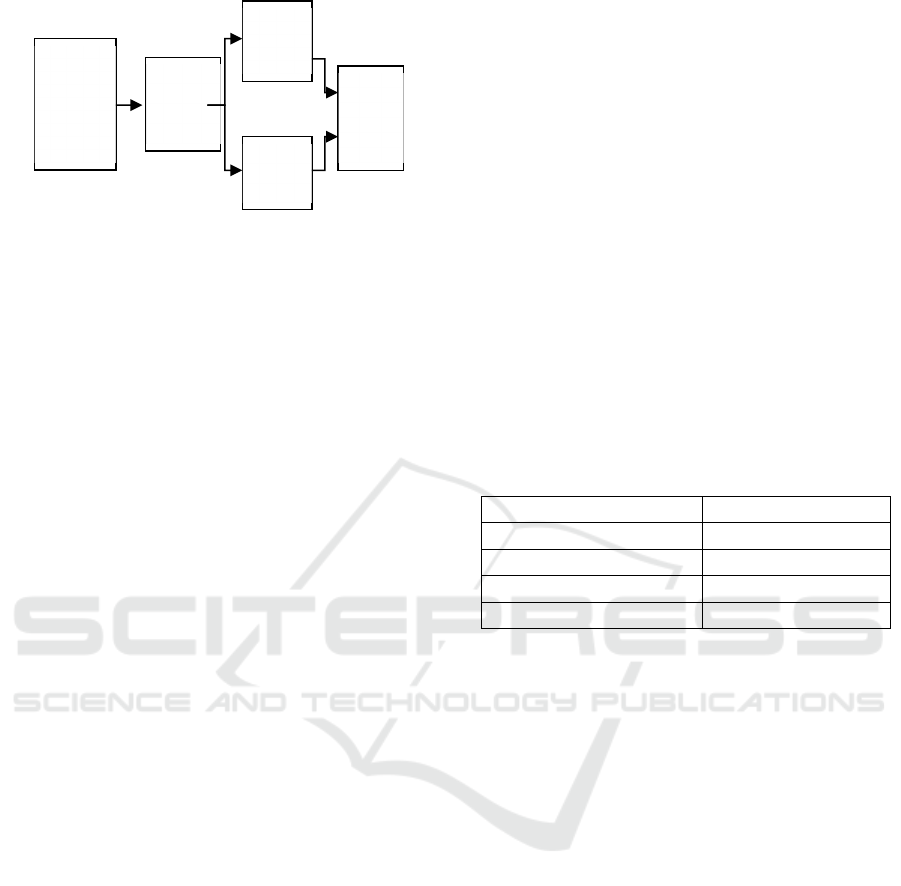
Figure 1: Conceptual Framework.
3 METHOD OF RESEARCH
3.1 Research Design
This research uses field research type with qualitative
descriptive type approach. According to Sugiyono
(2018), descriptive research is used to describe the
analysis of data that has been obtained without
intending to make conclusions that apply to the public
and the findings are not obtained using processed
statistics. While qualitative method according to
Sugiyono (2018), is research based on the philosophy
of postpositivism where the object of research is a key
instrument of data analysis conducted
3.2 Research Subject
This study used non probability sampling technique
to determine respondents in Importance Performance
Analysis (IPA) method. According to Sugiyono
(2017:125), non probability sampling technique is a
technique that does not provide equal opportunities or
opportunities in each section to be selected to be
sources. Furthermore, saturated sampling is
performed to determine the sample to be given a
questionnaire.
Saturated sampling technique according to
Sugiyono (2016:85), is a sample whose population is
considered small or less than 100 so that the entire
sample represents the number of populations. While
the resource persons needed in the analysis of SWOT
method are speakers of SOE employees who have
worked for more than 5 years at PT Perusahaan Gas
Negara Sales Area Batam.
The subjects of this study are:
a. SMEs (Small Customer Category) customers
amounted to 62 customers.
b. Sr. Analyst, Industry and Commercial Sales Area
Batam amounted to 2 sources.
3.3 Data Collection Techniques
Here are the methods of data collection in this study:
a. Questionnaire: Questionnaire is a written
question to collect data from sources
b. Interview (In-Depth Interview): the process of
extracting information in depth and through
direct questions
c. Observation: Direct observation of the life of
objects used in research
d. Documentation: Evidence of data in the form of
images, citations related to research
According to Sugiyono (2017:93), the Likert scale
is a measurement level for assessing a person's
attitudes, opinions, and perceptions about social
phenomenal people to levels from very positive or
very good to very negative or bad. As for each
instrument the questions or statements in the
questionnaire were given the following values:
Table 1: Likert Scale.
Criteria
Score
Strongly Agree
4
Agree
3
Disagree
2
Strongly Disagree
1
3.4 Validity and Reliability
3.4.1 Validity Test
According to Sugiyono (2018), Validity test is a tool
to measure the accuracy of actual data on data
research objects used by researchers. validity test
provisions that if r calculates > r table with a
confidence level of 95% then the instrument can be
declared valid and vice versa, if r calculates < r table
with a confidence level of 95% then the instrument is
declared invalid.
Then the significance value is compared to Alpha
Cronbach (0.05), if the significance value is less than
0.05 then the indicator/statement item is declared
valid (Ghozali, 2018:52).
Reliability Test
Reliability test in the study aims to explain the
instruments used can measure consistently over time
(Sugiyono, 2018). A reliable or non-reliable variable
can be determined if the Value of Cronbach Alpha >
0.60 then the variable item is considered reliable and
vice versa if the Value of Cronbach Alpha < 0.60 then
the variable item is considered unreliable (Ghozali,
2018:48).
PT.
Perusahaan
Gas Negara
Sales Area
Batam
Analysis of
Customer
Satisfaction
Importance
Performance
Analysis
(IPA)
Analysis
SWOT
SMEs
Customer
Satisfaction
Analysis of Customer Satisfaction Level of Small and Medium Micro Enterprises (SMEs) using Importance Performance Analysis (IPA)
Method and SWOT Analysis at PT Perusahaan Gas Negara Sales Area Batam
291

3.5 Importance Performance Analysis
(IPA)
In the research Simajuntak &Purwasih (2017)
Importance Performance Analysis (IPA) method is a
method that measures the framework to achieve
customer satisfaction as the purpose of the company's
performance (performance) judging by the related
attributes and expectations (importance) related to an
attribute.
Quadrant Diagram Formula :
Average performance score and expectation score:
𝑋
=
∑
and 𝑌
=
∑
(1)
Where:
X = Average performance level score
Y = Average score of interest
n = Number of respondents
Calculates the total average value:
𝑋
=
∑
and 𝑌
=
∑
(2)
Where:
X = Weight of the average rating level of the i
performing attribute
Y = Average value of the importance attribute
valuation level i
n = Number of attributes
Table 2: Customer Satisfaction Criteria at PT Perusahaan
Gas Negara Sales Area Batam.
Satisfaction
Value
Interval Value Category
1 0% - 44,99% Very dissatisfied
2 45% - 65,99% Dissatisfied
3 66% - 80,99% Satisfied
4 81% - 100% Very satisfied
3.6 SWOT Analysis
According to Rangkuti (2008), SWOT Analysis
consists of Strengths, Weaknesses, Opportunities and
Threats faced by a company. The following stages of
strategy formulation in the SWOT matrix are as
follows:
1. Determine the list of internal strengths and
weaknesses that exist in PT Perusahaan Gas
Negara Sales Area Batam.
2. Determine the list of external opportunities and
threats available to PT Perusahaan Gas Negara
Sales Area Batam.
3. Determining the Internal Matriks of Factor
Analysis Summary (IFAS)
a. Internal and External weights between 0.0
and 1.0 (The overall value of the weight is
1.00)
b. Rating from Internal between 1 to 4 and
External -1 to -4
c. Value Score is the result of multiplication
between weight value and rating value
Table 3: IFAS (Internal Factors Analysis Summary).
Internal Factors Weighting Rating Score
Srenght (S)
1.
Subtotal
Weakness (W)
1.
Subtotal
Total 1,00
4. Determining the External Matriks of Factor
Analysis Summary (EFAS)
a. Internal and External weights between 0.0
and 1.0 (The overall value of the weight is
1.00)
b. Rating from Internal between 1 to 4 and
External -1 to -4
c. Score Value is the result of multiplication
between weight value and rating value.
Table 4: EFAS (Eksternal Factors Analysis Summary).
Eksternal Factors Weighting Rating Score
Opportunities O)
1.
Subtotal
Threats (T)
1.
Subtotal
Total 1,00
5. The last stage is the SWOT matrix
4 RESULT AND DISCUSSION
4.1 Validity Test
Based on performance validity test results and
expectations, tested with SPSS version 22. Have
decision-making criteria to determine whether or not
the attributes in the questionnaire where if the
calculated r value is greater than or equal to table r
(N=62 of 0.2461) is seen in the statistics book table r
and the value of significance is less than the level of
significance 5%. This can be said if all statements in
ICAESS 2021 - The International Conference on Applied Economics and Social Science
292
the questionnaire are valid and eligible for use as
measuring instruments.
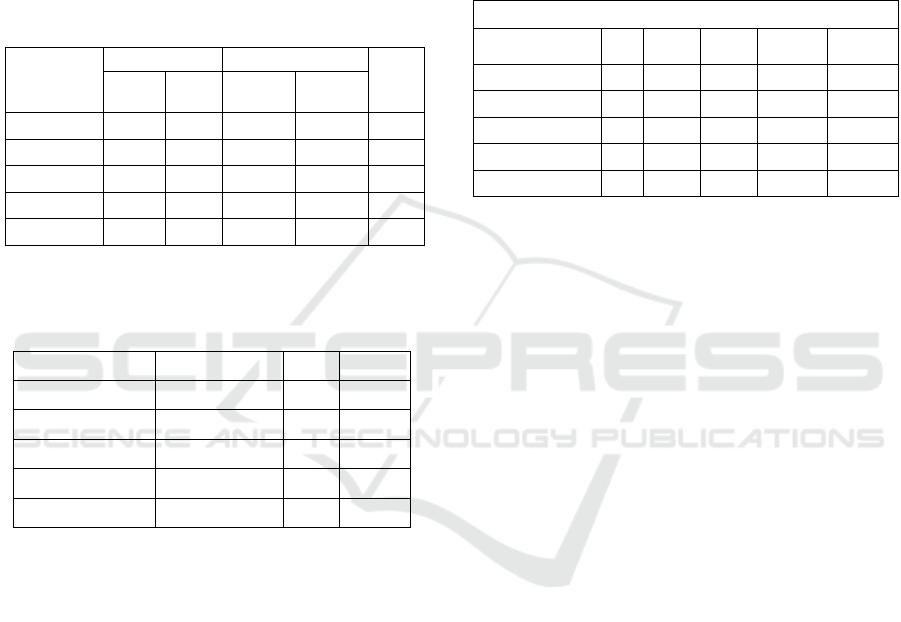
4.2 Reliability Test
Based on the performance reliability test and
customer expectations of SMEs in Table 5, it is
generated that all statement items/indicators have An
Alpha Cronbach value greater than 0.60 so that all
statement items/indicators are reliable. Reliability test
results are presented as follows:
Table 5: Reliability Test Results.
Indicator
Performance Expectations
Decision
Alpha
Cronbach
Value
Standard
Alpha
Cronbach
Value
Standard
Tangible 0,773 0,60 0,796 0,60 Reliable
Reliability 0,801 0,60 0,781 0,60 Reliable
Responsiveness 0,751 0,60 0,787 0,60 Reliable
Assurance 0,782 0,60 0,802 0,60 Reliable
Empathy 0,764 0,60 0,781 0,60 Reliable
4.3 Characteristics of Respondents
Table 6: Summary of Questionnaire Result Data.
Characteristics Information F %
Age 31-35 Years 25 40%
Gender Male 36 58%
Education D-IV/S1 33 53%
Old Subscription >5 Years 33 53%
Type Business Catering 27 44%
Based on the results of the questionnaire obtained the
majority of customers who use natural gas are
customers aged 31-35 years as many as 25 customers
with a percentage of 40%, female customers as many
as 36 customers with a percentage of 58%, customers
with education D-IV / S1 as many as 33 customers
with a percentage of 53%, customers with a
subscription duration of >5 Years as many as 33
customers with a percentage of 53%, customers with
culinary / catering business types as many as 27
customers with a percentage of 44%.
4.4 Descriptive Statistical Result
Based on the results processed SMEs customer data
is known that the highest mean value obtained by the
indicator Of Concern (Empathy) is 16.98 which is
considered to have a service performance in
accordance with customer expectations. While the
lowest mean value obtained by Physical Proof
(Tangible) of 15.98 which is considered still needs to
be increased to achieve customer expectations. This
is in accordance with the results of research obtained
by Kartika (2015), which in this study obtained that
the highest mean value needs to be maintained. While
the lowest mean value needs improvement and should
be scaled back. The results of customer data
recapitulation are presented as follows:
Table 7. Descriptive Statistics
Descriptive Statistics
N Min Max Mean Std. Dev
Tangible 62 8.00 20.00 15.9839 2.65806
Reliability 62 7.00 20.00 16.5000 2.91829
Responsiveness 62 8.00 19.00 16.0645 2.18693
Assurance 62 9.00 20.00 16.8710 2.32931
Empathy 62 10.00 20.00 16.9839 2.09990
4.5 Calculation Result of Importance
Performance Analysis (IPA)
Based on the results of the calculation using the
Importance Performance Analysis (IPA) method in
the table 8, the total performance level is 5105 out of
25 question attributes and the total expectation is
5360 out of 25 question attributes. The result of total
performance and expectations is 95% which is in the
excellent category.
4.6 Cartesius Diagram
Once the position of each attribute is determined, it is
possible to know what priorities need to be improved
and what needs to be improved. The measurement
results can also be used in determining which
attributes should be maintained so as not to degrade
the quality of service that has been provided to
customers.
This is in line with research conducted by Kartika
(2017), which stated that data processed results using
IPA method can show the priority of improving
service quality based on the value of expectation level
and performance level through cartesian diagrams.
The results of the study are interpreted in cartesian
diagrams divided into 4 (four) quadrants. Based on
these 4 quadrants there are 1 (one) quadrant that is the
top priority because it is considered important to be
corrected which is in quadrant I (First). Attributes that
are
in this quadrant have results where the quality of
Analysis of Customer Satisfaction Level of Small and Medium Micro Enterprises (SMEs) using Importance Performance Analysis (IPA)
Method and SWOT Analysis at PT Perusahaan Gas Negara Sales Area Batam
293
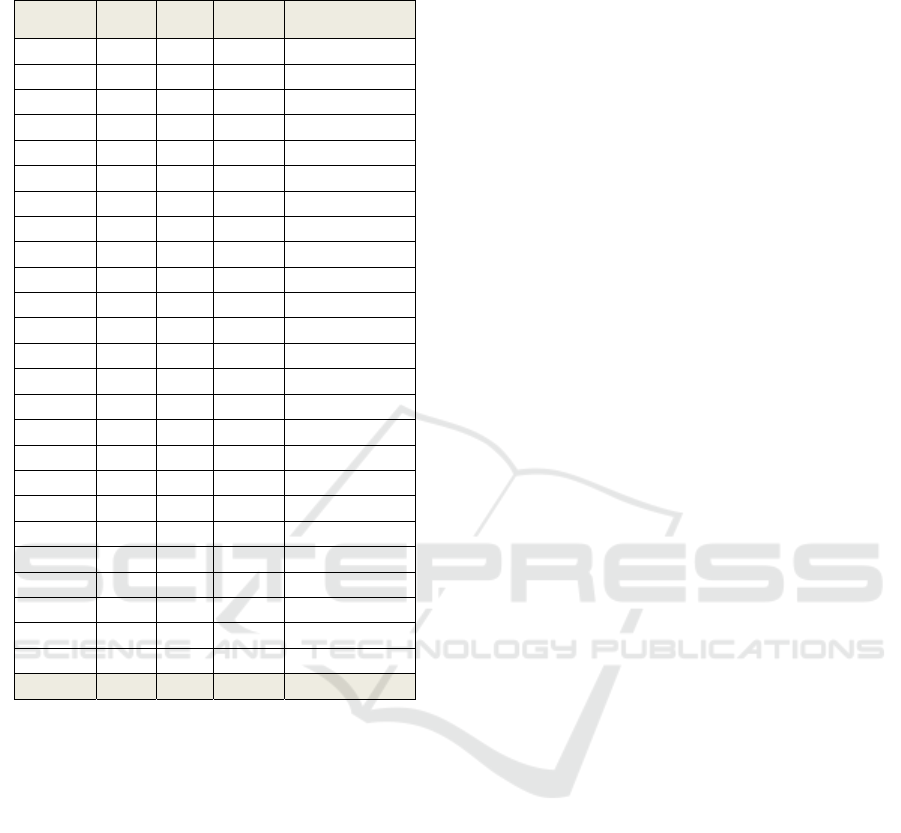
Table 8: Calculation result of Importance Performance
Analysis (IPA).
Attribute (Xi) (Yi)
(Tki)
(100%)
Service Quality
Performance
A1 201 214 94% Excellent
A2 208 221 94% Excellent
A3 199 216 92% Excellent
A4 190 207 92% Excellent
A5 189 214 88% Excellent
A6 214 223 96% Excellent
A7 196 209 94% Excellent
A8 208 219 95% Excellent
A9 201 209 96% Excellent
A10 204 212 96% Excellent
A11 203 209 97% Excellent
A12 199 214 93% Excellent
A13 191 218 88% Excellent
A14 202 212 95% Excellent
A15 201 215 93% Excellent
A16 208 215 97% Excellent
A17 213 215 99% Excellent
A18 206 214 96% Excellent
A19 207 210 99% Excellent
A20 212 217 98% Excellent
A21 203 208 98% Excellent
A22 216 226 96% Excellent
A23 207 208 99% Excellent
A24 215 219 98% Excellent
A25 212 216 98% Excellent
Score 5105 5360 95% Excellent
service provided is less than satisfactory to customers
or the performance provided is far from customer
expectations.
This is in line with research conducted by
Nurhayati, et al (2007), which states that a high level
of importance explains that customers also have high
expectations. The attributes stated in quadrant 1 are
A3 which is a gas usage facility meets the feasibility,
attribute A13 namely PGN provides consultation on
the use of gas clearly and directed and attribute A15
namely PGN quickly answer any information needed
by customers
.
4.7 SWOT Analysis
4.7.1 Internal Factors
Strengths
a. PGN is one of the largest business entities that
distributes natural gas to various customer
segments including SMEs.
b. PGN natural gas quality is safer than other fuels,
because it is lighter than air
c. PGN has many awards for the best service
d. Determination of gas price policy in Batam city
is much cheaper
e. Surcharge-free policy on SMEs customers
Weaknesses
a. Availability of gas infrastructure, especially for
the needs of commercial customers has not been
evenly distributed in all areas in Batam
b. The introduction of natural gas by SMEs
customers is still not optimal
c. The initial investment cost of gas pipeline
installation to SMEs customers (sector
regulators)
d. Lack of socialization from PGN for customers
4.7.2 External Factors
Opportunities
a.
SMEs customer demand for high availability of
natural gas
b. Government support in channeling natural gas in
supporting the sustainability of SMEs in Batam
(SYNERGY OF SMEs)
c. The economic situation in Batam tends to be
stable
d. The growth of SMEs in Batam is very rapid
e. Abundant natural gas reserves
Threats
a. Third parties doing work on gas pipelines may
result in gas pipeline leaks
b. Knowledge of prospective SMEs customers on
natural gas is still low
c. Interference from gas sources or compressors
resulting in a decrease in supply.
d. Licensing of pipeline distribution through
facilities owned or controlled by the community.
4.8 SWOT Diagram
Based on the SWOT analysis diagram it is known that
the company is in the position of quadrant I which is
supporting aggressive strategies that have the same
position of opportunity and strength and make the
company in a strong competitive position. Swot chart
results are presented as follows:
ICAESS 2021 - The International Conference on Applied Economics and Social Science
294
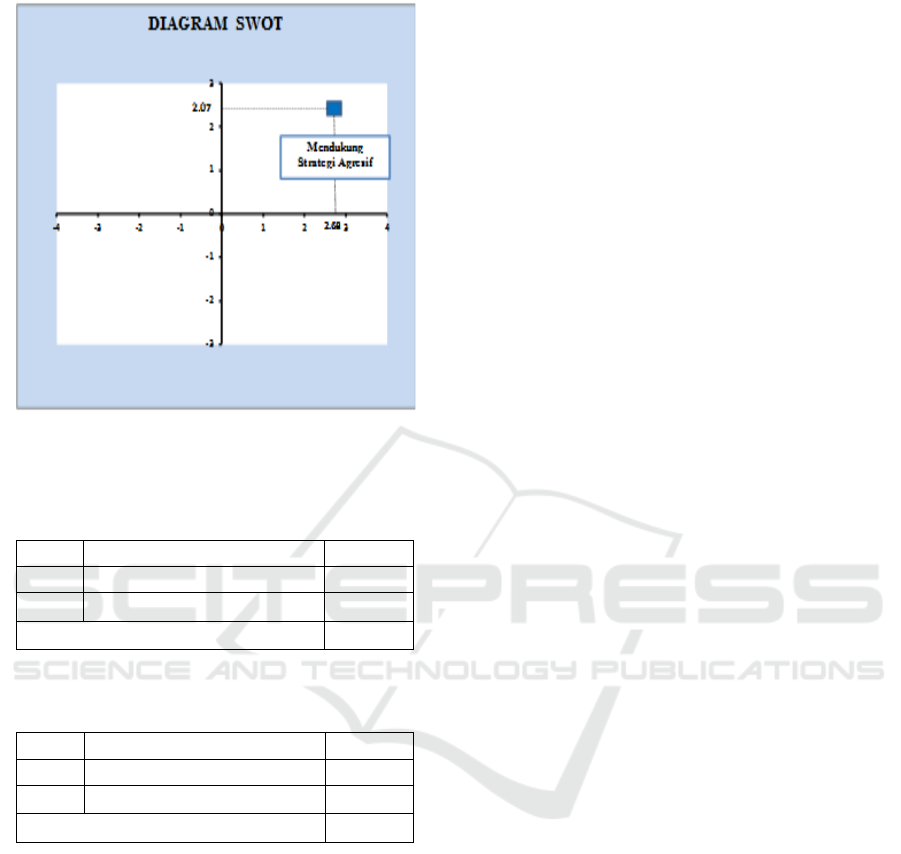
Table 9: SWOT Diagram.
Based on the results of the total average IFAS of
2.68.
Table 9: Based on the results of the total average
IFAS of 2.68.
No Company Strategic Factors Score
1 Strengths Factors 2.99
2 Weaknesses Factors -0.31
Total 2.68
Table 10: the EFAS matrix obtained a total average
of 2.07.
No Company Strategic Factors Score
1 Opportunities Factors 2.58
2 Threats Factors -0.51
Total 2.07
Based on the results of the value gives the
conclusion that placing PT Perusahaan Gas Negara
Sales Area Batam in the position of Cell V namely
Hold and Maintain, this is known through the IE
Matrix. This is in line with research conducted by
Kuncoro (2010), which also obtained the same
results, namely the strategy of maintaining and
maintaining, it is a situation where the company is
experiencing a good growth period and can be
managed with a market penetration strategy and
product type development.
4.9 SWOT Matriks
1. Strategy (SO)
a. Penetration of SMEs customers through
direct or non-direct pipeline connections
b. Determination of efficiency of natural gas
prices that are economical and practical and
subsidy-free to SMEs customers
c. Development of creative and independent
economic programs to SMEs in Batam
through the synergy of companies and
governments
d. Developing gas innovation through
technology as a solution to develop quality
of service and business development
2. Strategy (ST)
a. Supervise and coordinate to third parties and
PU (Public Works) thoroughly on activities
outside the company that is in the pipeline.
b. Education on the introduction and
management of leaks to customers and
improving the company's emergency
response system
c. PGN develops 360 Degree Integrated
Solution service in optimizing customer
service.
d. Publish news of third-party job inspection
events in the pipeline
3. Strategy (WO)
a. Development of natural gas infrastructure
and increasing the use of cradles to supply
gas to areas that have not yet integrated gas
pipelines
b. Provide socialization and education on the
proper use of PGN natural gas in a directed
manner to obtain a safe and economical
energy source
c. Looking for alternatives that can lower the
cost of initial investment so as not to burden
prospective SMEs customers
4. Strategy (WT)
a. Supervise the work of third parties located in
pgn gas infrastructure
b. Introducing clearly and directed about the
use of natural gas through socialization to
SMEs customers
c. Requesting local government assistance in
facilitating the permit of gas pipeline
installation projects that pass through
community owned facilities
Here are some alternatives that can be done PT
Perusahaan Gas Negara Sales Area Batam, namely:
1. Market development, as a strategy that can be
done by the company through the expansion of
Analysis of Customer Satisfaction Level of Small and Medium Micro Enterprises (SMEs) using Importance Performance Analysis (IPA)
Method and SWOT Analysis at PT Perusahaan Gas Negara Sales Area Batam
295

new territories to maximize the distribution of
products and services owned by the company.
2. Market penetration, as a strategy that can be
done by companies through infrastructure
development so that gas distribution is more
widespread to every customer group such as
Commercial and Industrial (KI), Small
Customers (PK) and Small and Medium Micro
Enterprises (SMEs) and Households (RT). This
strategy can be done to increase sales and
maintain the strength of the company.
3. Product development, is a strategy carried out
through new innovations in the distribution of
natural gas this can be done by creating products
and optimizing new products such as Gaslink
(Compressed Natural Gas Products), developing
cradle innovations (Compressed natural gas
cylinders) for the distribution of natural gas to
commercial customers and SMEs
4. Forward, backward and Horizontal integration
It is a strategy that can be done by PGN to
strengthen the company's existence as the main
management of every activity from downstream
natural gas to customers by strengthening the
role as Pertamina's gas sub-holding.
5 CONCLUSION
Based on the results of research that has been
conducted using the Importance Performance
Analysis (IPA) method as well as strategies used in
improving the satisfaction of SMEs customers drawn
the following conclusions:
1. The level of customer satisfaction of SMEs based
on the Importance Performance Analysis (IPA)
method at PT Perusahaan Gas Negara Sales Area
Batam is in the category of very satisfied.
2. Service indicators that need to be improved
based on the Method of Importance Performance
Analysis (IPA) at PT Perusahaan Gas Negara
Sales Area Batam is located in Quadrant I (
Decision Priority-A), namely: Attribute 3
namely: Gas usage facilities meet eligibility,
Attribute 13 that is, PGN provides consultation
on the use of Gas clearly and directed, Attribute
15 namely PGN quickly answer any information
needed by customers
3. The best strategies that can be done in supporting
the customer satisfaction of SMEs based on
SWOT analysis at PT Perusahaan Gas Negara
Sales Area Batam are:
a. Penetration of SMEs customers through
direct or non-direct pipeline connections
b. Determination of efficiency of natural gas
prices that are economical and practical and
subsidy-free to SMEs customers
c. Developing gas innovation through
technology as a solution to develop quality
services and business development
d. Looking for alternatives that can lower the
cost of initial investment so as not to burden
prospective SMEs customers
e. Introducing clearly and directed about the
use of natural gas through socialization to
SMEs customers.
REFERENCES
Sr. Analyst, Industry and Commercial Sales Area.( April
5,2021). Interview Faktor Internal dan Ekternal
Perusahaan. Batam: PT Perusahaan Gas Negara.
Fahrial, R. (2019). Kajian Kinerja Pelayanan Kapal
Penyeberangan Surabaya-Lombok dengan Metode IPA
dan SWOT.
Fandy, T., & Gregorius, C. (2016). Service Quality and
Satisfaction. Yogyakarta: Andi Offset.
Freddy, R. (2006). Teknik Mengukur dan Strategi
Meningkatkan Kepuasan. Jakarta: PT Gramedia
Pustaka Utama.
Ghozali, I. (2018). Aplikasi Analisis Multivariate dengan
Program IBM SPSS 25. Semarang: Badan Penerbit
Universitas Diponegoro.
ir.pgn.co.id. (2019). Open To The World. Jakarta: PGN's
Members.
Juniawan, M. D., Wicaksono, A., & Kusumanigrum, R.
(2018). Kajian Kinerja Pelayanan Sisi Darat Bandara
Banyuwangi Dengan Metode IPA dan SWOT
Kartika, H. (2015). Analisis Kualitas Pelayanan dan
Kepuasan Pelanggan pada jaringan gas bumi Rumah
Tangga.
PT Perusahaan Gas Negara. (2019). Laporan Keberlanjutan
2019. Dipetik 2020, dari Pgn.co.id:
https://ir.pgn.co.id/AssetFiles/Financial/Sustainability/
Laporan%20Keberlanjutan%202019.pdf
PT Perusahaan Gas Negara Tbk. (2017). Buku Pedoman
Tentang Organisasi dan Tata Kerja Strategic Business
Unit Distribusi Wilayah III. Jakarta: PGN's Members.
PT Perusahaan Gas Negara Tbk. (2018). Annual Report
2018 Doors Of Opportunity.
PT Perusahaan Gas Negara Tbk. (2018). Sejarah
Perusahaan.
PT. Perusahaan Gas Negara Tbk. (2018).
Raharjo, R. I. (2018). Strategi Pemasaran Melalui Analisis
Strength Weakness Opportunity Threat (SWOT) Pada
Usaha Penyewaan Lapangan Futsal Di Scudetto Futsal
Banyuwangi.
Rangkuti, F. (2008). Analisis SWOT Teknik Membedah
Kasus Bisnis. Jakarta: PT Gramedia Pustaka utama.
Sugiyono. (2017). Metode Penelitian Kuantitatif Kualitatif
dan R & D. Bandung: Alfabeta.
ICAESS 2021 - The International Conference on Applied Economics and Social Science
296

Sugiyono. (2018). Metode Penelitian Kuantitatif,
Kualitatif, dan R&D. Bandung: Alfabeta.
Supranto, J. (2001). Pengukuran tingkat kepuasan
pelanggan. Jakarta: Bineka Cipta.
Tjiptono, F. (2011). Service Management Mewujudkan
Layanan Prima. Yogyakarta: Andi.
Tjiptono, F. (2015). Strategi Pemasaran. Yogyakarta: Andi.
Tovmasyan, G. (2020). Evaluating The Quality of Hotel
Services Based On Tourist Perceptions and
Expectations The Case Study of Armenia.
Analysis of Customer Satisfaction Level of Small and Medium Micro Enterprises (SMEs) using Importance Performance Analysis (IPA)
Method and SWOT Analysis at PT Perusahaan Gas Negara Sales Area Batam
297
