
The Effect of Tax Awareness, Tax Morale, Tax Sanctions, and Tax
Amnesty Policies on Tax Compliance of Taxpayers in Batam City
Viska Martina and Afriyanti Hasanah
Department of Business Management, Politeknik Negeri Batam, Ahmad Yani Street, Batam, Indonesia
Keywords: Tax Awareness, Tax Moral, Tax Sanctions, Tax Amnesty Policy, Taxpayer Compliance
Abstract: This study aims to determine the effect of tax awareness, tax morale, tax sanctions and tax amnesty policies
on taxpayer compliance in Batam City, especially those registered at the North Batam Pratama Tax Office.
Data collection was carried out by the non-probability sampling method with convenience sampling
technique. The sample of this study with a total of 100 samples. Statistical test methods and data processing
using component based-Structural Equation Modeling (SEM) or Partial Least Square (PLS) using SmartPLS
Version 3. The research findings show that: 1) tax awareness has no significant effect on tax compliance, 2)
tax morale positive and significant effect on tax compliance variable, 3) tax sanctions have no significant
effect on tax compliance, 4) tax amnesty policy (tax amnesty) has a positive and significant effect on tax
compliance.
1 INTRODUCTION
The 1945 Constitution is the guideline for the
Unitary State of the Republic of Indonesia (NKRI)
which controls the implementation of national
development aimed at the welfare of the people, this
is stated in the goal of the founding of the Republic
of Indonesia on Pancasila, namely the realization of
a just and prosperous society. One source of funding
that plays an important role in the implementation
of national development is taxes. Payment is a form
of community obligation to collect development
funds for a country, which aims to benefit the
people through improving public services
(Pattasiana, Noch, Rumukaun, Temalagi, &
Anakota, 2020). Tax contributions to the state
budget in 2019 accounted for 82.5% of total state
revenue. In collecting taxes, the government must
have implemented an integrated system to make it
easier for taxpayers to calculate, report and deposit
their tax obligations, the system is the Self-
Assessment System. There is a consequence that
arises from taxes, namely acts of disobedience or
non-compliance. This unresolved problem may be
caused by the Self-Assessment System feature,
namely the transfer of tasks in calculating taxes
(Saad, 2014). The parameter to determine the level
of tax compliance is using the Tax Ratio. In 2017,
Indonesia's tax ratio was 10.82%, which means it is
still below the standard applied to developing
countries (lower middle income) which should have
a tax ratio of 19%. Causes that affect compliance
include tax awareness, tax morale, tax sanctions, as
well as tax amnesty policies. The government in
Indonesia takes several ways to motivate taxpayers,
one of which is a tax amnesty where the
government provides an opportunity for taxpayers
to pay taxes owed within a certain period without
any fines (Asih, Adi, 2020).
This research refers to Ghani, Hamid, Sanusi, &
Shamsuddin (2020). The thing that distinguishes this
research from previous research is that it is located
in the place or region as well as the variables, where
the reference research takes the title The Effect of
Tax Knowledge, Compliance Costs, Complexity and
Morale Towards Tax Compliance Among Self-
Employed in Malaysia. Based on the gaps in the
description that has been outlined in the
introduction, the researcher is interested in taking
the title "INFLUENCE OF TAX AWARENESS,
TAX MORAL, TAX SANCTIONS, AND TAX
FORGIVENESS POLICY ON TAX
COMPLIANCE WITH TAXPAYER IN BATAM
CITY".
140
Martina, V. and Hasanah, A.
The Effect of Tax Awareness, Tax Morale, Tax Sanctions, and Tax Amnesty Policies on Tax Compliance of Taxpayers in Batam City.
DOI: 10.5220/0010862500003255
In Proceedings of the 3rd International Conference on Applied Economics and Social Science (ICAESS 2021), pages 140-148
ISBN: 978-989-758-605-7
Copyright
c
2022 by SCITEPRESS – Science and Technology Publications, Lda. All rights reserved
2 RESEARCH METHODS
2.1 Data Types and Sources
The model used is a quantitative method based on a
research method that has been determined, namely
the measurement of objective results using statistical
analysis. Data collection techniques using survey
methods and distributing questionnaires to
individual taxpayers in the Batam City area. This
study uses a quantitative approach because it is
theoretical and conducts testing through variable
measurement with objective results using statistical
procedures.
2.2 Research Instruments
Research variables will be measured using a Likert
scale, where the Likert scale is a non-comparative
and unidimensional (measured only one trait)
scaling technique. Researchers use a 5-point Likert
Scale to calculate taxpayer awareness, tax morale,
tax sanctions and tax amnesty with the details:
1) Strongly Agree (SS), score 5
2) Agree (S), score 4
3) Neutral (N), score 3
4) Disagree (TS), score 2
5) Strongly Disagree (STS), score 1.
2.3 Research Location and Object
The location of the research was carried out,
especially in (KPP) the North Batam Pratama Tax
Service Office, Jalan Kuda Laut No. 1 Batu Ampar,
29423, Batam City. The object of this research is to
individuals who are registered and have a Taxpayer
Identification Number (NPWP).
2.4 Sample Quantity Determination
Technique
The total community or population is Individual Tax
Payer totaling 386,614 active taxpayers registered at
the North Batam KPP from 2016-2020. The large
population in this study, the method for sampling is
the convenience method.
2.5 Sampling Technique
The non-probability sampling method was used by
researchers to calculate the sampling and was carried
out using a convenience sampling technique. Where
the technique is a combination of information from
population elements that makes it easy for
researchers to obtain it. The use of this method is
appropriate for use in this type of quantitative
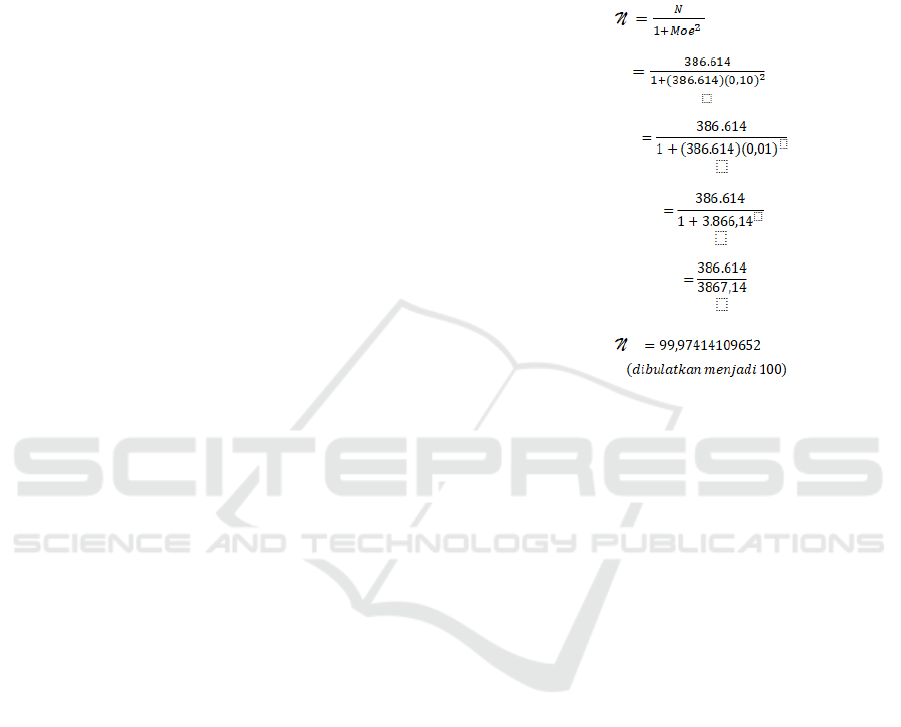
research. Respondents used 386,614 Individual Tax
Payer who are active tax subjects in the KPP, the
following is the slovin formula to determine the
number of samples:
Information :
N = Total Sample
N = Total Population
Moe = maximum margin of error (tolerable error
rate (10%))
2.6 Data Collection Technique
Data collection is only on the category of registered
tax subjects with the sample criteria being taxpayers
for 2016-2020 at KPP Pratama Batam Utara. Before
the questionnaire is distributed to the real
respondents, the questionnaire will first be tested
using a pilot test to 30 respondents.
2.7 Data Analysis Technique
The data is calculated and processed using the
smartPLS version 3 software to produce calculations
that show the effect of the dependent variable and
the independent variable. Analysis of the data
obtained from the questionnaire survey was carried
out using component based-Structural Equation
Modeling (SEM) or Partial Least Square (PLS). PLS
(Partial Least Square) has the advantage of
calculating measurement error for variables that
cannot be measured directly (Hair Jr, Black, Babin,
& Anderson, 2002).
The Effect of Tax Awareness, Tax Morale, Tax Sanctions, and Tax Amnesty Policies on Tax Compliance of Taxpayers in Batam City
141

2.7.1 Descriptive Statistics Test
Descriptive statistics is a data analysis technique that
provides an overview or description of the data of
the object under study in terms of the average value,
standard deviation, maximum, minimum and range
of Ghozali (2016).
2.7.2 The Measurement Model (Outer
Model)
The data is calculated and processed using the
SmartPLS version 3 software to produce
calculations that show the effect of the dependent
variable and the independent variable using the
Partial Least Square (PLS) approach, which is a
component- or variant-based Structural Equation
Modeling (SEM) equation model by testing
Convergent Validity and Discriminant validity. In
addition, to measure the reliability of a construct,
there are 2 ways, namely Cronbach's Alpha and
Composite Reliability.
2.7.3 Convergent Validity Test
The value of convergent validity is said to be valid if
it has a correlation of more than 0.70 with the
construct to be measured. However, according to
Chin (1998) cited by Ghozali (2011) for research in
the early stages of developing a loading factor
measurement scale of 0.50 – 0.60 is considered
sufficient to meet convergent validity.
2.7.4 Construct Reliability Test
The reliability test was carried out to prove the level
of accuracy, consistency and determination of the
instrument in measuring the construct. By using the
smartPLS version 3 program in PLS-SEM, it is done
in 2 ways, namely Composite Reliability and
Cronbach's Alpha. Each is said to be reliable if it has
a value above 0.70.
2.7.5 Structural Model Test (Inner Model)
Evaluation of the structural model on SEM with PLS
is carried out by testing R-squared (R²) and testing
significance through path coefficience (Ghozali,
2018). Changes in the value of R-square are used to
assess the substantive effect of the independent
latent variable on the dependent latent variable.
Hypothesis testing was carried out using the SEM
PLS method through a bootstrapping process which
was processed with the smartPLS version 3
software. If the t-statistical value is greater than the
t-table value (1.96), then there is a significant effect
between a variable and other variables and if the t-
statistical value is less than the t-table value (1.96), it
can be stated that there is no significant effect.
3 RESULTS AND ANALYSIS
3.1 Characteristics of Respondents
Data collection is only on the category of registered
tax subjects with the sample criteria being taxpayers
for 2016-2020 at KPP Pratama Batam Utara.
Questionnaires were given and filled out by 100
respondents which were then tabulated. Of the 100
respondents in the study can be described as follows:
Table 1. Characteristics of Respondents
Characteristi
cs
Category
N
u
m
ber of
Resp
onde
nts
Percenta
ge (%)
Gende
r
Woman 60 60%
Man 40 40%
Total 100 100%
Age 18-24 yo 61 61%
25-31
y
o 23 23%
32-38
y
o 4 4%
39-45 yo 11 11%
>53
y
o1 1%
Total 100 100%
Level of
Education
SMA/SMK 45 45%
D3 17 17%
D4 14 14%
S1 24 24%
Total 100 100%
Profession Enterpreneu
r
11 11%
Private
Emplo
y
ees
62 62%
Government
Emplo
y
ees
3 3%
Other Jobs 24 24%
Total 100 100%
Source: Processed Primary Data Processing, 2021.
3.2 Descriptive Statictical Analysis
The data that has been collected from the results of
the answers to the questionnaire is then tabulated
and processed using the smartPLS version 3
program. So that the resulting variable statistical
descriptions are as follows:
ICAESS 2021 - The International Conference on Applied Economics and Social Science
142

Table 2. Descriptive Statistics
Variable N Mean Medi
an
Min Max Std.
Dev
Tax
Awarene
ss
10
0
3.85 4.00 3.00 5.00 0.726
Tax
Moral
10
0
4.16 4.00 3.00 5.00 0.657
Tax
Sanstion
s
10
0
3.70 4.00 3.00 5.00 1.051
Tax
Amnesty
10
0
3.73 4.00 1.00 5.00 0.929
Tax
Complia
nce
10
0
4.18 4.00 3.00 5.00 0.672
Source: Processed Primary Data Processing, 2021.
3.3 Instrument Testing
3.3.1 Validity Test with Outer Loading
Outer loadings (measurement model) or convergent
validity were used to test the unidimensionality of
each construct. According to Chin (1998) the
indicator value is greater than or equal to 0.5 then it
is said to be valid. Validity testing was conducted on
30 respondents.
3.3.2 Convergent Validity Test
According to Chin (1998) cited by Ghozali (2011)
for the early stage research of developing a loading
factor measurement scale of 0.50 – 0.60 is
considered sufficient to meet convergent validity.
The following are the results of the convergent
validity test in this study:
Table 3. Convergent Validity Test Results
Indicator Tax
Compli
ance
Tax
Awaren
ess
Tax
Morale
Tax
Sanct
ions
Tax
AMnest
y
Kep1 0.834
Kep2 0.805
Kep3 0.772
Kep4 0.777
Kep5 0.803
Kep6 0.777
Kep7 0.784
Kep 8 0.859
Kep 9 0.861
Kep 10 0.799
Kep 11 0.857
Kes1 0.766
Kes2 0.794
Kes3 0.756
Kes4 0.834
Mp1 0.730
Mp2 0.897
Mp3 0.714
Mp4 0.503
Mp5 0.746
Mp6 0.782
Mp7 0.739
Mp8 0.706
Mp9 0.467
Sp1 0.759
Sp2 0.740
Sp3 0.733
Sp4 0.711
Sp5 0.839
Sp6 0.983
Sp7 0.959
Ap2 0.625
Ap3 0.751
Ap4 0.587
Ap5 0.763
AP6 0.796
Source: SmartPLS Data Processing, 2021.
All variable indicator values > 0.5 are declared valid
for the convergent validity test. It can be stated that
all measuring instruments of each variable are the
right tools to measure the variables. The right
measuring instrument means that the respondent
feels that the indicators used are important to
measure these variables.
Table 4. Average Variance Extracted (AVE) Value
Variable Average Variance
Extracted (AVE) Value
Tax Awareness 0.675
Tax Morale 0.623
Tax Sanctions 0.680
Tax Amnest
y
0.701
Tax Compliance 0.725
Source: SmartPLS Data Processing, 2021.
Looking at the results from table 4.5 the AVE value
of all variables is > 0.5 so this shows that each
indicator that has been measured can reflect each
variable validly.
3.3.3 Discriminant Validity Test
The discriminant validity test can be seen from the
correlation value between the variable value and the
variable itself and compares the variable value with
The Effect of Tax Awareness, Tax Morale, Tax Sanctions, and Tax Amnesty Policies on Tax Compliance of Taxpayers in Batam City
143

other variables, namely > 0.70. The following is the
presentation of the correlation value between
variables:
Table 5. Correlation Values between Variables
Tax
amn
esty
Tax
comp
lianc
e
Tax
awarene
ss
Tax
moral
e
Tax
sanction
s
Tax
amne
sty
0.83
7
Tax
compl
iance
0.30
7
0.851
Tax
aware
ness
0.22
1
0.272 0.821
Tax
moral
e
-
0.05
2
0.494 0.176 0.789
Tax
sancti
ons
0.28
8
-
0.196
-0.133 -0.012 0.824
Source: SmartPLS Data Processing, 2021
Besides being able to be seen from the comparison
of correlation values, discriminant validity can also
be seen from the value of Cross Loading which is
presented in the following table.
Table 6. Cross Loading Value
Tax
awaren
ess
Tax
moral
e
Tax
sancti
ons
Tax
amnes
ty
Tax
Compl
iance
Kes1 0.902 0.045 -0.029 0.258 0.283
Kes2 0.852 0.253 -0.254 0.123 0.212
Kes3 0.741 0.198 -0.062 0.135 0.145
Kes4 0.782 0.092 0.004 0.034 -0.009
Mp1 0.275 0.825 -0.116 0.066 0.538
Mp2 0.123 0.841 -0.076 -0.077 0.485
Mp3 0.177 0.729 0.333 -0.151 0.203
MP4 0.182 0.739 0.216 -0.124 0.302
M
p
5 0.142 0.743 0.104 0.091 0.446
M
p
6 0.239 0.773 -0.100 -0.040 0.345
Mp7 0.054 0.718 -0.060 -0.191 0.102
Mp8 -0.039 0.882 -0.070 -0.057 0.377
Mp9 0.019 0.838 -0.126 -0.135 0.334
S
p
1 0.067 0.288 0.759 0.225 -0.066
S
p
2 -0.086 0.014 0.740 0.363 -0.028
Sp3 -0.063 -0.125 0.733 0.307 -0.038
Sp4 0.116 -0.017 0.711 0.348 0.073
Sp5 -0.030 -0.037 0.839 0.388 0.010
S
p
6 -0.111 -0.057 0.983 0.279 -0.194
S
p
7 -0.130 -0.063 0.959 0.305 -0.158
A
p
1 0.102 -0.119 0.486 0.817 0.150
A
p
2 0.144 -0.024 0.443 0.816 0.208
Ap3 0.247 -0.060 0.094 0.887 0.333
Ap4 0.176 0.072 0.223 0.931 0.371
A
p
5 0.232 -0.060 0.187 0.777 0.143
A
p
6 0.205 -0.238 0.195 0.786 0.148
Ke
p
1 0.220 0.439 -0.109 0.361 0.896
Kep2 0.235 0.382 -0.104 0.527 0.851
Kep3 0.308 0.307 -0.233 0.548 0.830
Kep4 0.267 0.363 -0.165 0.242 0.801
Ke
p
5 0.156 0.517 -0.172 0.326 0.881
Ke
p
6 0.207 0.273 -0.268 0.243 0.795
Ke
p
7 0.192 0.291 -0.335 -0.025 0.827
Kep8 0.185 0.410 -0.094 0.136 0.883
Kep9 0.311 0.566 -0.057 0.054 0.833
Kep1
0
0.196 0.486 -0.094 0.144 0.897
Kep1
1
0.254 0.559 -0.246 0.023 0.864
Source: SmartPLS Data Processing, 2021
3.3.4 Construct Reliability Test
The reliability test can be seen from the value of
composite reliability and Cronbach's alpha where the
assessment method is that both values must be above
0.7 then this is a satisfactory or reliable result.
Table 7. Cronbach's Alpha value
Variable Cronbach's Alpha Value
Tax Awareness 0.857
Tax Moral 0.926
Tax Sanctions 0.944
Tax Amnesty 0.918
Tax Compliance 0.962
Source: SmartPLS Data Processing, 2021
If the Cronbach's Alpha value of all variables is
above 0.70, the latent variable in this study is
accurate, consistent and precise and has good
reliability.
Table 8. Composite Reliability Value
Variable Composite Reliability
Value
Tax Awareness 0.892
Tax Moral 0.937
Tax Sanctions 0.936
Tax Amnesty 0.933
Tax Compliance 0.967
Source: SmartPLS Data Processing, 2021
It can be concluded that the data on the variables of
tax awareness, tax morale, tax sanctions, tax
amnesty (Tax Amnesty) are reliable, accurate,
consistent and appropriate so that they can be used
to test the hypothesis.
ICAESS 2021 - The International Conference on Applied Economics and Social Science
144

3.4 Evaluation of the Structural (Inner
Model)
Evaluation of the structural model or inner model
and evaluated using R-Square for the dependent
variable. Changes in the value of R-Square show the
value of the influence of how much the independent
variable affects the dependent variable.
Table 9. R-Square Value
Construc
t
R-Square
(Y) Tax
Compliance
0.447
Source: SmartPLS Data Processing, 2021
The value of the tax compliance variable is 0.447 or
47%. This indicates that the tax compliance
construct is influenced only by 47% by tax
awareness, tax morale, tax sanctions, and tax
amnesty policies (tax amnesty), where the remaining
53% may be influenced by constructs not found in
this study.
3.5 Hypothesis Test
Inner model can be evaluated using t test through
bootstrapping procedure. The significance level used
is 95% (α = 0.05) with a t-table of 1.96. Seeing the
value of t-statistic > t table, if the value of t-statistic
< than 1.96 then the hypothesis is rejected. It can be
seen in table 4.9 the results of path coefficience
(rho) and t-statistics.
Table 10. Hypothesis Test Results
Hypothesis T-
Statistic
T-
Table
Results
H1 Tax
awareness
has a
positive
and
significant
effect on
taxpayer
compliance
0.272 1.96 Rejecte
d
H2 Tax morale
has a
positive
and
significant
effect on
taxpayer
compliance
3.155 1.96 Accep
t
ed
H3 Tax 1.146 1.96 Rejecte
sanctions
have a
positive
and
significant
effect on
taxpayer
compliance
d
H4 Tax
amnesty
has a
positive
and
significant
effect on
taxpayer
compliance
2.061 1.96 Accep
t
ed
Source: SmartPLS Data Processing, 2021
3.6 Data Analysis
3.6.1 The Effect of Tax Awareness on Tax
Compliance
Tax awareness has no significant effect on tax
compliance. In this case it can be concluded that the
awareness of taxpayers in the city of Batam does not
affect the level of taxpayer compliance in paying
taxes. Therefore, it indicates that tax awareness has
not affected taxpayer compliance in carrying out
their tax obligations. According to the researcher,
the government is expected to continue to increase
tax awareness through socialization and providing
transparent information about taxation, but there are
still many taxpayers who do not understand the
rules, systems and tax reporting. In addition, the
government needs to carry out special strategies to
overcome these problems so as to increase taxpayer
compliance. When it comes to attribution theory,
which explains the internal understanding and the
influence of the social environment to the tax agency
will have an impact on the tax assessment, does not
apply to the tax awareness variable. The results of
the study have the same results as research
conducted by Nugroho, Andini & Raharjo (2016)
and Primasari & Hilmi (2016) which shows that tax
awareness has no effect on taxpayer obligations.
However, this study is not in line with the research
of Suyanto & Trisnawati (2016) where the results
obtained are that there is a positive influence
between awareness and fulfillment of taxpayers.
Andini & Raharjo (2016) and Primasari & Hilmi
(2016) which show that tax awareness has no effect
on taxpayer obligations. However, this study is not
in line with the research of Suyanto & Trisnawati
The Effect of Tax Awareness, Tax Morale, Tax Sanctions, and Tax Amnesty Policies on Tax Compliance of Taxpayers in Batam City
145

(2016) where the results obtained are that there is a
positive influence between awareness and
fulfillment of taxpayers. Andini & Raharjo (2016)
and Primasari & Hilmi (2016) which show that tax
awareness has no effect on taxpayer obligations.
However, this study is not in line with the research
of Suyanto & Trisnawati (2016) where the results
obtained are that there is a positive influence
between awareness and fulfillment of taxpayers.
3.6.2 The Effect of Tax Morals on Tax
Compliance
The results of the bootstrapping model analysis
show that H2 is accepted, which states that tax
morale has a significant effect on taxpayer
compliance and has a positive direction. This means
that the higher the tax morale, the higher the tax
compliance of taxpayers in the city of Batam. The
researcher argues that taxpayers in Batam already
have intrinsic motivation and have awareness of the
taxes that have been paid and understand
contributions as citizens through taxes. The results
of this study are related to compliance theory, which
shows that taxpayer compliance in registering,
compliance in reporting tax returns (SPT),
compliance in calculating and carrying out tax
obligations are considered good. The results of the
study support the research that has been carried out
by Asih & Adi (2020), Sriniyanti (2020) and Torgler
(2004) who stated that tax morale had a significant
effect on tax compliance. This is in contrast to the
research conducted by Ramadhan (2017) which
states that tax morale has no effect on tax
compliance of Siola SMEs.
3.6.3 The Effect of Tax Sanctions on Tax
Compliance
The effect of tax sanctions on tax compliance,
judging from the results of bootstrapping testing, it
can be concluded that tax sanctions have no
significant effect on tax compliance. According to
the results of this study, tax subjects have not been
too affected by applicable sanctions, this can also be
caused by a lack of understanding of the tax system
regulations regarding existing tax sanctions because
taxpayers still often repeat the same mistakes when
carrying out tax obligations. In this case the
applicable witness cannot affect the level of taxpayer
compliance and does not provide a deterrent effect.
In the opinion of the researcher, currently tax
sanctions are only considered as legality by
taxpayers in tax regulations, therefore the
government is expected to take action on violations
committed. The results of this study support the
research conducted by Basri et al (2014) and Wati
(2016) that tax sanctions have no significant effect
on taxpayer compliance. In addition, this is in stark
contrast to the research that has been done by
Muliari & Setiawan (2009) and Perdana &
Dwirandra (2020) which in the results of their
research analysis concluded that tax sanctions on tax
compliance have a positive and significant effect on
segmental tax compliance.
3.6.4 The Effect of Tax Amnesty Policy on
Tax Compliance
The results of the bootstrapping model analysis
show that H4 is accepted, there is a significant effect
between tax amnesty policy and taxpayer
compliance (tax amnesty). Then the relationship
between tax amnesty variables on tax compliance
leads to a positive relationship. The researcher
argues, meaning that the existence of a tax amnesty
policy is considered a good policy because the
government has the opportunity to be more honest in
disclosing assets owned by taxpayers and provides
forgiveness for violations committed. In addition,
taxpayers are given the opportunity to correct data or
assets that have not been submitted because they are
not subject to fines by the government for the delay.
With regard to the theory of obedience which is
defined as an act of fulfilling what is ordered by
others, In this study it is proven that taxpayers have
implemented tax amnesty in accordance with what
has been instructed by the government. In line with
the research conducted by Fitria, Abdillah, Prasetyo,
Cahyo, & Burhanudin (2019), Wirawan & Noviari
(2017) and Sriniyanti (2020) the results show that
there is a positive influence between tax amnesty
and tax compliance.
4 CONCLUSIONS
From the results of the analysis that has been carried
out, the following conclusions can be drawn: 1) The
tax awareness variable does not affect the tax
compliance variable of individual taxpayers in
Batam City. 2) The tax moral variable has a
significant effect on the tax compliance variable of
individual taxpayers in Batam City and has a
positive relationship direction. This means that tax
morale is able to increase taxpayer compliance in
fulfilling their tax obligations. 3) The variable of tax
ICAESS 2021 - The International Conference on Applied Economics and Social Science
146

sanctions has no effect on the tax compliance
variable of individual taxpayers in Batam City. This
means that the existing sanctions have not been able
to provide a deterrent effect so that they cannot
increase taxpayer compliance. 4) The variable of tax
amnesty policy (tax amnesty) has a significant effect
on the tax compliance variable of individual
taxpayers in Batam City and has a positive
relationship direction. This shows that taxpayers are
given the trust to disclose their assets and without
being subject to fines so that this can improve
taxpayer compliance. 5) The adjusted coefficient of
determination (Adjusted R-Square) of 0.447 means
that 47% of the level of taxpayer compliance can be
explained by the variables of tax awareness, tax
morale, tax sanctions, and tax amnesty policies.
While the remaining 53% are explained and
influenced by constructs that are not found in this
study. This shows that taxpayers are given the trust
to disclose their assets and without being subject to
fines so that this can improve taxpayer compliance.
5) The adjusted coefficient of determination
(Adjusted R-Square) of 0.447 means that 47% of the
level of taxpayer compliance can be explained by
the variables of tax awareness, tax morale, tax
sanctions, and tax amnesty policies. While the
remaining 53% are explained and influenced by
constructs that are not found in this study. This
shows that taxpayers are given the trust to disclose
their assets and without being subject to fines so that
this can improve taxpayer compliance.
REFERENCES
Asih, K. S., & Adi, I. Y. (2020, Juni). Pengaruh Moral
Pajak, Budaya Pajak, dan Tarif Pajak Terhadap
Kepatuhan Wajib Pajak Badan di KPP Pratama
Bandung Utara. Journal Research Accounting
(JARAC), 1(2), 181-189.
Basri, Y.M, Surya, R.A.S, Fitriasari, R, Novryan, R,
Tania, T.S. 2014. Studi Ketidakpatuhan Pajak : Faktor
yang Mempengaruhinya (Kasus Pada Wajib Pajak
Orang Pribadi yang Terdaftar di KPP Pratama Tampan
Pekanbaru).
sna.akuntansi.unikal.ac.id/makalah/088 PPJK- 19.pdf
Chan, C. W., Troutman, C.S And O’Bryan, D. (2000), An
Expanded Model of Taxpayer Compliance: Empirical
Evidence from the US and Hong Kong, Journal of
International Accounting Auditing and Taxation, 9
(2):83-103
Chin, W. W. (1998). The Partial Least Squares Approach
to Structural Equation Modeling. Lodon: Lawrance
Erlbaum Associates Publisher.
Fisher, R. C., Goddeeris, J. H., & Young, J. C. (1989).
Participation in Tax Amnesties: The Individual
Income Tax. National Tax Journal, 42(1), 15- 27.
Fitria, D., Abdillah, A., Prasetyo, H., Cahyo, I. D., &
Burhanudin. (2019). The Difference of Enterprises
Taxpayers Compliance after Tax Amnesty. Journal of
Economics and Policy, 12(1), 86-99.
Ghani, H. H., Hamid, N. A., Sanusi, S., & Shamsuddin, R.
(2020). The Effect of Tax Knowledge, Compliance
Costs, Complexity and Morale Towards Tax
Compliance Among Self- Employed in Malaysia.
Global Business and Management Research: An
International Journal, 12(1), 18-32.
Ghozali, I. (2011). Aplikasi Analisis Multivariate Dengan
Program SPSS. Semarang: Badan Penerbit Universitas
Diponegoro.
Ghozali, I. (2016). Aplikasi Analisis Multivariete Dengan
Program IBM SPSS 23 (Edisi 8 ed). Semarang: Badan
Penerbit Universitas Diponegoro.
Ghozali, I. (2018). Aplikasi Analisis Multivariete Dengan
Program IBM SPSS 25. Semarang: Badan Penerbit
Universitas Diponegoro.\
Hair, Jr., Black, W., Babin, B., & Anderson, R (2002).
Multivariate Data Analysis. New Jersey: McGraw
Hill.
Kartini, U. (2018). Pengaruh Tax Amnesty dan Sanksi
Perpajakan Terhadap Kepatuhan Wajib Pajak Orang
Pribadi di Kantor Pelayanan Pajak Pratama Kabupaten
Purworejo Pada Tahun 2016. ePrints@UNY, 1-178.
Luttumer, E. F., & Singhal, M. (2014). Tax Morale.
Journal of Economic Perpectives, 28(4), 149-168.
Muliari, N. K., & Setiawan, P. E. (2009). Pengaruh
Persepsi Tentang Sanksi Perpajakan dan Kesadaran
Wajib Pajak Pada Kepatuhan Pelaporan Wajib Pajak
Orang Pribadi di Kantor Pelayanan Pajak Pratama
Denpasar Timur. Jurnal Akuntansi, 1-23.
Nugroho, A., Andini, R., & Raharjo, K. (2016). Pengaruh
Kesadaran Wajib Pajak Dan Pengetahuan Perpajakan
Wajib Pajak Terhadap Kepatuhan Wajib Pajak Dalam
Membayar Pajak Penghasilan. Journal of Accounting,
2(2), 1-13.
Palil, M. R., Md Akir, M. R., & Wan Ahmad, W. B.
(2013). Ther Perception of Tax Payers on Tax
Knowledge and Tax Education with Level of Tax
Compliance : A Study the Influences of Religiosity.
ASEAN Journal of Economics, Magement and
Accounting, 1(1), 118-129.
Pattiasina, V., Noch, M. Y., Rumasukun, M. R., Temalagi,
S., & Anakotta, F. M. (2020, March). Determinants of
Taxpayer Compliance Level : Empirical Study in East
Indonesia. The Journal of Research on the
Lepidoptera, 51(1), 339-351.
Perdana, E. S., & Dwirandra, A. N. (2020, Juni). Pengaruh
Kesadaran Wajib Pajak, Pengetahuan Perpajakan, dan
Sanksi Perpajakan Pada Kepatuhan Wajib Pajak
UMKM. E-Journal Akuntansi, 30(6), 1458-1469.
Pradnyani, N. N., & Utthavi, W. H. (2020). The
effectiveness of tax volunteers in increasing taxpayer
compliance. International Journal of Research in
Business and Social Science, 9(5), 281-284.
The Effect of Tax Awareness, Tax Morale, Tax Sanctions, and Tax Amnesty Policies on Tax Compliance of Taxpayers in Batam City
147

Primasari, & Hilmi, N. (2016, Oktober). Faktor-faktor
yang mempengaruhi wajib pajak orang pribadi yang
melakukan pekerjaan bebas. Jurnal Akuntansi dan
Keuangan, 5(2).
Rahayu, Y. N. (2019, November). Tax Amnesty : Why Is
It Behavior Compliance ? Journal of Applied
Management (JAM), 17(3), 442-450.
Ramadhan, L. Y. (2017). Pengaruh Kesadaran, Moralitas,
dan Budaya Pajak Terhadap Kepatuhan Pajak (Studi
Pada UKM Siola Kota Surabaya). E- Journal
Akuntansi, 3(2), 16-33.
Saad, N. (2009). Fairness perceptions and compliance
behavior: The case of salaried taxpayers in Malaysia
after implementation of the self- assessment system. e-
Journal Tax Research, 8(1), 32-63.
Saad, N. (2014). Tax Knowledge, Tax Complexity and
Tax Compliance : Taypayer's View. Procedia- Social
and Behavioral Sciences, 109, 1069-1075.
Sriniyanti. (2020, July). Pengaruh Moral Pajak, Sanksi
Pajak, dan Kebijakan Pengampunan Pajak Terhadap
Kepatuhan Pajak Wajib Pajak Orang Pribadi. Jurnal
Akuntansi, Ekonomi dan Manajemen Bisnis, 8(1), 14-
23.
Suyanto, & Trisnawati, E. (2016, Juni). The Influence of
Tax Awareness Toward Tax Compliance of
Enterpreneurial Taxpayers and Celengan Padjeg
Program As A Moderating Variable : A Case Study At
The Pratama Tax Office of Wonosari Town. Jurnal
Penelitian Sosial Keagamaan, 10(1), 47-68.
Torgler, B. (2004). Tax Morale in Asian Countries. Center
for Research in Economics, Management and the Arts,
1-34.
Wahl, I., Kastlunger, B., & Kirchler, E. (2010). Trust in
Authorities and Power to Enforce Tax Compliance :
An Empirical Analysis of the "Slippery Slope
Framework". Law & Policy, 32(4), 383-406.
Wati, R. E. 2016. Pengaruh Pengetahuan, Modernisasi
Strategi Direktorat Jenderal Pajak, Sanksi Perpajakan,
Kualitas Pelayanan Fiskus dan Religiusitas yan
Dipersepsikan terhadap Kepatuhan Perpajakan.
Skripsi. Fakultas Ekonomi dan Bisnis Universitas
Muhammadiyah Surakarta
Wirawan, I. B. N. A. P., dan N. Noviari. 2017. Pengaruh
Penerapan Kebijakan Tax Amnesty dan Sanksi
Perpajakan Terhadap Kepatuhan Wajib Pajak. E-
Jurnal Akuntansi Universitas Udayana, Vol. 21 No. 3,
pp. 2165-2194.
ICAESS 2021 - The International Conference on Applied Economics and Social Science
148
