
Effect of Liquidity and Leverage on Profitability of Agricultural
Sector Companies Listed on the IDX
Bunga Anisya Sunarta and Dedi Kurniawan
Department of Managerial Accounting, Politeknik Negeri Batam, Jl. A. Yani, Batam, Indonesia
Keywords: Current Ratio, Debt to Equity Ratio, Return on Assets, Return on Equity
Abstract: This research aims to see how liquidity and leverage affect profitability in agricultural sector companies in
Indonesia. Liquidity is measured by Current Ratio (CR), leverage as measured by Debt to Equity Ratio (DER),
and company profitability is measured by Return on Assets (ROA) and Return on Equity (ROE). This study
uses secondary data with data collection techniques using financial statements of agricultural sector
companies listed on the Indonesia Stock Exchange from 2015-2019. Purposive sampling was used as a
methodology in this study, and 15 companies match with the criteria. The test method in this study uses panel
data regression analysis with Eviews 9. This study found that the CR has an insignificant impact on ROA and
ROE in the agriculture sector. This study also found that the DER has an insignificant effect on ROA but
significantly negatively impacts ROE in the agriculture sector. Simultaneously, CR and DER have an impact
on ROA and ROE.
1 INTRODUCTION
Indonesia is an agrarian country that makes the
agricultural sector one of the pillars of the country's
economy. Indonesia has enormous natural resource
potential. Indonesia's strategic geographical
conditions support the quality of Indonesia's natural
resource potential. The agricultural sector can
become a food supplier, a provider of industrial raw
materials, a provider of employment, and a source of
state income. The agricultural sector contributes
significantly to national economic growth.
According to Statistics Indonesia (2020), the
agricultural sector's Gross Domestic Product (GDP)
is the total value added of services and goods
produced by each production sector in the agricultural
sector. GDP at current prices can be called the
distribution of GDP. This indicator shows the
economic structure of a country or the role of each
category of economic business. The most important
category in the field of economic business represents
the economic base of a country. The GDP of the
agricultural sector at current prices by business field
(billion rupiahs) from 2015 to 2019 has always
increased. In 2019 there was an increase of 112,828.3
to 2,013,626.9 compared to 2018 which was
1,900,803.6. The development every year shows an
increase which indicates an increase in the
performance of the agricultural sector.
The primary purpose of establishing a company is
to get the highest profit. Kieso et al., (2012) state that
profitability measures the level of success or failure
of a particular company or division for a certain
period. Based on some of the explanations above, it
can be concluded that profitability measures the
company's ability to earn profits and manage
financial policies and operating decisions efficiently.
The higher the percentage of profitability, the better.
Return on Equity (ROE) is the ratio of net profit to
total equity (Brigham & Houston, 2019). Investors
frequently use this ratio to assess a company's
profitability before investing. The return on equity
(ROE) measures a company's capital efficiency. This
ratio should be as high as possible. If the return on
investment (ROI) rises, the company's profitability
improves.
The ratio of net income to total assets, or return
on assets (ROA), evaluates the return on total assets
after interest and taxes (Brigham & Houston,
2019).ROA is used to measure how the company
utilizes the assets owned by the company to generate
profits. ROA has the advantage that it can be easily
understood and calculated as a parameter of the
company's performance in utilizing the assets owned
by the company to gain profits or as an evaluation of
Anisya Sunarta, B. and Kurniawan, D.
Effect of Liquidity and Leverage on Profitability of Agricultural Sector Companies Listed on the IDX.
DOI: 10.5220/0010861600003255
In Proceedings of the 3rd International Conference on Applied Economics and Social Science (ICAESS 2021), pages 117-125
ISBN: 978-989-758-605-7
Copyright
c
2022 by SCITEPRESS – Science and Technology Publications, Lda. All rights reserved
117

the implementation of policies or strategies that the
company has implemented.
The level of liquidity can measure the
performance of fulfilling the company's short-term
debts. Effective use of assets can be good liquidity
management. Current Ratio (CR) represents the
fulfillment of current assets to current liabilities. If
this ratio is high, it means that the capacity of its
current assets can pay its short-term debts. Otherwise,
a ratio decrease below or less indicates that its current
assets cannot pay its current liabilities. Suppose the
liquidity deficit can lead to a decrease in corporate
performance, which can impact profitability. If the
ratio is equal to 1, current assets are the same as
current liabilities (Robinson et al., 2015).
According to Brigham & Houston (2019),
leverage is debt to concentrate a company's business
risk on its shareholders. The amount of debt used in a
company's capital structure is measured by financial
leverage. According to the following description,
financial leverage is the use of debt to concentrate risk
to enhance the rewards accessible to shareholders.
According to Robinson et al., (2015), Debt to Equity
Ratio (DER) is a debt and total equity ratio that
indicates a company's ability to cover all liabilities
with its capital. The higher the performance, the
lower the percentage of this ratio.
The use of debt for the company is expected to
provide a higher return on profits. If the debt is too
high, it can lead to bankruptcy when the company
cannot pay its debts. A current ratio that is either too
low or too high is not a positive thing. A low current
ratio implies that a company's short-term debt is
unpayable. A high current ratio shows the quantity of
idle money that is not being used efficiently for the
company's commercial objectives, causing
profitability to suffer. The problem that the author
will answer, based on the previous description, is how
leverage and liquidity affect the profitability of
agriculture sector firms.
2 THEORETICAL STUDY
2.1 Stewardship Theory
Stewardship theory illustrates a situation where
managers aim at achieving their primary goals, not for
personal goals but common or organizational goals.
In general, senior managers are trained to become
managers who are willing to behave in line with the
management's goals, yet, manager's conduct will not
overrule the organization's goals since managers
work hard to accomplish them (Donaldson & Davis,
1991). The implementation of the theory in this study
is that managers are believed to be able to take the
best actions for the benefit of the company and
stakeholders. Managers are expected to achieve the
company's goals, namely the highest profitability, by
maintaining the company's finances stable.
2.2 Literature Review
Based on previous research, Irman et al., (2020),
stated that the Current Ratio (CR) had a positive and
significant effect on Return on Assets (ROA). The
high level of CR indicates that the company is more
liquid because of its ability to pay the short-term debt.
Samo & Murad, (2019) revealed that there is a
positive relationship between liquidity and
profitability. A corporation that correctly manages its
daily cash operations can earn a high return on assets
and equity. Companies with a lot of debt and leverage
are vulnerable to risk and can't make much money.
Thus a manager should focus on equity rather than
debt financing. Felani & Worokinasih (2018)
revealed that the increase in the value of debt on
company capital used more loans. If the debt is high,
this will increase interest expense which causes taxes
to be smaller and increase profits, causing ROA and
ROE levels to increase. This study also reveals that
when the CR level is high, the company's chances of
paying its short-term debts are also high. The
relationship seen from CR and ROA and ROE is that
the higher the company's CR, the better the
company's profit (ROA & ROE).
Hidayat & Batubara (2019) reveals that when the
company's Current Ratio increases, the company
cannot get high profits because there is raw material
inventory and work in process inventory which
includes current assets that are not ready to be sold. It
can make the company not profit but instead spends
money on expenses care. According to research by
Mahardhika & Marbun (2016) which used a sample
of PT Bank Mandiri and its subsidiaries for the period
2008-2015, it was stated that CR had a significant
positive effect on ROA. Nasution's research (2016)
using a sample of automotive companies on the IDX
reveals that the relationship between DER and ROE
is opposite and has no significant effect. If the DER
value increases, the company's profits and
profitability or ROE will decrease.
Herlina & Winingsih (2016) stated that CR
significantly affects ROE, and DER has no significant
effect on ROE. CR and DER simultaneously have a
significant effect on ROE. (Putra & Badjra, 2015)
found a positive relationship between CR and ROA.
Current assets, in general, and networking capital, in
ICAESS 2021 - The International Conference on Applied Economics and Social Science
118

particular, benefited from the increase in return on
assets. According to Putra & Badjra (2015), leverage
has a negative and significant impact on profitability,
indicating that leverage and profitability have a
negative relation. Widiyanti & Elfina (2015) reveal
that when the company's DER level is high, the
company's burden on outside parties, in this case,
creditors, will be even more significant. If this
happens, it can cause a decrease in profit, but this does
not significantly impact the company
2.3 Hypothesis Development
2.3.1 Effect of Current Ratio on Return on
Assets
Effective asset and debt control can help companies
achieve maximum profit. A low current ratio
indicates that the company lacks the capital to meet
short-term debts. Still, a high current ratio indicates
that the amount of unused funds is not optimally used
for the company's needs, thereby reducing
profitability (Saleem & Rehman, 2011). According to
previous research, Irman et al. (2020) stated that CR
had a positive and significant effect on Return on
Assets (ROA). If a corporation wants to increase its
return on investment, it must enhance asset
management to generate profits. Samo & Murad
(2019) mentions that a company that appropriately
fulfills its daily cash operations can get high returns
on assets. Durrah et al. (2016), Felani & Worokinasih,
(2018), Madushanka & Jathurika (2018) also state the
same thing, that CR has a positive and significant
relationship to ROA. The following hypothesis is
made based on the previous description:
asset and debt control can help companies achieve
H1a: Current Ratio has a significant positive
effect on Return on Assets
2.3.2 Effect of Current Ratio on Return on
Equity
Felani & Worokinasih, (2018), in their research,
found that CR has a significant positive effect which
indicates the higher the CR, the better the ROE value
of the company. Herlina & Winingsih (2016) also
revealed that CR has a positive relationship and
significantly affects ROE. The following hypothesis
is made based on the previous description:
H1b: Current Ratio has a significant positive
effect on Return on Equity
2.3.3 Effect of Debt to Equity Ratio on
Return on Assets
Irman et al. (2020), in their research state, that the
Debt to Equity Ratio (DER) to Return on Assets
(ROA) and states that companies with high
profitability will reduce the need to use debt because
there are more funds available. This research is also
supported by Putra & Badjra (2015), which reveals
that profitability will decrease if leverage increases.
The following hypothesis is made based on the
previous description:
H2a: Debt to Equity Ratio has a significant
negative effect on Return on Assets
2.3.4 Effect of Debt to Equity Ratio on
Return on Equity
Ulzanah & Murtaqi (2015) find that companies with
higher DER are considered riskier because when the
company uses more debt than the amount of equity, it
will cause a decrease in profit. The high amount of
debt makes the interest expense higher and has an
impact on declining profitability. Nasution (2016)
reveals that the effect of DER on ROE is the opposite,
where if the DER value increases, the return on equity
will decrease. Putra & Badjra (2015) in their research
also says that if leverage increases, profitability will
decrease. Widiyanti & Elfina (2015) reveal that when
the company's DER level is high, the company's
burden on outside parties, in this case, creditors, will
be even more significant. If this happens, it can lead
to a decrease in the profitability of the company. The
following hypothesis is made based on the previous
description:
H2b: Debt to Equity Ratio has no significant
negative effect on Return on Equity
3 RESEARCH METHOD
This research applied a quantitative method, which is
a method of research that structured, systematic, and
planned research aimed at proving the influence
between the dependent and independent variables.
The leverage ratio, represented by the Debt to Equity
Ratio (DER), and the liquidity ratio, represented by
the Current Ratio (CR), is the independent variables
used. Profitability is the dependent variable defined
by Return on Assets (ROA) and Return on Equity
(ROE). The operational variables and indicator can be
seen in table 1:
Effect of Liquidity and Leverage on Profitability of Agricultural Sector Companies Listed on the IDX
119
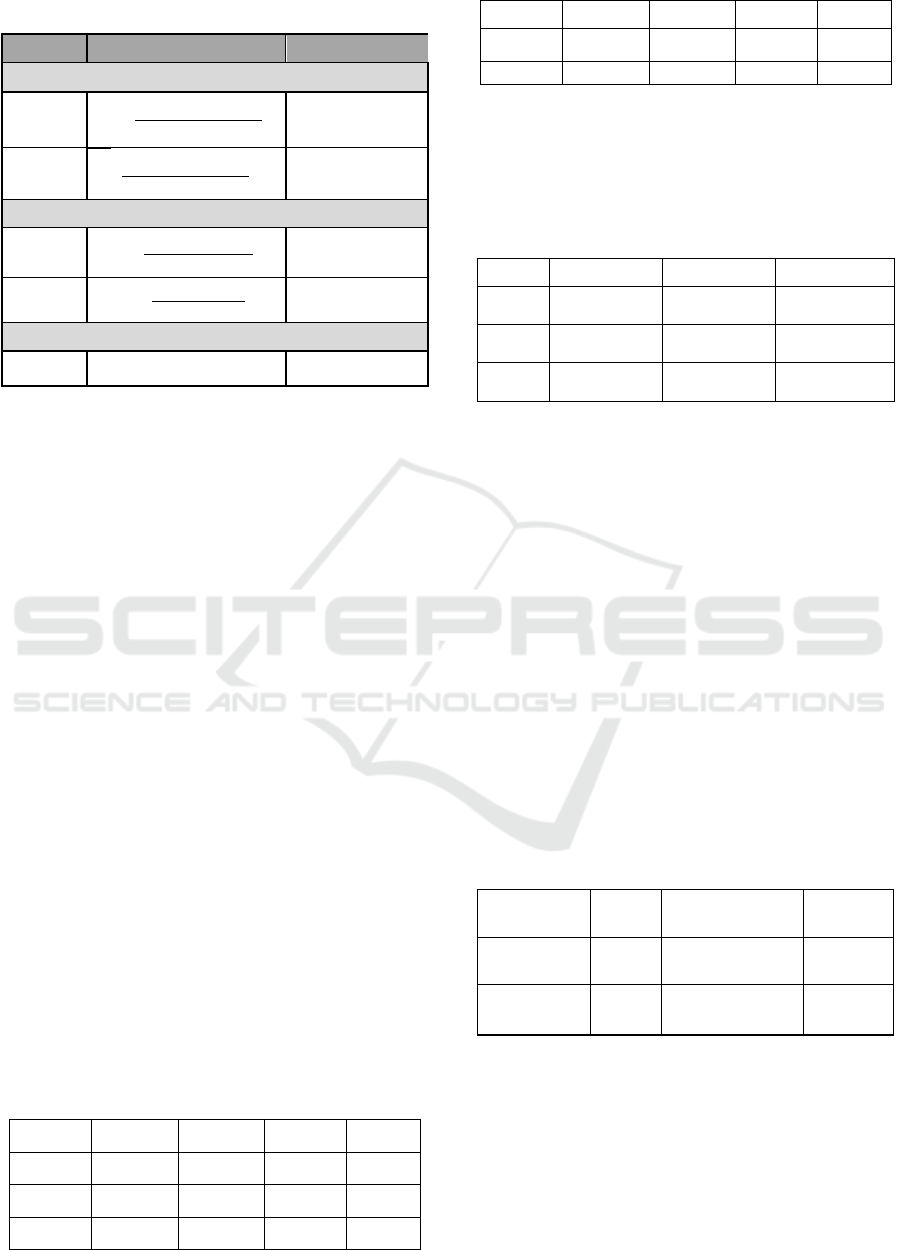
Table 1: Operational variables and indicator
Variable Indicator Source
Dependent Variable
ROE =
Ne
t
Income After Tax
Total Equit
y
(Brigham &
Houston, 2019)
ROA =
Ne
t
Income After Tax
Total Asse
t
(Brigham &
Houston, 2019)
Independent Variable
CR =
Curren
t
Assets
Curren
t
Liabilities
(Robinson et al.,
2015)
DER =
Total Liabilities
Total Equit
y
(Robinson et al.,
2015)
Control Variable
SIZE = Ln Total Assets
(Robinson et al.,
2015
)
The object in this study is the financial statements
of agricultural sector companies in the 2015-2019
period listed on the IDX. The total population of
agricultural sector companies listed on the Indonesia
Stock Exchange is 21 companies, with a sample of 15
companies. Panel data regression analysis is applied
as a data analysis method using E-Views 9 software.
Descriptive statistical analysis will be used in this
study. Determination of the estimation model using
the Chow test and Hausman test. Multicollinearity
and heteroscedasticity tests were applied in this study
as classical assumption tests. The hypothesis tests
used in this study are coefficient of determination,
partial test (t-test), and simultaneous test (f test).
4 RESULT
The population data used in this study are agricultural
sector companies listed on the IDX from 2015 to
2019, with 21 companies. The criteria of the research
sample reduce this amount. The total sample for
2015-2019 that meets the criteria is 15 companies or
75 data samples.
4.1 Descriptive Statistical Analysis
Below is a descriptive statistical analysis table:
Table 2: Descriptive statistical table
Variable Mean Max Min Std.Dev
ROA 0.00307 0.8562 -0.582 0.1491
ROE -0.00046 1.0310 -1.352 0.2953
CR 1.58497 6.7720 0.0990 1.6098
DER 1.18429 11.273 -10.314 2.3788
SIZE 29.4856 33.002 26.435 1.3029
Sample 75 75 75 75
Source: Data processed with Eviews 9, 2021
4.2 Classic Assumption Test
4.2.1 Multicollinearity Test
Table 3: Multicollinearity test
CR DER SIZE
CR 1.00000 -0.1035 -0.12497
DER -0.10359 1.0000 -0.01119
SIZE -0.12497 -0.01119 1.00000
Source: Data processed with Eviews 9, 2021
The multicollinearity test is used to determine
whether or not the independent variables have a linear
relationship. Table 3 displays the output results.
According to table 3, the correlation coefficient
between variables is less than 0.8. This value
indicates that there are no multicollinearity
abnormalities in the data in this research.
4.2.2 Heteroscedasticity Test
The Breusch-Pagan-Godfrey test was used to
determine heteroscedasticity in this study. The test's
output findings are presented in table 4. Table 4
reveals that the Obs *R-Squared value is 3.131149,
and the probability value is 0.37180, which is larger
than the alpha value (5 percent), indicating that the
data is not heteroscedastic.
Table 4: Heteroscedasticity test Breusch-Pagan-Godfrey
F-Statistic 1.0310
Prob F. (3.71) 0.3841
Obs*R-
squared
3.1311
Prob. Chi-
Square(3)
0.3718
Scaled
explained SS
24.373
Prob. Chi-
Square(3)
0.0000
Source: Data processed with Eviews 9, 2021
4.3 Model Selection
4.3.1 Chow Test
This test aims to see whether the fixed effect or
common effect model is more suitable for this study.
The results of the chow test can be seen as follows:
ICAESS 2021 - The International Conference on Applied Economics and Social Science
120

Table 5: Chow Test (Dependent ROA)
Effect Test
Statistic d.f. Prob
Cross-
section F
2.86680 -14.57 0.00250
Cross-Section
Chi-Square
39.9789 14 0.00030
Source: Data processed with Eviews 9, 2021
Table 6: Chow Test (Dependent ROE)
Effect Test
Statistic d.f. Prob
Cross-
section F
5.195019 -14.57 0.00000
Cross-Section
Chi-Square
61.680464 14 0.00000
Source: Data processed with Eviews 9, 2021
The probability value of the chi-square cross-
section on the dependent ROA is 0.0003, and the
dependent ROE is 0.0000, as shown in tables 5 and 6.
The chi-square cross-section probability value is less
than the alpha level (5 percent). The Chow test
findings for dependent ROA and ROE showed that
the fixed effects model is better suitable for this
research than the common effect model.
4.3.2 Hausman Test
This test aims to determine the suitable model
between fixed effect or random effect.
Table 7: Hausman Test (Dependent ROA)
Test Summary
Chi-Sq.
Statistic
Chi-Sq.
d.f.
Pro
b.
Cross-section
random
12.13296 3
0.00
69
Source: Data processed with Eviews 9, 2021
Table 8: Hausman Test (Dependent ROE)
Test Summary
Chi-Sq.
Statistic
Chi-Sq.
d.f.
Prob.
Cross-section
rando
m
14.7723 3 0.0068
Source: Data processed with Eviews 9, 2021
The probability value of the random dependent
ROA cross-section is 0.0069, and the dependent ROE
is 0.0068, as shown in tables 7 and 8. Because the
random cross-section probability value is less than the
alpha level (5%), the Hausman test findings indicate
that the fixed effect model is better to use than the
random effect model.
4.4 Panel Data Regression Analysis
4.4.1 Panel Data Regression Analysis
(Dependent ROA)
Table 9 shows the results of panel data regression
using the Fixed Effect Model with dependent ROA:
Table 9: Fixed Effect Model (Dependent ROA)
ROA
Variable Coefficient t-statistic Prob.
C 3.597273 3.231591 0.002
CR 0.01624 0.836799 0.4062
DER 0.007623 1.27109 0.2089
SIZE -0.123076 -3.27732 0.0018
R-Squared
0.54973
Adjusted
R-Squared
0.41545
Prob (F-
Statistic)
0.00003
N
75
Model
Fixed
Source: Data processed with Eviews 9, 2021
The following equation can be developed from
the panel data regression results:
ROAt = 3,597273 + 0,01624CRt +
0.007623DERt – 0,123076SIZEt
4.4.2 Panel Data Regression Analysis
(Dependent ROE)
The following table 10 shows the results of panel data
regression using the Fixed Effect Model with
dependent ROE:
Table 10: Fixed Effect Model (Dependent ROE)
ROE
Variable Coefficient t-statistic Prob.
C 0.522169 0.330185 0.7425
CR 0.002552 0.092565 0.9266
DER -0.073764 -8.65702 0.0000
SIZE 0.014899 -0.27926 0.7811
R-Squared 0.768540
Adjusted R-
Squared
0.699267
Prob (F-Statistic) 0.000000
N 75
Model Fixed
Source: Data processed with Eviews 9, 2021
Effect of Liquidity and Leverage on Profitability of Agricultural Sector Companies Listed on the IDX
121

From the results of the panel data regression, the
following equation can be obtained:
ROE
t
= 0,522169+ 0,002552CR
t
–
0,073764DER
t
+ 0,014899SIZE
t
4.5 Coefficient of Determination
Table 9 shows the findings of the coefficient of
determination using the dependent variable ROA. In
the table, the Adjusted R-Squared value is 0.41545, or
41.54 percent. This number shows that the dependent
variable's size (ROA) can explain 41.54 percent of the
independent variable (CR, DER) and control variable
(SIZE) variance, with the remaining 58.46 percent
explained by factors outside the study model.
Table 10 shows the findings of the coefficient of
determination using the dependent variable ROE. In
the table above, the Adjusted R-Squared value is
0.699267, or 69.93 percent. This number means that
the value of the dependent variable (ROE) can explain
69.93% of the independent variable (CR, DER) and
control variable (SIZE), with the remaining 30.07%
explained by factors outside the research model.
4.6 F Test
Table 9 shows the results of the F test in this study
using the dependent variable ROA. The probability
value (F-statistic) is 0.000003, which is less than the
alpha level in the F test with the dependent ROA. As
a result, CR, DER, and firm size (SIZE) all impact
ROA at the same time.
Table 10 shows the results of the F test using the
dependent variable ROE in this study. The probability
value (F-statistic) is 0.00000, and the value is alpha
level, according to the findings of the F test with
dependent ROE. As a result, CR, DER, and firm size
(SIZE) all impact ROE at the same time.
4.7 Data Analysis
The following is a summary table of test results from
this study:
Table 11: Summary of test result
Hypothesis Prob. Coeff. Result
H
1a
CR has
significantly
p
ositive effect on
ROA
0.4062
0.0162
4
Not
Supported
H
1b
CR has
significantly
p
ositive effect on
ROE
0.9266
0.0025
5
Not
Supported
H
2a
DER has
significantly
negative effect
on ROA
0.2089
0.0076
2
Not
Supported
H
2b
DER has
significantly
negative effect
on ROE
0.0000 -0.0738 Supported
Source: Data processed with Eviews 9, 2021
2.3.5 Effect of Current Ratio on Return on
Assets
Based on the hypothesis 1a test, which can be seen in
Table 9, it shows that liquidity, as measured by CR,
does not have a significant positive effect on ROA.
These results are contrary to hypothesis 1a, which
states that CR has a significant positive effect on
ROA. This result is evidenced by the probability
value, which shows a value of 0.4062 which means
that this value is greater than the alpha level of 5%.
The coefficient value of 0.01624 indicates a positive
direction, indicating that the relationship between CR
and ROA is unidirectional; however, CR is not an
essential element that might affect ROA because the
influence is low. This study's findings are consistent
with those of Madushanka & Jathurika (2018) and
Jati & Andini (2019), who found that CR is beneficial
but has no significant impact on ROA. This study is
consistent with the findings of Hantono (2018) study,
which found that a greater CR can only suggest that a
company's capacity to pay off short-term debt using
current assets is greater, but it has no impact on
profitability.
The amount of liquidity in a firm does not always
imply improving or reducing its profitability. The
component of the current ratio includes other non-
cash assets that may take longer to convert, such as
receivables and inventories held by agricultural
companies. Agricultural companies certainly have so
many supplies such as raw materials, plants, animals,
and others. Large receivables and inventories will
take longer to convert into cash. For example, BISI
International company in 2016 had the highest current
ratio in agricultural sector companies during the
2015-2019 period. Total receivables and inventories
for the year amounted to 1,638,232,000,000. The
amount is quite significant because the figure
represents 80.2% of the total current assets for the
year. We also see the company with the lowest
Current Ratio during the 2015-2019 period, namely
PT Bakrie Sumatera Plantations Tbk. In 2016. The
company's total receivables and inventories in that
year amounted to 838,237,330,000. This amount is
also quite large because the percentage is 82.5% of
ICAESS 2021 - The International Conference on Applied Economics and Social Science
122

the total current assets in that year. This amount can
also hamper the company's operating activities aimed
at increasing its profits due to the unavailability of
sufficient cash or cash equivalents for its operations
and productivity. So the level of liquidity does not
affect the profitability.
4.7.1 Effect of Current Ratio on Return on
Equity
Based on the hypothesis 1b test in table 10, it shows
that liquidity, as measured by CR, has no significant
positive effect on ROE. These results are contrary to
hypothesis 1b, which states that CR has a significant
positive effect on ROE. This result is evidenced by
the probability value, which shows a value of 0.9266,
which is greater than the alpha level of 5%. The
coefficient value of 0.002552 indicates a positive
direction indicating that the relationship between CR
and ROE is unidirectional. Still, CR is not the main
factor that can affect ROE because the effect is not
significant.
The results of this study follow the results of
research by Rahmah & Asnawi, (2019) and
Pongrangga et al. (2015), which state that there is no
need to consider the current ratio because it has no
significant effect on the company's ROE.
Madushanka & Jathurika (2018) and Saleem &
Rehman (2011) also state that CR has no significant
effect on ROE.
4.7.2 Effect of Debt to Equity Ratio on
Return on Assets
The hypothesis 2a test in table 9 shows that liquidity,
as measured by DER, has no significant effect on
profitability as measured by ROA. These results are
contrary to hypothesis 2a, which states that DER has
a significant negative effect on ROA. This result is
evidenced by the probability value, which shows a
value of 0.2089, which is greater than the alpha level
of 5%. The findings of this study are consistent with
those of Samo & Murad (2019), who found that DER
had no significant impact on ROA. According to
Irman et al., (2020), the company's DER level had no
significant impact on the return on its assets. The
debt-to-equity ratio compares debt and equity in a
company's funding that illustrates the company's
capital ability to pay off all of its debts.
We can see that the average DER of
agricultural sector companies for the 2015-2019
period is 1.18429. A total of 36 samples are below the
average value, and most of them have a value below
1. A DER value below 1 indicates that the company's
capital is more significant than its debt to cover its
debts and does not affect the company's assets for
repayment—corporate debt to agricultural sector
companies. Thus, DER is not a significant factor in
increasing or decreasing returns on assets in
agricultural companies.
4.7.3 Effect of Debt to Equity Ratio on
Return on Equity
Based on the hypothesis 2b test in table 10, as
measured by DER, liquidity has a significant negative
effect on profitability as measured by ROE. These
results align with hypothesis 2b, which states that
DER has a significant effect on ROE. This result is
evidenced by the probability value showing a value
of 0.0000 and this value < 5% alpha level. The
coefficient value of -0.0764 indicates a negative
direction which indicates the relationship between the
two is opposite, which if the DER increases, the ROE
will decrease. This study's results follow the results of
research by Samo & Murad (2019) and Hantono
(2015), which state that DER has a negative and
significant effect on ROE. Putra & Badjra (2015)
show that DER is one of the main factors that affect
ROE because it has a significant effect.
When the company has a high rate of return on
equity, the company will be minimal in using debt
because the company has more internal funds owned.
When the company has high debt, the company will
experience a decrease in its return on equity. This
result is evidenced by the average ROE of
Agricultural Sector Companies for the 2015-2019
period of -0.00046 and the average DER of 1.18429.
An ROE below one or even minus indicates a low
return on equity, and a DER greater than one indicates
that the company uses its debt more than its capital.
DER shows how a part of each capital is used as
rupiah collateral for the debt. When the DER level is
higher, the debt will be higher, then the effect on ROE
is that the company's ability to earn profits will be
disrupted because the capital owned by the company
will be used to pay debt and interest. If the company
is in debt, the company will focus on paying off the
company debt. Poor debt management can interfere
with company productivity. Thus, DER is one of the
main factors affecting the profitability of agricultural
companies, as reflected in the company's ROE.
5 CONCLUSIONS
Based on the research results, it was found that CR
had no significant positive effect on ROA and ROE
in agricultural sector companies. Other non-cash
Effect of Liquidity and Leverage on Profitability of Agricultural Sector Companies Listed on the IDX
123

assets such as inventory and accounts receivable
owned by the company will take time to convert into
cash. The increase in trade receivables and cash can
occur due to increased sales. CR increases, ROA, and
ROE also increase, but this is not a significant factor
in the profitability of agricultural sector companies.
DER does not have a significant positive effect on
ROA but has a significant negative effect on ROE. In
the agricultural sector, the increase or decrease in the
DER does not significantly affect the company's
ROA because the equity owned by the company can
still pay off its debts, so the company does not need
to use company assets to pay off debts. In contrast,
DER in the agricultural sector has a significant
negative effect on ROE for companies in the
agricultural sector. The company's ability to generate
profits will be disrupted because the company's
capital is used to pay off the company's loans. As a
result, the DER level has a significant impact on
equity in agricultural firms. If the company is in debt,
the focus will be on paying the debt. Debt
management can disrupt the company's activities and
production. Therefore, it is necessary to have good
debt management in agriculture sector companies so
that the capital owned is used to pay off company debt
and achieve maximum profit.
REFERENCES
Brigham, E. F., & Houston, J. F. (2019). Fundamentals of
Financial Managements (5th ed.). Cengage Learning.
Donaldson, L., & Davis, J. H. (1991). Stewardship Theory
or Agency Theory: CEO Governance and Shareholder
Returns. Australian Journal of Management, 16(1), 49–
64.
Durrah, O., Aziz, A., Rahman, A., Jamil, S. A., & Ghafeer,
A. (2016). International Journal of Economics and
Financial Issues Exploring the Relationship between
Liquidity Ratios and Indicators of Financial
Performance: An Analytical Study on Food Industrial
Companies Listed in Amman Bursa. International
Journal of Economics and Financial Issues, 6(2), 435–
441.
Felani, I. A., & Worokinasih, S. (2018). Pengaruh
Perputaran Modal Kerja, Leverage dan Likuiditas
Terhadap Profitabilitas (Studi pada Perusahaan Sub
Sektor Makanan dan Minuman yang Terdaftar di Bursa
Efek Indonesia padaTahun 2012-2016). Jurnal
Administrasi Bisnis (JAB), 58(2), 119–128.
Hantono. (2015). Pengaruh Current Ratio dan Debt to
Equity Ratio Terhadap Profitabilitas pada Perusahaan
Manufaktur Sektor Logam dan Sejenisnya yang
Terdaftar di Bursa Efek Indonesia Periode 2009-2012.
Jurnal Wira Ekonomi Mikroskil, 5(1), 21–29.
Hantono. (2018). The Effect of Current Ratio, Debt to
Equity Ratio, Toward Return on Assets (Case Study on
Consumer Goods Company). Accountability, 7(2), 64–
73.
Herlina, & Winingsih, W. (2016). Pengaruh Curernt Ratio
dan Debt to Equity Ratio Terhadap Return on Equity
(ROE) pada perusahaan Food and Beverage yang
Terdaftar di Bursa Efek Indonesia. The Asia Pacific
Journal of Management Studies, 3(2), 75–82.
Hidayat, R., & Batubara, C. H. (2019). he Influence of
Current Ratio, Debt to Equity Ratio Against the Return
on Equity in the Automotive and Components
Companies Listed on The Indonesia Stock Exchange.
International Journal of Economics Development
Research, 305–311.
Irman, M., Ayu Purwati, A., Irman, M., & Purwati, A. A.
(2020). Analysis On The Influence Of Current Ratio,
Debt to Equity Ratio and Total Asset Turnover Toward
Return On Assets On The Otomotive and Component
Company That Has Been Registered In Indonesia Stock
Exchange Within 2011-2017. International Journal of
Economics Development Research, 1(1), 36–44.
Jati, W., & Andini, S. (2019). The Effect of Current Ratio
(CR) and Debt to Equity Ratio (DER) on Return on
Equity (ROE) at PT Aneka Tambang, Tbk. Years 2010-
2017. Pinisi Discretion Review, 3(1), 83–92.
Kieso, D. E., Weygandt, J. J., & Warfield, T. D. (2012).
Intermediate Accounting IFRS Edition (Vol. 2).
Madushanka, K. H. I., & Jathurika, M. (2018). The Impact
of Liquidity Ratios on Profitability. International
Research Journal of Advanced Engineering and
Science, 3(4), 157–161.
Mahardhika, P. A., & Marbun, D. P. (2016). Pengaruh
Current Ratio Dan Debt To Equity Ratio Terhadap
Return On Assets. Widyakala, 3, 23–28.
Nasution, I. R. (2016). Analisis Rasio Leverage Terhadap
Profitabilitas pada Perusahaan Otomotif dan
Komponan yang Terdaftar di Bursa Efek Indonesia.
Jurnal Akuntansi Dan Bisnis, 2(2), 17–38.
Pongrangga, R., Dzulkirom, M., & Saifi, M. (2015).
Pengaruh Current Ratio, Total Asset Turnover dan Debt
to Equity Ratio terhadap Return on Equity (Studi pada
Perusahaan Sub Sektor Property dan Real Estate yang
Terdaftar di BEI periode 2011-2014. Jurnal
Administrasi Bisnis, 25(2), 1–8.
Putra, A. W., & Badjra, I. B. (2015). Pengaruh Leverage,
Pertumbuhan Penjualan, dan Ukuran Perusahaan
Terhadap Profitabilitas. E-Jurnal Manajemen Unud,
4(7), 2052–2067.
Rahmah, S., & Asnawi, haris. (2019). Pengaruh Current
Ratio dan Debt to Equity Ratio terhadap Return of
Equity pada Perusahaan yang Terdaftar dalam Jakarta
Islamic Index (Studi di Sub-Sektor Telekomunikasi
Periode 2013-2017). At-Taradhi Jurnal Studi Ekonomi,
10(2), 202–213.
Robinson, T., Henry, E., Pirie, W., & Broihahn, M. (2015).
International Financial Statement Analysis (3rd ed.).
John Wiley & Sons, Inc.
Saleem, Q., & Rehman, R. (2011). Impacts of liquidity
ratios on profitability. Interdisciplinary Journal of
ICAESS 2021 - The International Conference on Applied Economics and Social Science
124

Research in Business,. Interdisciplinary Journal of
Research in Business, 1(7), 95–98.
Samo, A. H., & Murad, H. (2019). Impact of liquidity and
financial leverage on firm’s profitability – an empirical
analysis of the textile industry of Pakistan. Research
Journal of Textile and Apparel, 23(4), 291–305.
Statistics Indonesia. (2020). Pendapatan Nasional
Indonesia.
Ulzanah, A. A., & Murtaqi, I. (2015). The Impact of
Earning Per Share, Debt to Equity Ratio, and Current
Ratio Towards Profitability of Companies Listed in
LQ45 from 2009 to 2013. Journal of Business and
Management, 4(1), 18–27.
Widiyanti, M., & Elfina, D. F. (2015). Pengaruh Financial
Leverage Terhadap Profitabilitas Pada Perusahaan Sub
Sektor Otomotif Dan Komponen Yang Terdaftar Di
Bursa Efek Indonesia. Jurnal Manajemen Dan Bisnis
Sriwijaya, 13(1), 117–136.
Effect of Liquidity and Leverage on Profitability of Agricultural Sector Companies Listed on the IDX
125
