
Effect of Financial Ratios on Financial Distress of Retail Trade
Companies Listed on the Indonesia Stock Exchange
Sinarti
1
, Maresyah Handayani
1
and Nguyen Thi Hoang Oanh
2
1
Department of Managerial Accounting, Politeknik Negeri Batam, Jl. A. Yani, Batam, Indonesia
2
Thai Nguyen University of Technology, Thành phố Thái Nguyê, Vietnam
Keywords: Financial Ratios, Return on Equity, Debt to Equity Ratio, Current Ratio, Financial Distress, Z-Score.
Abstract: This study aims to examine the effect of financial ratios on financial distress in retail trade sub-sector
companies in Indonesia. Profitability is measured by Return on Equity (ROE), leverage as measured by
Debt-to-Equity Ratio, Liquidity is measured by Current Ratio (CR), and Financial distress is measured by
Z-Score. This study uses secondary data with data collection techniques using financial statements of retail
trade sub-sector companies listed on the Indonesia Stock Exchange for the period 2014-2018. The sampling
technique used the purposive sampling method, obtained several 14 companies that fulfill the criteria with a
total population of 26 companies, the total observation for five years was 70 samples. The test method in
this study uses panel data regression analysis with Eviews 9. This study found that the Return on Equity has
a significant positive impact on Financial Distress in the retail trade sub-sector. This study also found that
the Debt Equity Ratio has a significant negative effect on Financial Distress on retail trade sub-sector and
Current Ratio has an insignificant negative effect on Financial Distress on retail trade sub-sector.
1 INTRODUCTION
Indonesia is the fourth country with 269 million
people, or around 3.39% of the total world
population (Worldometers, 2019). The increasing
population can affect the level of community needs
ranging from personal, family, and group needs will
continue to increase so that it becomes a potential
market for producers to develop their businesses in
Indonesia. The retail trade business can be a solution
for people's needs so that people do not need to buy
directly from producers because of retail sales
(retail). This makes it easier for people to shop for
their needs.
Retail trade is a business sub-sector that is
important in distributing goods to its users and
becomes the last chain in the distribution process
(Soliha, 2008). This business sector involves the
activity of selling products and services directly to
the final consumer. In general, the products
marketed are household needs, including basic
needs. Businesses in this sector have great potential
to continue to grow. Indonesia experienced an
increase in retail sales growth with the highest value
of 10.1% in March 2019 (Ceicdata, 2019). This is
result of the increasing population and purchasing
power of the people and the public's need for
consumer products.
Retail trade business competition tends to be
increasingly unhealthy due to modern retail
businesses that can kill traditional markets because
they take advantage of the purchasing power of the
upper middle-class people who prefer neater and
cleaner facilities (Soliha, 2008). This increase in the
competition encourages retail business actors to be
more careful and careful in dealing with and making
decisions concerning their companies. Assessment
of company performance can be analyzed using one
of the essential sources of information, namely
financial statements that contain information related
to financial position, profit and loss, and company
performance that serves to make company decisions.
According to Ramadhan & Syarfan (2016),
Financial statement analysis can be used as a
policymaker and consideration for related parties
such as managers, company owners, and investors to
project financial aspects in the future to prevent
bankruptcy. Bankruptcy results from financial
difficulties that occur continuously and are getting
worse (Platt & Platt, 2002). According to Nugroho
(2018) financial distress is the company's inability to
manage profits in its operational activities, resulting
in a decrease. Before bankruptcy, management
needs to predict financial distress by analyzing
financial statements, which are an essential source of
information.
Sinarti, ., Handayani, M. and Thi Hoang Oanh, N.
Effect of Financial Ratios on Financial Distress of Retail Trade Companies Listed on the Indonesia Stock Exchange.
DOI: 10.5220/0010861500003255
In Proceedings of the 3rd International Conference on Applied Economics and Social Science (ICAESS 2021), pages 109-116
ISBN: 978-989-758-605-7
Copyright
c
2022 by SCITEPRESS – Science and Technology Publications, Lda. All rights reserved
109

Financial statements are a benchmark in
measuring financial ratios to predict financial
distress. Financial ratios are the most significant
indicator in predicting financial distress (Andre,
2013). Financial ratios that can be used are liquidity
ratios, leverage ratios, profitability ratios, activity
ratios, and growth ratios. Financial distress can be
analyzed with various models. One of them uses the
z-score model, which is a bankruptcy prediction tool
made in 1968 by Altman (Hikmah & Afridola,
2019). This model uses specific financial ratios and
has a relatively reliable level of accuracy and
precision.
Fauzan & Sutiono (2017) compares bankruptcy
prediction models using several models, namely
Altman Z-Score and Zmijewski. The study shows
that the Altman Z-Score method has a high accuracy
rate of 86% in the period one or a year before the
company is issued from the stock exchange and
100% in the one or two year period before the
company is published from the stock exchange. It
also proves that the Altman Z-Score model is more
accurate.
2 THEORETICAL STUDY
2.1 Signaling Theory
According to Spence (1973), a sign is a movement
taken with the aid of using the agency's to control to
offer commands for traders approximately how
control perspectives of the agency's prospects. This
principle additionally indicates the significance of
statistics issued with the aid of using the agency to
funding decisions. The Information posted as a
statement will offer a sign for traders in making
funding decisions.
2.2 Trade-off Theory
Trade-Off Theory demonstrates that the most
appropriate capital shape may be decided through
balancing the advantages of the use of debt; with
monetary fees and company problems (Modigliani
& Miller, 1963).
2.3 Literature Review
Several researchers on the impact of financial ratios
on financial distress includes Islami & Rio (2019),
which examines the opportunity of financial distress
in property and real estate companies listed on the
Indonesia Stock Exchange for 2012-2016. The
financial ratios used are debt ratio, current ratio,
return on equity ratio, and capitalization ratio. The
consequences display that the current ratio, debt
ratio, and return on equity ratio can measure the
opportunity of financial distress.
Desiyanti et al. (2019) examined the impact of
financial ratios on financial distress using of the
Altman Z-Score method on real estate companies
indexed at the Indonesia Stock Exchange for 2014-
2018. The variables used are return on equity, debt
to equity ratio, current ratio, working capital ratio,
and Z-Score. The effects of this take a look at
implying that the return on equity and working
capital ratio has a significant positive effect on
financial distress. In contrast, the debt to equity ratio
has a significant negative effect on financial distress.
Subsequent research by Erayanti (2019) tested the
impact of profitability, liquidity, and leverage on
financial distress in transportation, infrastructure and
utilities zone groups indexed at the Indonesia Stock
Exchange for the period 2012-2016. The effects
show that return on investment has a significant
effect on financial distress, while the current ratio,
quick ratio, return on equity, debt to equity ratio and
debt to asset ratio have no effect on financial
distress.
Research conducted by Widati & Pratama
(2014) examines the effect of the current ratio, debt
to equity ratio, and return on equity on financial
distress in 192 manufacturing companies listed on
the Indonesia Stock Exchange. The results show that
the current ratio has no significant negative effect on
financial distress and debt to equity ratio and return
on equity has a significant positive effect on
financial distress. Sinarti & Sembiring (2015)
research aims to determine the health level of metal
and manufacturing companies listed on the
Indonesia Stock Exchange and to find out whether
there are significant differences between the three
models used, namely Z-score, Springate, and
Zmijewski. The results show that there is no
significant difference in the z-score prediction model
with springate, but there is a significant difference
between the z-score prediction model with
zmijewski and springate with zmijewski.
2.3 Hypothesis Development
2.3.1 Effect of Return on Equity on
Financial Distress
Return on equity is a ratio that could degree how a
lot the company's cap potential to apply its personal
capital in producing income for all shareholders
ICAESS 2021 - The International Conference on Applied Economics and Social Science
110
(Sujarweni, 2017). If this ratio is higher, then the
company is taken into consideration to be more
effective and efficient in dealing with sources so that
the opportunity of financial distress is also getting
smaller. In Islami & Rio (2019) return on equity can
are expecting the prevalence of financial distress due
to the fact if the enterprise isn't capable of
generateing income for investors, then it can cause
company funds to also decrease along with reduced
investor interest in investing in companies, but in
Erayanti (2019) shows that return on equity does
now no longer affect on the prediction of financial
distress because the increase in return on equity is
not always given a good deal interest in making
choices associated with investing in companies.
Based on the explanation above, the hypotheses to
be tested are:
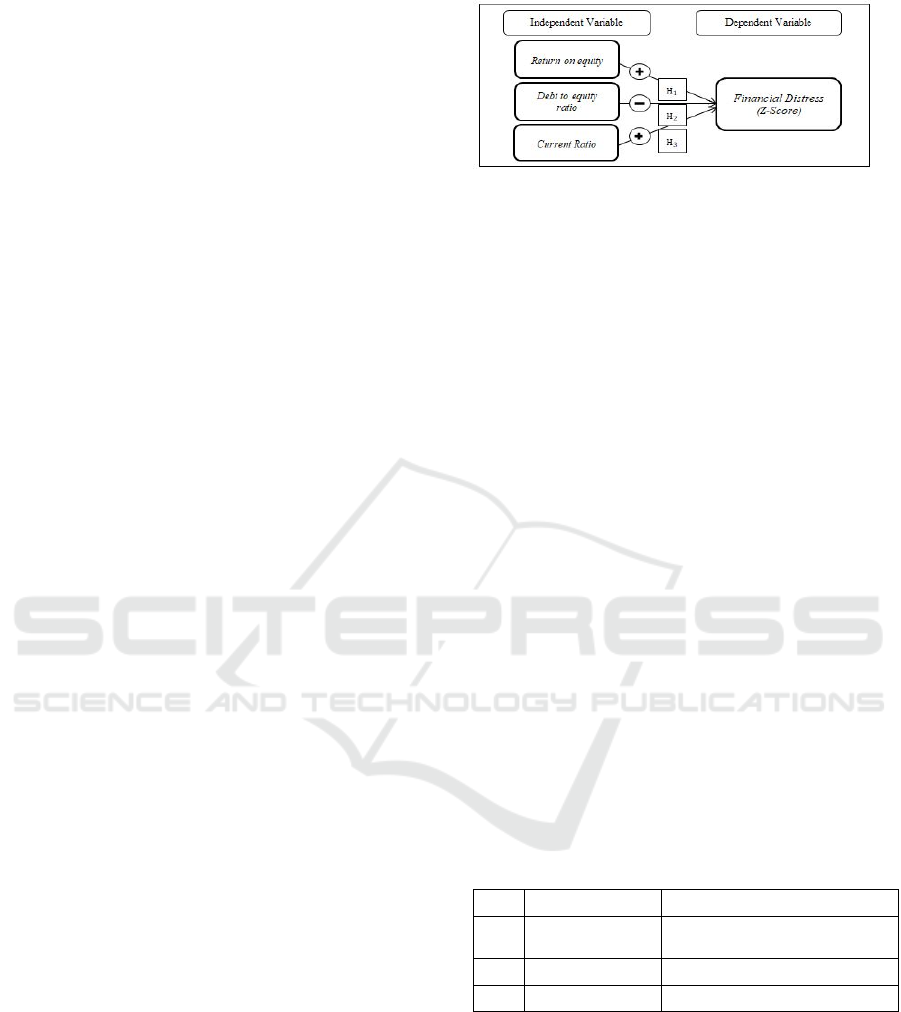
𝐇
𝟏
= Return on equity has a significant positive
on financial distress.
2.3.2 Effect of Debt-to-Equity-Ratio on
Financial Distress
Widati & Pratama (2014) research shows that the
debt to equity ratio has a positive and significant
effect on financial distress, while Erayanti (2019)
shows that the debt to equity ratio has no significant
effect on financial distress. Based on the explanation
above, the hypotheses to be tested are:
𝐇
𝟐
= Debt to equity ratio has a significant
negative on financial distress.
2.3.3 Effect of Current Ratio on Financial
Distress
In Islami & Rio (2019), it shows that the current
ratio can predict financial distress because if current
assets do not pay the company's short-term
obligations, it can trigger the possibility of financial
distress affecting the company's operations, while in
Erayanti (2019), the current ratio has no effect. On
the prediction of financial distress. Based on the
explanation above, the hypotheses to be tested are:
𝐇
𝟑
= Current Ratio has a significant positive on
financial distress.
Based on the description of the theoretical study,
literature review, and hypothesis development which
have been defined previously, the research model
may be visible in Figure 1:
Figure 1: Research Model
3 RESEARCH METHOD
The research method used in this study is a
quantitative approach which is a specific, clear, and
detailed type of research to display the connection
between the independent variable and the dependent
variable.
3.1 Operational Variable and Indicator
3.1.1 Dependent Variable
The dependent variable used in this study is
financial distress. As for a researcher named Edward
I Altman, who introduced a z-score analysis model.
The ratio is calculated by the following formula:
𝒁 = 𝟑. 𝟐𝟓 + 𝟔. 𝟓𝟔𝑿
𝟏
+ 𝟑. 𝟐𝟔𝑿
𝟐
+ 𝟔. 𝟕𝟐𝑿
𝟑
+ 𝟏. 𝟎𝟓𝑿
𝟒
Source: (Altman & Hotchkiss, 2006)
Description:
𝑋
: working capital/total assets
𝑋
: retained earnings/total assets
𝑋
: earnings before interest and taxes/total assets
𝑋
: book value of equity/book value of total debt
Table 1: The Altman Model Parameter Index
No. Z-Score Classification
1 >2.60
The company in good
condition
2 1.10<Z<2.60
The company in grey zone
3 <1.10
The company in bankrupt
Source: (Altman &Hotchkiss, 2006)
3.1.2 Independent Variable
The independent variables used in this study are
return on equity, debt to equity ratio, and current
ratio. Operational variables and their indicators can
be seen in table 1:
Effect of Financial Ratios on Financial Distress of Retail Trade Companies Listed on the Indonesia Stock Exchange
111
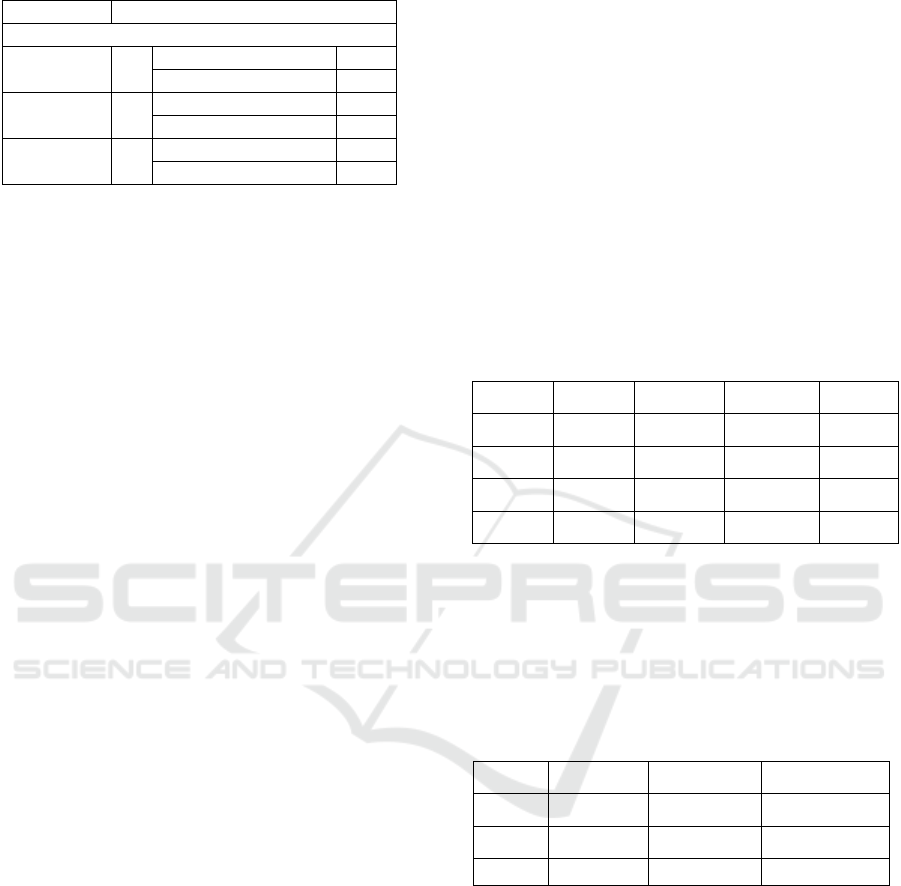
Table 2: Independent Variables and Indicator
Variable Indicator
Independent Variable
ROE = Net Income After Tax
Total Equity
DER = Total Liabilities
Total Equity
CR = Current Assets
Current Liabilities
The object of research used in this study is a
retail trade company that publishes its financial
statements and is listed on the Indonesia Stock
Exchange. The sample taken is a sample decided on
the usage of predetermined criteria. Twenty-six
corporations are indexed as populace corporations at
the Indonesia Stock Exchange, because this study
uses purposive sampling where the sample must be
based on specific predetermined criteria. There are
12 companies that do not meet the criteria of the
research sample. Then, the researchers found 14
companies that match the research criteria to be used
as research samples. Next, 14 companies are
multiplied by five years, so the total sample is 70
samples.
3.2 Data Analysis Technique
The data analysis technique in this study uses panel
data regression analysis which is a combination of
time series data and cross section data.
3.2.1 Descriptive Statistics
Descriptive statistical analysis is an analytical
method used to collect and present quantitative data
so as to produce useful information. Descriptive
reports in the form of data in general in the
frequency distribution table include the average
value (mean), minimum value, maximum value and
standard deviation.
3.2.2 Classic Assumption Test
The classical assumption test is a test carried out to
see the significant effect between each variable, both
the independent variable and the dependent variable.
The classical assumption test consists of
Heteroscedasticity Test and Multicollinearity Test.
3.3 Panel Data Regression Analysis
According to Winarno (2017) the panel data
regression model has three approaches, namely fixed
effect model, random effect model and common
effect model. To choose the most appropriate model
in managing panel data, there are several tests that
can be done, namely chow test, hausman test and
lagrange multiplier test.
4 RESULT AND DISCUSSION
4.1 Descriptive Statistical Analysis
Based at the monetary document statistics studied,
the subsequent is a descriptive statistical table for
the independent variables ROE, DER, CR and the
dependent variable Z-Score:
Table 3: Descriptive Statistical
Variable Mean Max Min Std.Dev
Z-Score
7.457411 21.31383 -0.151235 3.984879
ROE 0.236643 7.991000 -0.781600 0.981138
DER 0.020286 0.181900 0.000900 0.024601
CR 0.020442 0.122023 0.006413 0.019655
4.2 Classis Assumption Test
4.2.1 Multicollinearity Test
The results of the multicollinearity test can be seen
in table 4:
Table 4: Multicollinearity Test
ROE DER CR
ROE 1.000000 0.751720 -0.068611
DER 0.751720 1.000000 -0.359267
CR -0.068611 -0.359267 1.000000
Based on table 4, the correlation coefficient
between variables has a value of less than 0.8. This
suggests that the information on this take a look at
does now no longer contain multicollinearity
disorders (Ghozali, 2016).
4.2.3 Heteroscedasticity Test
The output results of the Breusch-Pagan-Godfrey
test are shown in table 5:
ICAESS 2021 - The International Conference on Applied Economics and Social Science
112

Table 5: Heteroskedasticity Test: Breusch-Pagan-Godfrey
F-statistic 0.643964 Prob. F(4,80) 0.589
5
Obs*R-
s
q
uare
d
1.990705 Prob.Chi-
S
q
uare
(
4
)
0.574
3
Scaled
explained SS
9.818901 Prob.Chi-
Square(4)
0.020
2
The results of Table 5 shows that the probability
value is 0.5743, which is more significant than 0.05.
This indicates that the data does not experience
heteroscedasticity problems.
4.3 Model Selection
4.3.1 Chow Test
The Chow test is used to decide the maximum
suitable version among the fixed-effect model or the
common effect model.
Table 6: Chow Test
Effects Test Statistic d.f. Prob.
Cross-section
F
3.356469 (13,53) 0.0009
Cross-section
Chi-square
42.044777 13 0.0001
Table 6 shows that the chi-square cross-section
probability of 0.0001 is smaller than the alpha level
(5%). The outcomes of the Chow test indicate that it
is more appropriate to use the fixed effect model
than the common effect model.
4.3.2 Hausman Test
The Hausman test is a test to determine the correct
version among the fixed effect model or the random
effect model.
Table 7: Hausman Test
Test
Summar
y
Chi-Sq.
Statistic
Chi-Sq.
d.f.
Prob.
Cross-section
rando
m
24.393209 3 0.0000
Table 7 above shows the probability value of a
random cross-section of 0.0000. The random cross-
section probability value is smaller than the alpha
level (5%), so the Hausman take a look at effects to
display that the fixed effect model is extra suitable
than the random effect model.
4.4 Panel Data Regression Analysis
The results of panel data regression using the fixed-
effect model can be seen in Table 8 below.
Table 8: Fixed Effect Model
Variable Coefficient t-Statistic Prob.
C 8.910100 27.560690 0.0000
ROE 1.738537 10.684850 0.0000
DER -71.61540 11.0665 0.0000
CR -20.12152 -1.253855 0.2154
R-squared 0.987406
Adjusted
R-s
q
uare
d
0.983605
Prob(F-
statistic)
0.000000
N 70
Model Result Fixed
From the results of the panel data regression, the
following equation can be obtained:
Z-Score
t
=8.910100+
1.738537ROE
t
-71.61540DER
t
-20.12152CR
t
4.5 Hypothesis Test Results
4.5.1 Test Result of H
1
Hypothesis 1 states that Return on Equity (ROE) has
a significant positive effect on financial distress.
Table 8 shows that ROE has a significant effect on
financial distress because the probability value is
0.0000, which is smaller than 0.05. The coefficient
value of 1.738537 indicates a positive direction,
meaning that if the ROE increases by 1 with the
assumption that other variables are fixed, there will
be an increase in the z-score of 7.874606. The
conclusion that can be drawn from the description
above shows that hypothesis 1 is supported.
4.5.2 Test Result of H
2
Hypothesis 2 states that the Debt to Equity Ratio
(DER) has a significant negative effect on financial
distress. Table 8 shows that DER has a significant
effect on financial distress because the probability
value is 0.0000, which is smaller than 0.05. The
coefficient value of -71.61540 indicates a negative
Effect of Financial Ratios on Financial Distress of Retail Trade Companies Listed on the Indonesia Stock Exchange
113

direction, meaning that if the z-score increases by 1
with the assumption that other variables are fixed,
there will be a decrease of -71.61540. The
conclusion that can be drawn from the description
above shows that hypothesis 2 is supported.
4.5.3 Test Result of H
3
Hypothesis 3 states that the current ratio (CR) has a
significant positive effect on financial distress. Table
8 shows that CR has no significant effect on
financial distress because the probability value is
0.2154, which is more significant than 0.05. The
coefficient value of -20.12152 indicates a negative
direction, meaning that if the z-score increases by 1
with the assumption that other variables are
constant, there will be a decrease of -20.12152. The
conclusion that can be drawn from the description
above shows that hypothesis 3 is not supported.
4.6 Data Analysis
The following is a summary table of test results from
this study:
Table 9: Summary of Test Result
Hypothesis Prob. Coeff. Result
H
1
ROE has a
significantly
positive effect on
Financial Distress
0.0000 1.738537 Supported
H
2
DER has a
significantly
negative effect on
Financial Distress
0.0000 -71.61540 Supported
H
3
CR has a
significantly
positive effect on
Financial Distress
0.2154 -20.12152 Not
Supported
4.6.1 Effect of Return on Equity on
Financial Distress
Based on the H
1
test in table 8, suggests that the
profitability ratio as measured by ROE has a
significant positive effect on financial distress. This
indicate that ROE can expect the incidence of
financial distress. If the ROE is higher, the agency is
taken into consideration to be getting better and is
capable of manipulating to manage its resources
greater effectively and efficiently. The better the
agency, the higher the z-score, so the agency is
much less possibly to reveal in financial distress.
The results of this study are following the
research of Desiyanti et al. (2019) and Widati &
Pratama (2014), which state that ROE has a
significant positive effect on financial distress. If the
ROE percentage is high, the company is said to be
far from financial distress. This ratio is essential for
the business enterprise because it could take degree
to earn earnings with the equity owned by the
company. A low ROE can illustrate that the
company cannot use equity to generate profits and
makes it more incredible hard for the company's
finances in inner investment reasserts for
investment, so that the company's increase will
become much less trues and financial distress The
company's growth that is not good will give a signal
(signal theory) or information to shareholders that
the company is less able to maintain survival and is
less able to develop. High company growth will
indicate that the company is in good health and not
under pressure.
4.6.2 Effect of Debt to Equity Ratio on
Financial Distress
Based on the H
2
test table 8, indicates that the
leverage ratio measured by the use of DER has a
significant negative effect on financial distress. This
shows that DER can expect the incidence of
financial distress. If the DER is lower, the company
is taken into consideration able to paying off its
responsibilities without sacrificing the interests of
the owners of too much capital so that the possibility
of financial distress is also getting smaller with a
higher z-score.
The outcomes of this observation are according
with the results of studies with the aid of using by
Desiyanti et al. (2019) which states that DER has a
significant negative effect on financial distress. The
outcomes of this observation also are in keeping
with the studies of Masdupi et al. (2018), which
states that if the company manages debt well, the
company is capable of boom income and company
cost to keep away from financial distress. The
outcomes of this observation are according with the
trade-off theory, which states that debt will increase
the value of the company to reduce financial
distress, so it can be concluded that the use of debt
in the retail trade sector affects financial distress.
4.6.3 Effect of Current Ratio on Financial
Distress
Based on the H
3
test in table 8, it suggests that the
liquidity ratio as measured by CR has no significant
negative effect on financial distress. It can be
ICAESS 2021 - The International Conference on Applied Economics and Social Science
114

concluded that CR cannot are expecting the
prevalence of financial distress. The consequences
of this has a examine contradict the impact of Islami
& Rio (2019) research which states that the current
ratio can expect financial distress. The distinction
withinside the consequences of this have a take a
follow can be because of variations withinside the
pattern and the studies period, at the same time as
the results of this have a take a observe are
according with the consequences of studies with the
aid of using Widati & Pratama (2014) which states
that the current ratio has no significant negative
effect on financial distress.
CR is not the principle element that impact
financial distress in retail trade sub-sector companies
because it does not have a significant effect. One of
them is due to the fact the agency has a reasonably
excessive short-time period responsibility, after
which the agency is not able to pay its short-time
period duties till adulthood so that debt that turned
into at first classified as short-time period debt will
become long-time period debt. From the outline
above, it may be concluded that companies with
high CR values will not necessarily avoid financial
distress, and companies with the lowest CR values
do not always experience financial distress.
5 CONCLUSIONS
Based on the consequences of the studies conducted,
it becomes located that Return on equity (ROE) had
a significant positive effect on financial distress.
From the implications of the study, the higher the
ROE, the more effective and efficient the company
is in dealing with sources so that the opportunity of
financial distress is smaller and the z-score is higher.
The Debt to equity ratio (DER) has a significant
negative effect on financial distress. From the
consequences of the study, the decrease the DER,
the company is taken into consideration capable of
repaying its duties without sacrificing the hobbies of
the proprietors of capital so that the opportunity of
financial distress is smaller and the z-score is higher.
Current ratio (CR) has no significant negative effect
on financial distress. From the results of the study, a
high CR value does not necessarily guarantee that
the company can pay its maturing debts, so
companies with a high CR value will not necessarily
avoid financial distress.
REFERENCES
Altman, E. I., & Hotchkiss, E. (2005). Corporate Financial
Distress and Bankruptcy. Corporate Financial
Distress and Bankruptcy.
https://doi.org/10.1002/9781118267806
Andre, O. (2013). Pengaruh Profitabilitas, Likuiditas dan
Leverage Dalam Memprediksi Financial Distress.
Ejournal UNP, 1–17.
Ceicdata. (2019). Indonesia Retail Sales Growth.
Ceicdata.Com.
https://www.ceicdata.com/en/indicator/indonesia/retail
-sales-growth
Desiyanti, O., Soedarmo, W., Chandra, K., & Kusnadi, K.
(2019). The Effect Of Financial Ratios To Financial
Distress Using Altman Z-Score Method In Real Estate
Companies Listed In Indonesia Stock Exchange
Period 2014 - 2018. Business and Entrepreneurial
Review, 19(2), 119.
https://doi.org/10.25105/ber.v19i2.5699
Erayanti, R. (2019). Pengaruh Likuiditas, Profitabilitas
dan Leverage terhadap Prediksi Financial Distress.
Jurnal Riset Akuntansi & Perpajakan (JRAP), 6(01),
38–51. https://doi.org/10.35838/jrap.v6i01.393
Fauzan, H., & Sutiono, F. (2017). Perbandingan Model
Altman Z-Score, Zmijewski, Springate, Dan Grover
Dalam Memprediksi Kebangkrutan Perusahaan
Perbankan (Studi Kasus Pada BEI Tahun 2011-2015).
Jurnal Online Insan Akuntan, Vol 2 No 1(1), 49–60.
Ghozali, I. (2016). Aplikasi Analisis Multivariate dengan
Program IBM SPSS. Badan Penerbit Universitas
Diponegoro.
Hikmah, & Afridola, S. (2019). Pengaruh Rasio Keuangan
Altman Z-score Terhadap Financial Distress pada PT
Citra Tubindo Tbk. Junal Institusi Politeknik Ganesha
Medan, 2(1), 1–14.
Islami, I. N., & Rio, W. (2019). Financial Ratio Analysis
to Predict Financial Distress on Property and Real
Estate Company listed in Indonesia Stock Exchange.
JAAF (Journal of Applied Accounting and Finance),
2(2), 125. https://doi.org/10.33021/jaaf.v2i2.550
Masdupi, E., Tasman, A., & Davista, A. (2018). The
Influence of Liquidity, Leverage and Profitability on
Financial Distress of Listed Manufacturing
Companies in Indonesia. 57(Piceeba), 223–228.
https://doi.org/10.2991/piceeba-18.2018.51
Modigliani, F., & Miller, M. (1963). Corporate Income
Taxes and the Cost of Capital: A Correction. American
Economic Review, 433–443.
Nugroho, A. (2018). MODEL ANALISIS Z SCORE
TERHADAP PREDIKSI KEBANGKRUTAN ( Studi
pada PT Garuda Indonesia,Tbk tahun 2015-2017). J-
MACC: Journal of Management and Acoounting, 1(2),
124–138.
Platt, H. D., & Platt, M. B. (2002). Predicting corporate
financial distress: Reflections on choice-based sample
bias.
Journal of Economics and Finance, 26(2), 184–
199. https://doi.org/10.1007/bf02755985
Ramadhan, K. D., & Syarfan, L. O. (2016). Analisis
Laporan Keuangan Dalam Mengukur Kinerja
Effect of Financial Ratios on Financial Distress of Retail Trade Companies Listed on the Indonesia Stock Exchange
115

Perusahan Pada Pt. Ricky Kurniawan Kertapersada
(Makin Group) Jambi. Jurnal Valuta, 2(2), 190–207.
Sinarti, & Sembiring, T. M. (2015). Bankruptcy prediction
analysis of manufacturing companies listed in
Indonesia stock exchange. International Journal of
Economics and Financial Issues, 5, 354–359.
Soliha, E. (2008). Analisis Industri Ritel di Indonesia.
Analisis Industri Ritel Di Indonesia, 15(2), 128–142.
Spence, M. (1973). Job Market Signaling. Quarterly
Journal of Economics, 87, 355–374.
https://doi.org/10.1055/s-2004-820924
Sujarweni, V. (2017). Manajemen Aplikasi Teori,
Aplikasi, dan Hasil Penelitian. Pustaka Baru Press.
Widati, L. W., & Pratama, B. A. (2014). Pengaruh Current
Ratio, Debt To Equity, Dan Return On Equity, Untuk
Memprediksi Kondisi Financial Distress. Prosiding
Seminar Nasional Multi Displin Ilmu & Call For
Papers Unisbank, 978–979.
Winarno, W. . (2017). Analisis Ekonometrika dan
Statistika dengan Eviews. UPP STIM YKPN.
Worldometers. (2019). Indonesian Population.
Worldometers. https://www.worldometers.info/world-
population/indonesia-population/
ICAESS 2021 - The International Conference on Applied Economics and Social Science
116
