
Case Study: Productivity Improvement in Surgical Manufacturing
Company
Bekti Harsono and Mursyid Hasan Basri
School of Business and Management, Institute Technology Bandung, Bandung, Indonesia
Keywords: Productivity, capacity, fishbone diagram, lead time.
Abstract: PT MED Batam (PT-MB) has been chosen by its headquarter office, to receive new transfer product, to be
manufactured in Batam Indonesia. While it is good business opportunity, PT-MB faces productivity issue.
With the benchmark of transfer site, its productivity is still 63% compared with them, during the monitoring
phase of 6 months period (July – Dec 2020). To solve the problem, PT-MB should increase productivity to
match with transfer site. Based on this condition, the main objective from this research is to find business
solutions to increase capacity through productivity raise from 5M (Man, Machine, Material, Method,
Measurement), to gain trust and capture more product transfer from headquarter. The business solutions are
derived using the root cause analysis, utilizing the fishbone diagram and why-why analysis. The findings have
led to identify 8 business solutions, in which covering from Man (training), Method (SOP), Measurement
(SOP), Machine (TPM and Critical Spare Part), and Material (Material Lead Time and Supplier
Communication). Having completed on some business solution implementation, we can achieve 7.94
units/hour by Jul 2021. Overall improvement compared with Dec 2020, productivity has increased from 5.7
units/hour to 7.94 units/hour, improved by 39.3%, in which very significant improvement. By Jul 2021, the
gap is 11.7% compared with target 9 units/hour. We are confident, with 3 months towards October 2021, and
some of business solutions are still in-progress for implementation, we will achieve our target of 9 units/hour.
1 INTRODUCTION
PT MED Batam (PT-MB) is a pharma-medical
devices company. Its main product is contact lenses
and surgical device. Start from mid-2019, PT-MB has
received product transfer of Surgical product from
their headquarter (HQ) in the United States of
America (USA). The products are Fiber Optics, Laser
Probes, Base IOL, and Multi Piece IOL. The long-
term business strategy is to make PT-MB for
secondary Surgical Production site, outside Unites
States. Below figure shows the transfer site location
of surgical product.
Figure 1: Types Surgical Product Transferred to PT-MB.
Figure 1 explains product transfer strategy between
US transfer site with PT-MB site. The business
strategy is to make PT-MB to be the only plant
outside USA, to be able to produce Surgical products.
Therefore, the transfer project is becoming the first
priority for PT-MB to succeed, as the continuation of
upcoming other products of Surgical will be based on
the success of this first transfer project.
The business challenge is, the first Surgical
transfer product, which is Fiber Optic is having low
productivity issue during its 6-month monitoring
mass production process. There is significant gap
between transfer site’s productivity and PT-MB site’s
productivity. Therefore, to be able to close the gap of
productivity performance, will be imperative for the
near future Surgical product to PT-MB.
Fiber Optic is an endo illuminator light guide.
This is a product transfer between the Transferring
Site (TS), in USA to PT-MB Manufacturing as the
Receiving Site (RS).
Fiber Optics is an endoscopic device that
transmits visible light from a light source to the eye
to provide internal illumination for clinical
190
Harsono, B. and Hasan Basri, M.
Case Study: Productivity Improvement in Surgical Manufacturing Company.
DOI: 10.5220/0010861400003255
In Proceedings of the 3rd International Conference on Applied Economics and Social Science (ICAESS 2021), pages 190-196
ISBN: 978-989-758-605-7
Copyright
c
2022 by SCITEPRESS – Science and Technology Publications, Lda. All rights reserved
procedures. The device specified is intended for use
in vitreoretinal procedures.
Fiber Optic was transferred to PT-MB on mid-
2019 and started mass-production on July 2020. PT-
MB sent few members of team, comprises of line
operators, leaders and engineers to have training in
transfer site, USA for 3 months training. Then, similar
material, machinery, equipment and standard
operation were established in PT-MB Plant. The
process of product transfer, including all steps of
machine and equipment approval and validation, pre-
production qualification and document approval were
completed by June 2020. The phase of mass-
production Fiber Optic was then started on July 2020,
under 6 months monitoring and full support from
Transfer Site.
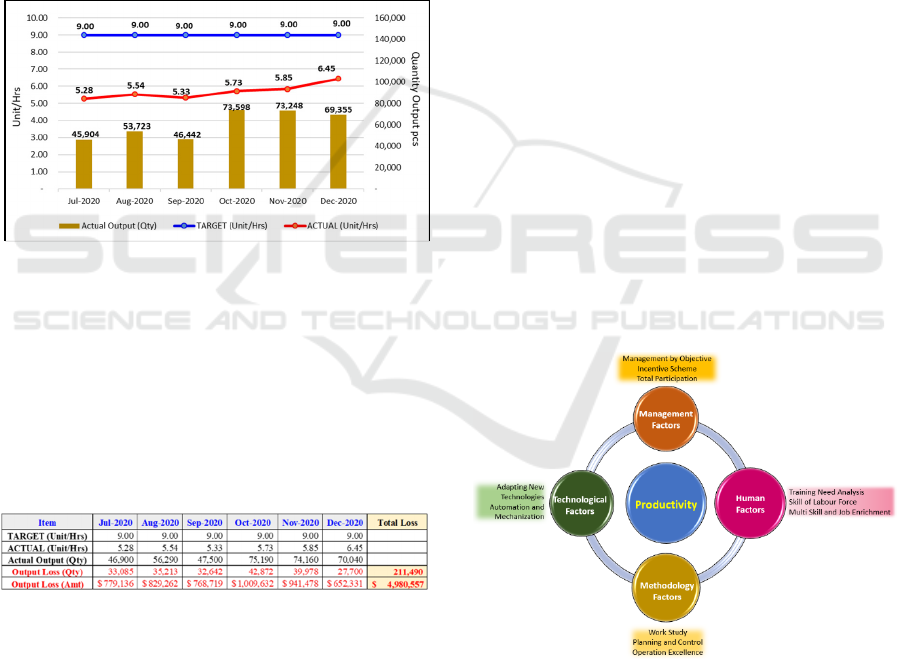
Figure 2: Chart Productivity Trend Fiber Optic Period Jul
2020 until Dec 2020.
Figure 2 shows that the productivity target from
Transfer Site USA is 9 pieces/hour. Whereas the
average PT-MB productivity is 5.7 pieces/hour.
Therefore, the current productivity is still 63% from
Transfer Site USA. This gap created the monthly
average loss of output 60,000 pieces of product. The
performance during the monitoring 6-month mass-
production was not satisfactory.
Figure 3: Chart Productivity Trend Fiber Optic Period Jul
2020 until Dec 2020.
Figure 3 above shows the productivity trend of Fiber
Optic from July 2020 until Dec 2020. This 6-month
period is under project monitoring and considered as
initial mass production phase. Even though it shows
the improvement trend over the period of 6-months
initial production, it is not fast enough. With the
initial production rate, from July 2020 to December
2020, total loss of production quantity is 211,490
pieces of products, with the opportunity loss amount
of 4,980,557 USD.
2 CONCEPTUAL FRAMEWORK
Based on business issue identified, conceptual
framework is designed to achieve the goal of this
research. A conceptual framework is defined as a
network or a “plane” of linked concepts that together
provide a comprehensive understanding of a
phenomenon or phenomena (Jabareen, 2009).
The conceptual framework related to the
productivity will use the People Process and
Technology introduced in 1964 in Leavitt’s model
(Prodan M, 2015). This framework aim to balance of
people, process and technology, to drive into action:
people to perform a specific work assigned by the
organization, using technology to improve the
processes. In addition, based on Kumaduhal’s
hierarchy of productivity factors’ perspective
(Kumar, Duhan, & Haleem, 2016), Top Management
Perspective becomes the baseline level I in the factor
enhancing the productivity. Therefore, the elements
effecting the productivity are divided into 4 main
categories. They are:
1. Management Factors (Top Management
Perspective)
2. Human Factors (People)
3. Methodology Factors (Process)
4. Technological Factors (Technology)
Figure 4: Chart Conceptual Framework for Productivity.
1. Management Factors (Top Management
Perspective)
In an organization, efficient product has been
produced by management skill (Carneli, 2003).
Therefore, productivity is proportionally related to
Case Study: Productivity Improvement in Surgical Manufacturing Company
191

the management factors. A direct and simple
management type of organization should be adopted.
Total participation of employee in the form of two-
way communication and suggestion scheme to be
initiated. It can enhance the mutual understanding
between workers and management. In addition,
management by objective is recommended to be
adapted. With Management by Objective (MBO), the
workers and their managers can have discussion and
agreement on the activities, targets and goals to be
used as criteria for the performance review and
evaluation. It also will allow the alignment between
the organizational goals and individual target setting,
so that the workers can have the visibility of their
contribution to the goal of the organization. It is
therefore will increase the productiveness of the
organization.
2. Human Factors (People)
In an organization, the people are those who do the
work. Without people, nothing can happen.
Productivity is directly affected by human factors.
The right person must be posted to the suitable
workstation, which is put the right man on the right
place. Adopting the concept of making people before
product, employee must be given proper training and
development. Training need analysis must be
generated to identify the right skill to be given to the
right process. Job enrichment and multi skill are to be
provided for the high potential employee. It offers for
the new and more critical processes to be handled, for
the exposure of the opportunity for greater
recognition, growth and responsibility. This will
create positive challenges for them and motive them
to increase the productiveness of the organization. In
summary, the process improvement model on the
people dimension, look after (Prodan M, 2015):
• People know what and how to perform
activities
• They have the right skills and knowledge for
the job
• They are motivated and engaged to achieve
higher performance
• They are encouraged to improve day by day
and they are involved in improvement projects
3. Methodology Factors (Process)
Productivity relies on the production methodology or
process being adopted. A series of actions need to
happen and be done to achieve certain goal. People
will not be effective if the method or process is not in
place for them to do the work. The method of working
should be simplified, documented and standardized.
Work study must be adopted, to identify inefficient
and unnecessary processes, to cut out idle time so that
only value-added process remains. Proper production
planning and control should be implemented, so that
the right quality and quantity of raw material can be
identify, the change model frequency can be
minimized and the right quantity and model required
by customer can be produced on timely manner.
Operation excellence team establishment will further
be strengthening the organization, by focusing on
how to bring the operation level as efficient as
possible, with the highest productivity as main target.
4. Technological Factors (Technology)
Productivity very much depends on the technology.
The technology provides the tools that the people can
use to implement the process. The utilization and
adaptation of the new technology provides
revolutionary way of the process. Automation,
mechanization and rationalization are the major
contributors to productivity. The key success of
utilizing the new technology lies on the ability to
identify and creatively make the modification, so that
it will be suitable to be used with the current process,
to bring the productivity improve to the next level,
with minimum cost of upgrading.
3 ANALYSIS
Root Cause Analysis (RCA) is a method that is used
to address a problem or non-conformance, in order to
get the “root case” of the problem (Vorley, 2008). It
is a series of common-sense techniques which
provides systematic approach to identify and
understand the underlying problem. Definition of root
cause itself, the cause that, if corrected, would prevent
recurrence of this and similar occurrences (Mahto &
Kumar, 2008). The root cause does not only
applicable to the recent occurrence, but also can be
generalized for common factor. It is something
fundamental and can be logically identified and
rectified.
We use Fishbone diagram or Cause Effect
Diagram to analyze current business issues of low
productivity. Cause and Effect diagram (CED) was
pioneered by Professor Kaoru Ishikawa, a quality
management pioneer, in the 1960s. It was published
in his 1990 book, "Introduction to Quality Control."
It was originally developed as a quality control tool,
however it has become widely used as a technique to
identify root cause in any problem situation. CED
ICAESS 2021 - The International Conference on Applied Economics and Social Science
192
uses a diagram-based approach for thinking through
all of the possible causes of a problem.
There are four steps to using the tool:
1. Identify the problem, that is Low Productivity
2. Work out the major factors involved, considering
from 5M (Man, Method, Measurement, Machine,
Material) factors
3. Identify possible causes
4. Analyze generated Cause Effect diagram.
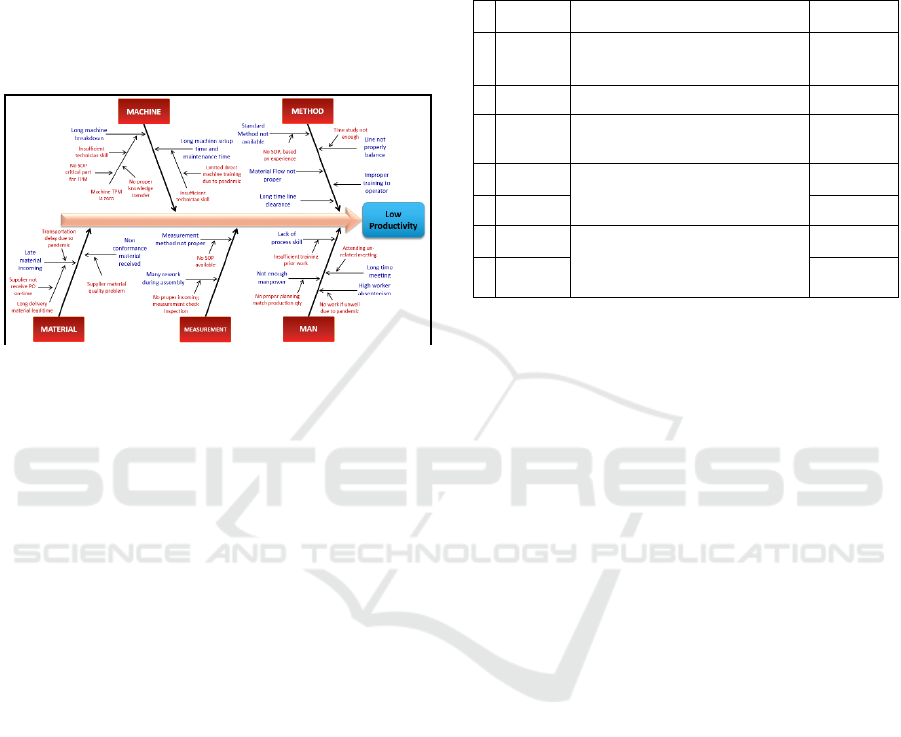
Figure 5. Cause Effect Diagram for Low Productivity.
Figure 5 above describes the root cause analysis using
Cause and Effect diagram of Low Productivity for
Fiber Optic product in PT-MB. As explained, we
analyzed using 5M framework (Man, Method,
Machine, Material, Measurement). In every item, we
did further analysis using why-why question method,
until finding the bottom why question-answer. The
possible root causes are then marked with the red
color.
Having analysed from current condition and
collected data, the causes were verified and
summarized into verification matrix table shown on
appendix 2.
From verification matrix table, we can conclude
that the root causes identified are:
a. Production operators were not trained properly,
due to limited number of trainers.
b. Process time study was not measured and
therefore, its standard time was not established.
c. No Standard Operation Procedure, merely based
on experience, as most of the process and issues,
are stored inside the brain of senior associates in
transfer site.
d. Total Preventive Maintenance (TPM) is not
available. The TPM frequency was not complete
and its step-by-step was not well-documented.
e. Long delivery material lead time and supplier
does not receive PO on-time. Purchase order (PO)
is generated manually to supplier. It takes time to
study and re-group the supplier, as well as to
establish the connection with the supplier’s
person of contact. While those are in-progress, PO
generated were often late, causing supplier late in
executing the material supply.
Table 1: Root cause summary.
Table 1 shows 7 item identified root causes related to
low productivity for Fiber Optic product
manufacturing at PT-MB.
4 RESULT AND CONCLUSIONS
Based on the business issue and analysis to the
existing business situation, continue with the root
causes analysis, we come to several conclusions, in
which relates to the improvement of current situation:
1. PT-MB has its competitive advantage of lower
manufacturing cost and flexible manpower
resources to get more product transfer from
transferring site. However, low current
productivity creates some loss opportunity to sell
more product back to transfer site. The business
issue has become critical and priority to be solved,
involving all the stake holders.
2. Based on root cause analysing using Fishbone
diagram, we found 7 root causes that are related
to the business issue. The root causes have been
further analyzed for the business solution, and
further checked using cost and benefit analysis for
its implementation.
3. There are 8 business solutions proposed to
improve the productivity at Fiber Optic area, as
shown on below table 2.
No
Potential Root
Cause
Verification Conclusion
1
Insufficient Operator
Training
Reviewed initial training plan for project transfer. Discrepancy is
found. Planned 14 associates for US training and become trainer.
Actual, there was only 2 associates for trainer, due to difficulty to get
US VISA approval to go to US for project transfer training.
Root Cause
2
Time study not
enough
Proper time study measurement is not done. Bottleneck process(es)
was not yet identified.
Root Cause
3
No SOP, only based
on experience
Reviewed all SOP which were available. All processes have been
covered, either by SOP and/or Work Instruction. However it was
scattered. Need to put into comprehensive and well-documented SOP.
Root Cause
4
No SOP on critical
part for TPM
Root Cause
5 Machine TPM is zero
Root Cause
6
Supplier not receive
PO on-time
Root Cause
7
Long delivery
mate ri al lea d ti me
Root Cause
Reviewed on TPM schedule, with interviewing transfer site associate.
Replacement only done when the machine is start running intermittent,
and having frequent stop. There is no comprehensive schedule on TPM
and identification on critical spare parts.
Reviewed on purchase order (PO) step-to-step making. Purchase order
(PO) is generate d manual ly to sup pli er. It take s time to study and re-
group the supplier, as well as to establish the connection with the
supplier’s person of contact. While those are in-progress, PO
generated were often late, causing supplier late in executing the
material supply.
Case Study: Productivity Improvement in Surgical Manufacturing Company
193
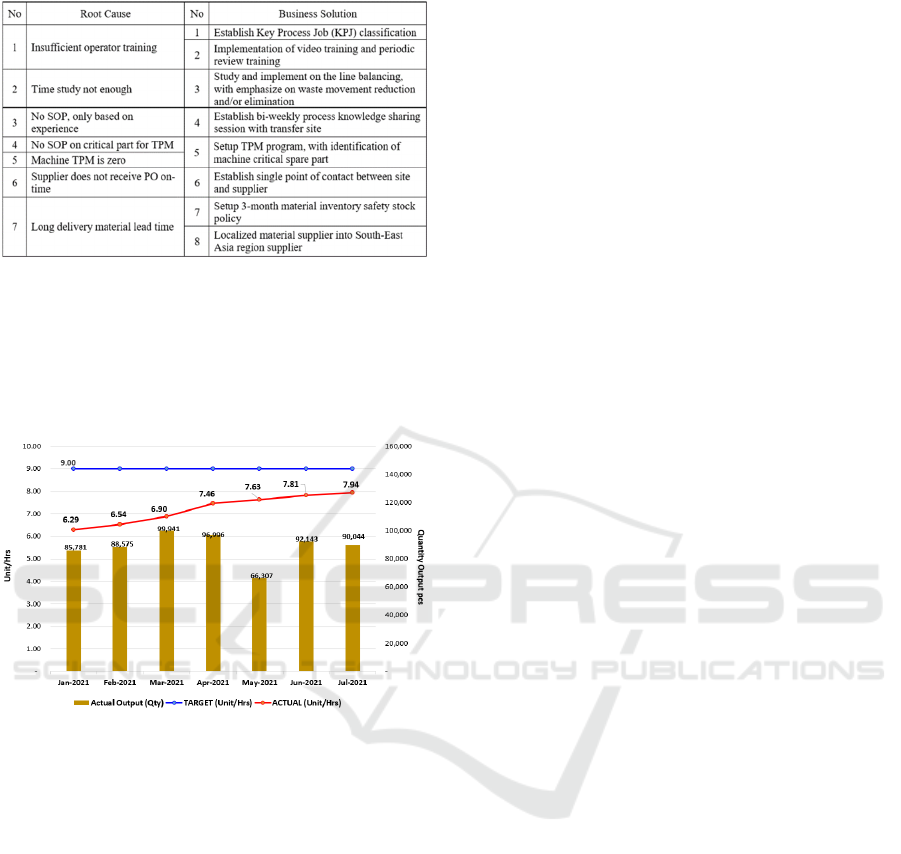
Table 2: Root Cause Analysis and Business Solution
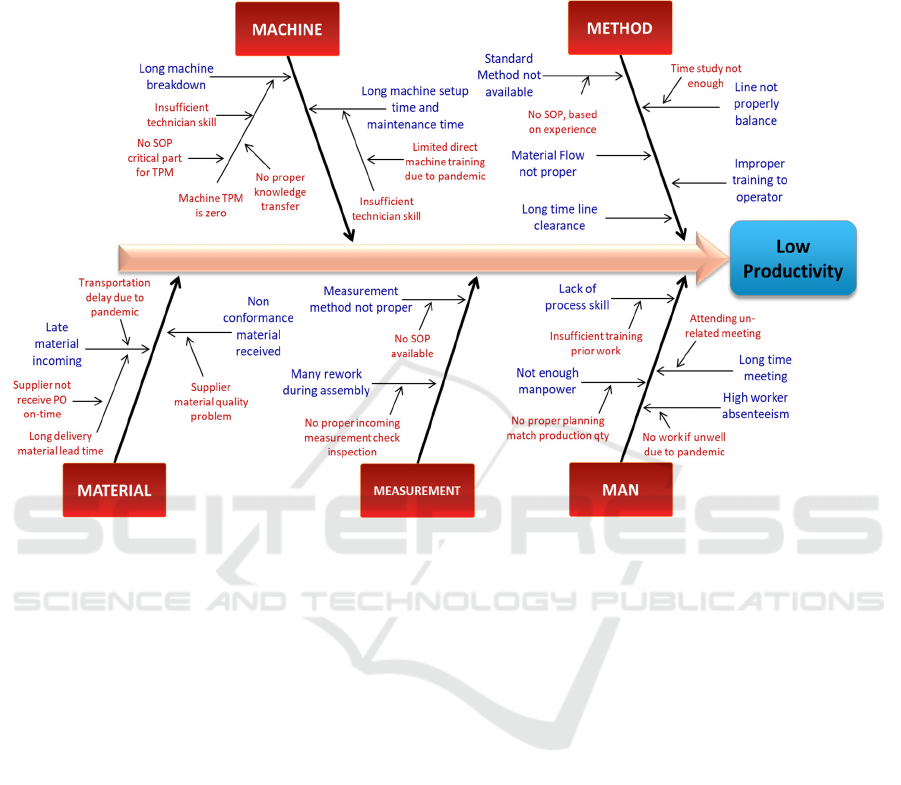
4. Having completed on some business solution
implementation, we can achieve 7.94 units/hour
by Jul 2021. Overall improvement compared with
Dec 2020, productivity is increased from 5.7
units/hour to 7.94 units/hour, improved by 39.3%,
in which very significant improvement.
Figure 6: Chart Productivity Trend Fiber Optic Period Jan
2021 until Jul 2021
Based on our target of 9 units/hour, we still have gap 11.7%.
We are confident, with 3 months towards October 2021,
and some of business solutions are still in-progress for
implementation, we will achieve our target of 9 units/hour.
REFERENCES
Carneli, A. (2003). The relationship between emotional
intelligence and work attitudes, behaviour and
outcomes. Journal of Managerial Psychology, 788-813.
Jabareen, Y. (2009). Building a Conceptual Framework:
Philosophy, Definitions, and Procedure. International
Journal of Qualitative Methods, 49.
Kumar, S., Duhan, M., & Haleem, A. (2016). Evaluation of
factors important to enhance productivity. Cogent
Engineering.
Mahto, D., & Kumar, A. (2008). Application of root cause
analysis in improvement of product quality and
productivity. Journal of Industrial Engineering and
Management, 16-53.
Prodan M, P. A. (2015). Three New Dimensions to People,
Process, Technology Improvement Model. Advances in
Intelligent Systems and Computing.
Vorley, G. (2008). Mini Guide to Root Cause Analysis.
Quality Management and Training Publication.
ICAESS 2021 - The International Conference on Applied Economics and Social Science
194
APPENDIX
Fishbone Diagram (Cause Effect Diagram) for Low Productivity
Case Study: Productivity Improvement in Surgical Manufacturing Company
195

Root Cause Verification Table
Category Potential Root Cause Verification Conclusion
Insufficient Operator
Training
Reviewed initial training plan for project transfer. Discrepancy is found. Planned 14
associates for US training and become trainer. Actual, there was only 2 associates for
trainer, due to difficulty to get US VISA approval to go to US for project transfer training.
Root Cause
No proper planning to match
with production capacity
Reviewed planning horizon and production capacity plan. Monthly production planning
matches with production capacity.
Symptom
Absenteeism due to No work
if unwell policy during
pandemic
New policy for health risk mitigation: if unwell do not come to work. Reviewed
absenteeism, covered by additional work force standby for backfill.
Symptom
Attending unrelated meeting Reviewed all meeting and its duration. It is aligned with anticipated loss time. Symptom
Time study not enough
Proper time study measurement is not done. Bottleneck process(es) was not yet
identified.
Root Cause
No SOP, only based on
experience
Reviewed all SOP which were available. All processes have been covered, either by SOP
and/or Work Instruction. However it was scattered. Need to put into comprehensive and
well-documented SOP.
Root Cause
Limited direct training on
machine due to pandemic
Reviewed training plan on project transfer. Machines training to be done from remote
using video.
Symptom
Insufficient technician skill
Reviewed recruitment process for technicians. It is aligned with the user requirement, and
machine On-Job-Training program covers the requirement.
Symptom
No proper knowledge
transfer
Reviewed training plan on project transfer. Machines training to be done from remote
using video.
Symptom
No SOP on critical part for
TPM
Root Cause
Machine TPM is zero
Root Cause
No measurement SOP
available
Reviewed all SOP which were available. All processes have been covered, either by SOP
and/or Work Instruction. However it was scattered. Need to put into comprehensive and
well-documented SOP.
Symptom
No proper incoming
measurement check
inspection
Reviewed incoming check items. It is aligned with incoming inspection SOP, in which
checking based on supplier data.
Symptom
Supplier material quality
problem
Reviewed on monthly supplier performance. Monthly review on supplier performance is
done, and periodic supplier audit is carried out.
Symptom
Supplier not receive PO on-
time
Root Cause
Long delivery material lead
time
Root Cause
Transportation delay due to
pandemic
Reviewed on logistic supply routing. Due to pandemic, the schedule for material
transportation by sea freight becomes uncertain. Shipment by air freight has been
activated since the beginning of pandemic situation.
Symptom
Reviewed on TPM schedule, with interviewing transfer site associate. Replacement only
done when the machine is start running intermittent, and having frequent stop. There is
no comprehensive schedule on TPM and identification on critical spare parts.
Reviewed on purchase order (PO) step-to-step making. Purchase order (PO) is generated
manually to supplier. It takes time to study and re-group the supplier, as well as to
establish the connection with the supplier’s person of contact. While those are in-
progress, PO generated were often late, causing supplier late in executing the material
supply.
Man
Method
Machine
Measurement
Material
ICAESS 2021 - The International Conference on Applied Economics and Social Science
196
