
Effect of Recruitment, Selection and Employment Training Process
on Employee Performance the Fitter Department of PT NOV Profab
Ghea Arinovanti Anggari
and Mia Syafrina
Applied Business Administration Study Program, Politeknik Negeri Batam, Jl Ahmad Yani, Batam, Indonesia
Keywords: Recruitment, Selection, Job Training, Employee Performance, Multiple Linear Regression
Abstract: This study aims to examine the effect of the Recruitment, Selection, and Job Training process on Employee
Performance at the Fitter Department of PT NOV Profab. This study uses quantitative methods. The
population of this study consisted of employees of the PT NOV Profab assembly department with a total
sample of 73 people. The sampling technique used the Accidental Sampling (Convenience Sampling) method
through a questionnaire given directly to the respondents. The data analysis method used is a descriptive
analysis using multiple linear regression, classical assumption test, t-test, and F test with a significance level
of 0.05 and the coefficient of determination. The results of the study prove that the variables of recruitment,
selection, and work training at the same time have a positive and significant impact on the variable
performance of PT NOV Profab's fitter department employees and the independent variable that has the
greatest influence on the performance variable of PT NOV Profab's fitter department employees is recruitment
because it shows the Standardized Coefficients Beta value, which is greater than the other independent
variables.
1 INTRODUCTION
The factor that supports the company's success is
Human Resource Management, an approach to
human management based on four basic principles.
First, human resources are the most important assets
owned by an organization, while effective
management is the key to an organization’s success.
Second, this success is very likely to be achieved if
the rules or policies and procedures related to the
company’s people are interconnected, and contribute
to the achievement of company goals and strategic
planning. Third, the culture and values of the
company, organizational atmosphere, and managerial
behavior that comes from that culture will have a
significant influence on the best achievement results.
Fourth, HR management is related to integration,
making all members of the organization members,
and working together to achieve common goals
(Hamali, 2016).
The most essential Human Resources (HR)
activity is recruiting and selecting prospective new
employees. The process of recruiting and selecting
employees is a stage that can affect the efficiency and
productivity of the company. In addition, the
recruitment and selection process is very it is
important to manage prospective employees who
come from different backgrounds, skills, and abilities
to hiring employees with skills and types of work that
match their abilities.
This research is focused on PT NOV Profab, a
manufacturing company in the field of steel
equipment construction with international market
orientation and experience in the manufacture of
pressure vessels, piping systems, heavy
constructions, anchoring systems, and modular
processes. for oil and gas production. PT NOV Profab
recruits new employees based on the Request
Manpower Supply. Each company has its recruitment
objectives, which are related to what has been made
by the workforce planner so that what the recruiting
party wants to do must be aligned and adjusted to the
needs of the workforce. For example, in terms of the
time required, the amount required and the
qualifications required.
One of the departments in the production team is
the fitter department. Fitter is an expert in the
fabrication, installation of production, and
construction equipment, as well as an expert in the
repair or maintenance of industrial machines. In the
fabrication and construction project at PT NOV
Profab, there are 3 (three) types of fitters, namely
Anggari, G. and Syafrina, M.
Effect of Recruitment, Selection and Employment Training Process on Employee Performance the Fitter Department of PT NOV Profab.
DOI: 10.5220/0010860400003255
In Proceedings of the 3rd International Conference on Applied Economics and Social Science (ICAESS 2021), pages 171-178
ISBN: 978-989-758-605-7
Copyright
c
2022 by SCITEPRESS – Science and Technology Publications, Lda. All rights reserved
171

fitter structure, fitter piping, and fitter's vessel. Fitter
structure is the expertise that people have in
fabricating activities from metal and steel starting
from a drawing, marking, adjustment, and erection or
fit-up techniques and is more directed to plate
making. Meanwhile, a piping fitter is a partner for a
welder. The fit-up is carried out first by a piping fitter
before a welder performs a series of welding on a
pipe. Fitter's vessel is to efficiently fabricate various
types of ASME-coded pressure vessels safely by
company quality standards.
To improve the performance of PT NOV Profab
employees, company leaders are required to be able
to implement human resource management (HR). The
achievement of an organization's objectives is
generally determined by the presence of high-
performing human resources (HR). PT NOV Profab
has an excellent and comfortable work environment
that facilitates good relations between workers. A
good working environment can reduce fatigue and a
sense of burden for employees at work. The
appearance of problems led the company to create a
program to maintain, maintain and improve the
quality of human resources (HR). Training activities
need to be carried out to support these programs. Job
training is the right solution to build human resource
(HR) capabilities which are expected to help face the
challenges of corporate competition. Job training is
expected to be able to improve employee skills which
will ultimately affect employee work results. Training
can also minimize the mistakes that have been made
by employees, thereby reducing the decline in
employee performance in the future.
The foundation of this study was to identify the
method of recruitment, selection, and job training that
affects worker performance and to identify the main
weight factors behind worker performance in the
assembly department.
2 LITERATURE REVIEW
2.1 Recruitment
Recruitment is a company or organization’s process
to attract potential employees with skills and
qualifications related to the company or
organization's needs (Mardianto, 2014).
2.2 Selection
Selection is the process of using company regulations
to select employees who meet the available work
standards (Danang, 2012).
2.3 Work Training
That the company plans to provide training and
development for employees to learn various job skills
and attitudes (Daft, 2012).
2.4 Employee Performance
Performance is the result or level of success of an
individual as an entire during a certain period in
carrying out assignments compared to different
possibilities, such as work measures, targets, or
criteria that have been already agreed upon (Rivai &
Basri, 2016).
In a company, filling vacancies caused by growth,
changes in structure and function, or employee
turnover requires the search for people who can meet
the standard requirements for vacant positions from
internal and external sources. Therefore, one aspect
of the selection decision is the decision on where to
recruit.
The company will pay great attention to the
selection process because it is the initial step to build
the quality of the company so that the results of a
careful selection can be beneficial for both employees
and the company. Performance has become the most
frequently used concept in the framework of driving
the success of companies or human resources.
Training is needed in the company because the
program can help improve the abilities and skills of
employees.
The importance of training as an effort to develop
the intellectual abilities and personality of employees.
Therefore, every company that wants to develop,
training its employees must receive greater attention
to improve the performance of these employees.
Efforts to improve performance with quality human
resources are training programs. Lack of attention to
employee job training will hamper employee
performance and also work productivity will be low,
so a training program is needed in order to raise the
level of perseverance and discipline in carrying out an
activity so as to increase employee performance.
ICAESS 2021 - The International Conference on Applied Economics and Social Science
172
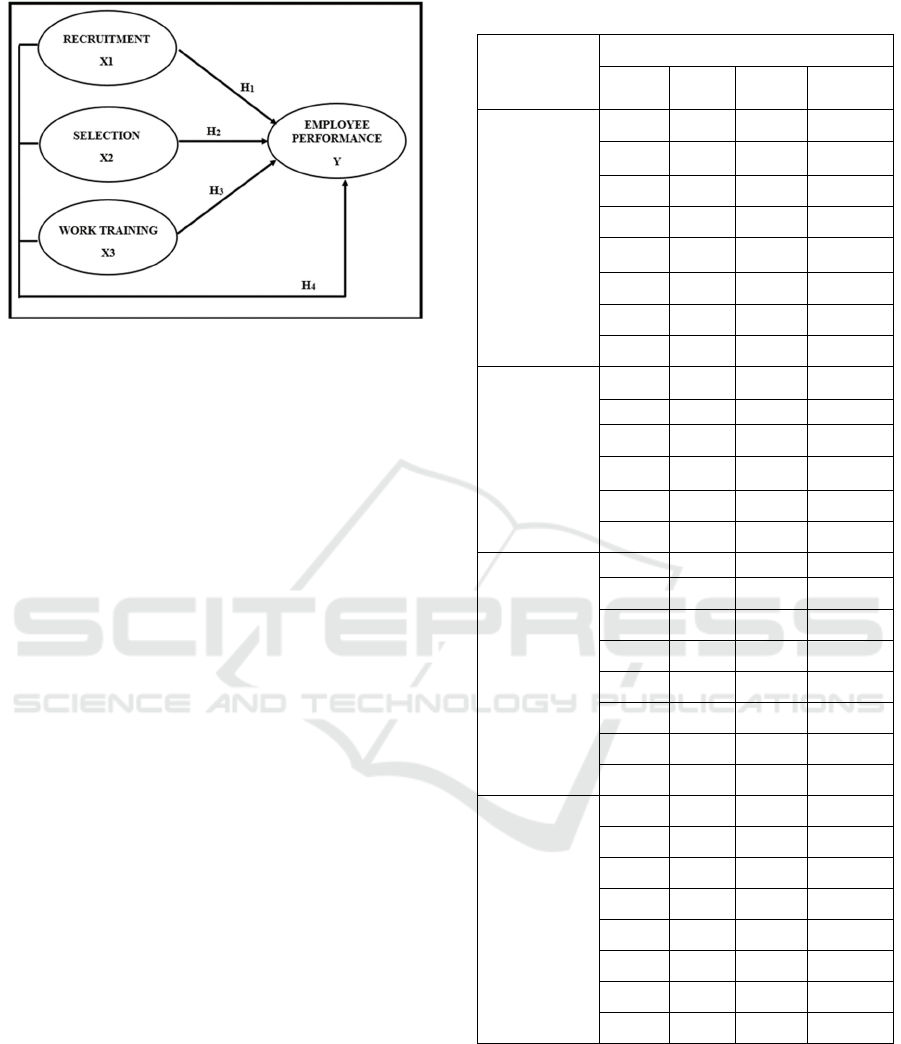
(Source: Data Processing Results, 2020)
Figure 2.1: Framework for Thinking.
3 METHODOLOGY
3.1 Populations and Samples
The populace in this consider were workers of the
fitter department at PT NOV Profab divided into three
work positions, specifically fitter structure, fitter
piping, and fitter vessel, which were shaded by 20
foremen. The sample used in the study were workers
who had attended OHC (Over Head Crane) job
training, totalling 73 people.
3.2 Methods of Data Collection
The quantitative methodology is used as a research
process that generates data in the form of numbers
and is generally analysed using descriptive and
inferential statistics (Silaen, 2018). This study uses a
questionnaire survey technique, which is a data
collection tool.
The research method used is descriptive analysis
with Multiple Linear Regression, Classical
Assumption Test, t-test, and F Test with a
significance level of 0.05 and the Coefficient of
Determination.
4 DATA ANALYSIS AND
INTERPRETATION
4.1 Validity Test
The following is a table of validity test results foreach
variable used in this study, which can be seen inside
the taking after table:
Table 4.1: Validity Test Results.
Variable
Validity
Items
r
count
r
table
Decision
Recruitment
(X1)
X1.1 0,560 0,2303 Valid
X1.2 0,636 0,2303 Valid
X1.3 0,662 0,2303 Valid
X1.4 0,616 0,2303 Valid
X1.5 0,707 0,2303 Valid
X1.6 0,830 0,2303 Valid
X1.7 0,543 0,2303 Valid
X1.8 0,544 0,2303 Valid
Selection
(X2)
X2.1 0,652 0,2303 Valid
X2.2 0,698 0,2303 Valid
X2.3 0,768 0,2303 Valid
X2.4 0,798 0,2303 Valid
X2.5 0,689 0,2303 Valid
X2.6 0,663 0,2303 Valid
Work
Training
(X3)
X3.1 0,566 0,2303 Valid
X3.2 0,686 0,2303 Valid
X3.3 0,630 0,2303 Valid
X3.4 0,677 0,2303 Valid
X3.5 0,600 0,2303 Valid
X3.6 0,704 0,2303 Valid
X3.7 0,728 0,2303 Valid
X3.8 0,683 0,2303 Valid
Employee
Performance
(Y)
Y.1 0,588 0,2303 Valid
Y.2 0,711 0,2303 Valid
Y.3 0,752 0,2303 Valid
Y.4 0,498 0,2303 Valid
Y.5 0,642 0,2303 Valid
Y.6 0,688 0,2303 Valid
Y.7 0,771 0,2303 Valid
Y.8 0,714 0,2303 Valid
(Source: SPSS Data Processing version 21, 2021)
Based on Table 4.1 above, test the validity of the
variable indicators of recruitment statements (X1),
selection (X2), job training (X3) and employee
performance (Y) which were tested with SPSS
version 21, it can be seen that the r-value counts all
explanation items/indicators more prominent than r
table of 0.2303 so it can be said that all statements are
Effect of Recruitment, Selection and Employment Training Process on Employee Performance the Fitter Department of PT NOV Profab
173
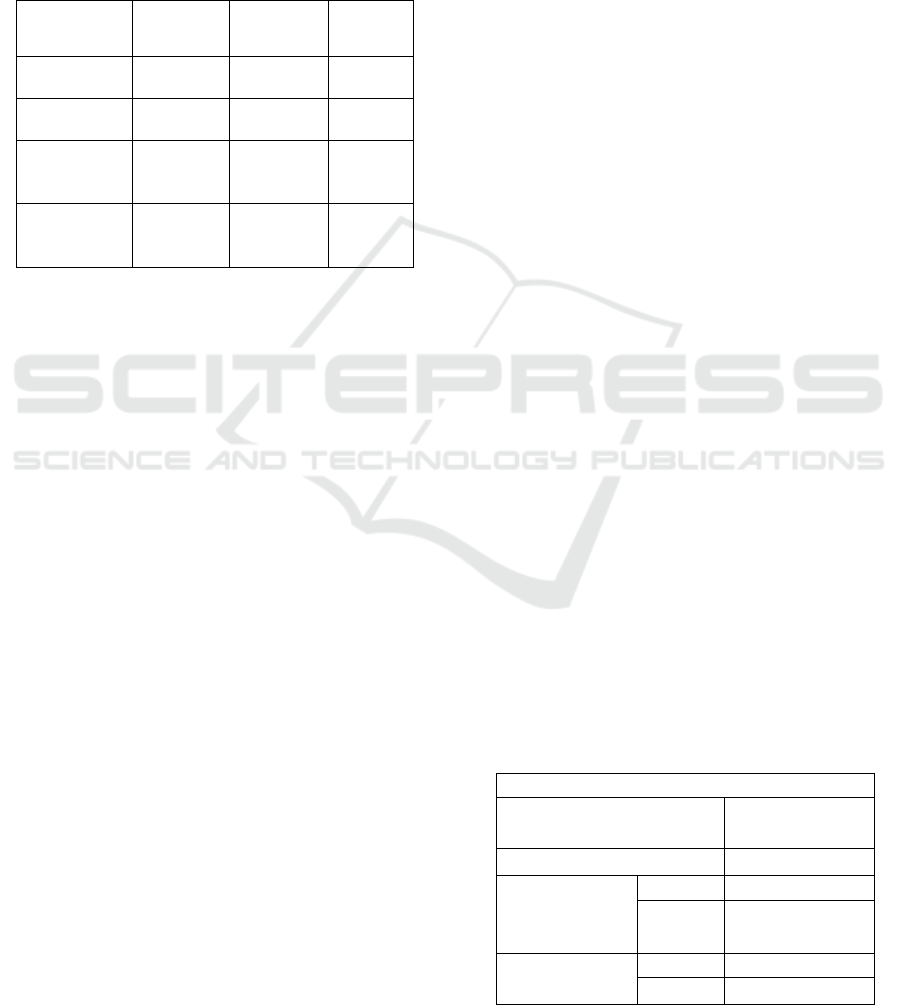
valid and meet the requirements to be utilized as a
measuring instrument.
4.2 Reliability Test
The following is a table of reliability test results for
each variable used in this study, shown in the table
below:
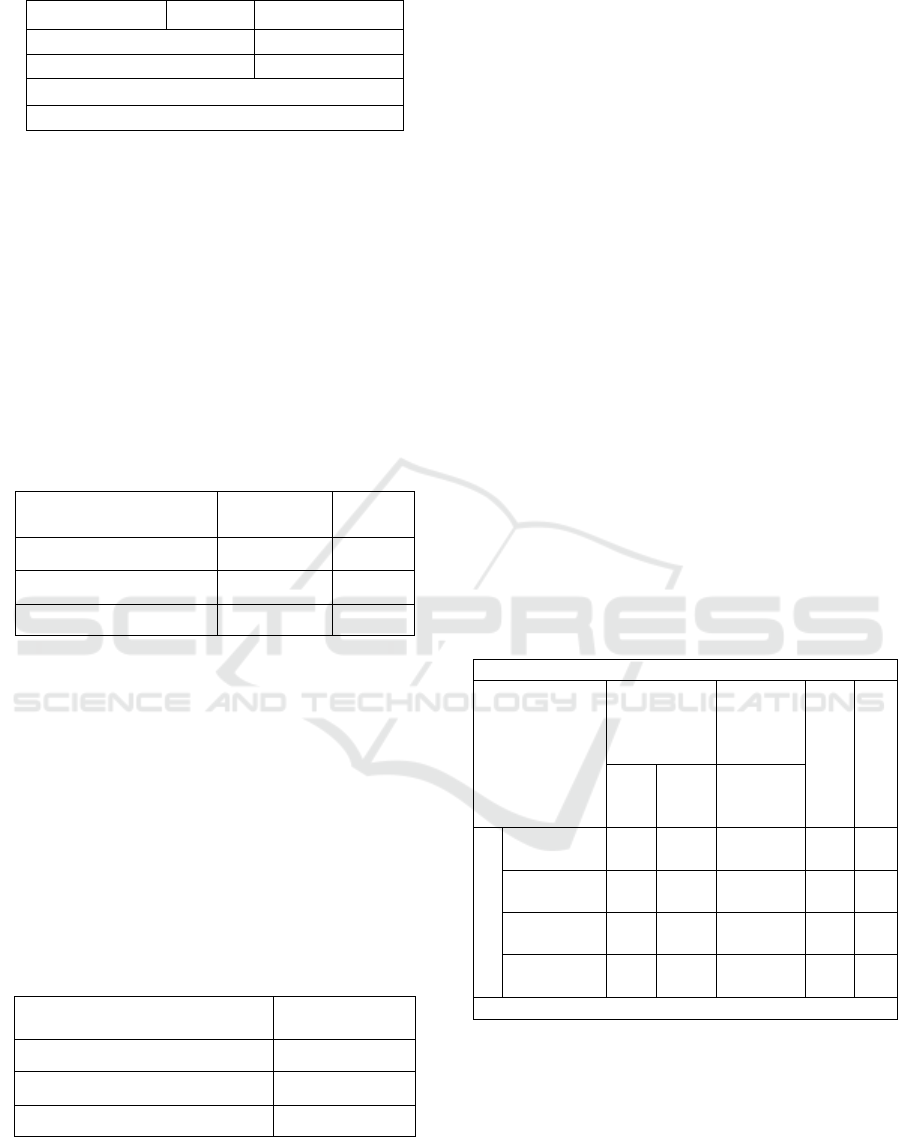
Table 4.2: Reliability Test Results.
Variable
Alpha
Cronbach
Standard
Value
Decision
Recruitmen
t (X1)
0,794 0,60 Reliable
Selection
(X2)
0,806 0,60 Reliable
Work
Training
(X3)
0,814 0,60 Reliable
Employee
Performanc
e (Y)
0,820 0,60 Reliable
(Source: SPSS Data Processing version 21, 2021)
Based on the results of the reliability test in Table
4.2, it can be observed that all the statements /
indicators for the variables recruitment (X1),
selection (X2), job training (X3), and employee
performance (Y) they have Cronbach's alpha values.
Greater than 0.60, so that all statements / indicators
are reliable.
A classical assumption test is performed to test
whether the regression model used in this study is
feasible or not. You need to make classical
assumptions. Classical assumption test used is the
multiple linear regression test, the normality test, the
multicollinearity test, and the heteroscedasticity test.
4.3 Multiple Linear Regression
Multiple linear regression analysis is an analysis that
measures the effect of two or more independent
variables on a dependent variable.
The multiple linear regression formula is as
follows:
Y = 6.487 + 0.297X1 + 0.320X2 + 0.257X3 + e (1)
The regression coefficients result from the results
of this multiple linear regression calculation as
follows:
1) The constant of 6.487 means that recruitment
(X1), selection (X2), job training (X3) are 0, then
employee performance (Y) is 6.487.
2) Recruitment (X1) has a regression coefficient
value of 0.297 and is positive. That is, if the
independent variable has a fixed value or does not
change, the increase in an employee performance
unit increases by 0.297.
3) Selection (X2) has a regression coefficient of
0.320 and is positive. That is, if the independent
variable has a fixed value or does not change, the
increase in one unit of employee performance
increases by 0.320.
4) Job training (X3) has a regression coefficient of
0.257 and is positive, which means that if the
explanatory variable is constant or invariant, an
increase by one unit of worker productivity will
increase by 0.257.
To find out which independent variables between
recruitment (X1), selection (X2), and job training
(X3) have the most significant influence on employee
performance variables (Y), the Standardized
Coefficient Beta test is used by looking at the highest
test results. It can be seen that the variable that has the
most significant influence is the recruitment variable
(X1) with the Standardized Coefficient Beta value,
which is greater than the other independent variables,
which is 0.363.
4.4 Normality Test
The normality test is a test that aims to evaluate the
normality of the data distribution to find out whether
the data distribution is normally distributed or not.
The test of normality of the data used in this study is
the Kolmogorov-Smirnov test. According to Sunariah
(2014), it is provided that the distribution of the data
is usually distributed, that is when the value of the
asymptotic significance (2-tailed) is greater than the
alpha value of 0.05.
The results of the normality test in this study are
shown in the following table:
Table 4.3: Normality Test Results.
One-Sample Kolmogorov-Smirnov Test
Unstandardized
Residual
N
73
Normal
Parameters
a,b
Mean
.0000000
Std.
Deviation
1.71591779
Most Extreme
Differences
Absolute
.061
Positive
.061
ICAESS 2021 - The International Conference on Applied Economics and Social Science
174
Negative
-.039
Kolmogorov-Smirnov Z
.523
Asymp. Sig. (2-tailed)
.947
a. Test distribution is Normal.
b. Calculated from data.
(Source: SPSS Data Processing version 21, 2021)
4.5 Multicollinearity Test
The multicollinearity test is used to test whether the
independent variables are correlated with each other
or not. The existence of a correlation is called
multicollinearity (Ghozali, 2011). Multicollinearity
can be seen within the tolerance value and the
Variance Inflation Factor (VIF). If the tolerance value
is> 0.1 and the VIF value & lt; 10 means there is no
multicollinearity. The results of the multicollinearity
test can be found in the following table:
Table 4.4: Multicollinearity Test Results.
Variable Tolerance VIF
Recruitment (X1)
0,753 1,328
Selection (X2)
0,917 1,091
Work Training (X3)
0,729 1,371
(Source: SPSS Data Processing version 21, 2021)
4.6 Heteroscedasticity Test
This test is used to test whether the variance of the
regression error depends on the values of the
independent variables. The heteroscedasticity test in
this consideration uses the glacier test, to be more
precise, returning the absolute value of the residual on
the independent variable when the value of t counts <
t > 0.05.
To see if heteroscedasticity can be seen in the
following table:
Table 4.5: Heteroscedasticity Test Results.
Variable Sig.
Recruitment (X1)
0,411
Selection (X2)
0,364
Work Training (X3)
0,852
(Source: SPSS Data Processing version 21, 2021)
Based on Table 4.5, it can be observed that the
significance of the variables recruitment, selection,
and job training is more significant than 0.05. Thus,
it can be said that there are no symptoms or problems
of heteroscedasticity in the regression model of this
study.
4.7 T-test
A t-test is required to partially test (o) the significance
of the influence of the independent variable (X) on
the dependent variable (Y). The criteria to tolerate or
reject the hypothesis are:
− If t-count < t-table, until H0 is acknowledged, Ha is
rejected, which influences significantly.
− If t-count < t-table, until H0 is rejected, Ha is
acknowledged, which influences significantly.
To find the value of t-table can be searched using the
formula for the value of df (degree of freedom) as follows:
df = ( n - k ) (2)
df = ( 73 - 3 )
df = ( 70 )
With a significance level of =5%, so that the t-value is
1.994. So the partial effect in this study can be seen in the
following table:
Table 4.6: T Test Results.
Coefficients
a
Model
Unstandar
dized
Coefficient
s
Standar
dized
Coeffici
ents
t
Sig.
B Std.
Erro
r
Beta
1
(Constant) 6.4
87
3.12
0
2.0
79
.0
41
Recruitm
ent
.29
7
.077 .363 3.8
42
.0
00
Selection .32
0
.084 .327 3.8
22
.0
00
Work
Trainin
g
.25
7
.083 .298 3.1
01
.0
03
a. Dependent Variable: Kinerja
(Source: SPSS Data Processing version 21, 2021)
Table 4.6 shows the results of the t-test with the
following explanation:
1) Effect of Recruitment on Worker Performance
Based on the results of the t-test (partial), the t-
count value of recruitment (X1) is 3.842 > 1.994
and sig value is 0.00 < 0.05. It can be expressed
Effect of Recruitment, Selection and Employment Training Process on Employee Performance the Fitter Department of PT NOV Profab
175
that the recruitment variable (X1) features an
upbeat and most significant impact on the worker
performance variable based on the results of
previous research conducted by Andrian, Utami,
& Mayowan (2017), that found that "recruitment
has a significant positive effect on performance".
2) Effect of Selection on Worker Performance
Based on the results of the t-test (partial) the t-
count selection value (X2) is 3.822 > 1.994 and
sig value is of 0.00 < 0.05. It can be expressed that
the selection variable (X2) features an upbeat and
most significant impact on the worker
performance variable based on the results of
previous research conducted by Andrian, Utami,
& Mayowan (2017), that choice has a significant
positive effect on performance.
3) The Impact of Work Training on Worker
Performance
Based on the results of the t-test (partial) the t-
count value of work training (X3) is 3.101 > 1.994
and the sig value is 0.00 < 0.05. It can be
expressed that the work training variable, which is
based on the results of previous research
conducted by Dwihatmojo, Nelwan, & Kawet
(2016), states that job training has an effect on
employee performance.
4.8 F Test
The F test was used to test the significance of the
influence of the independent variable (X) on the
dependent variable (Y) at the same time. The results
of the F test in this study are shown in the following
table:
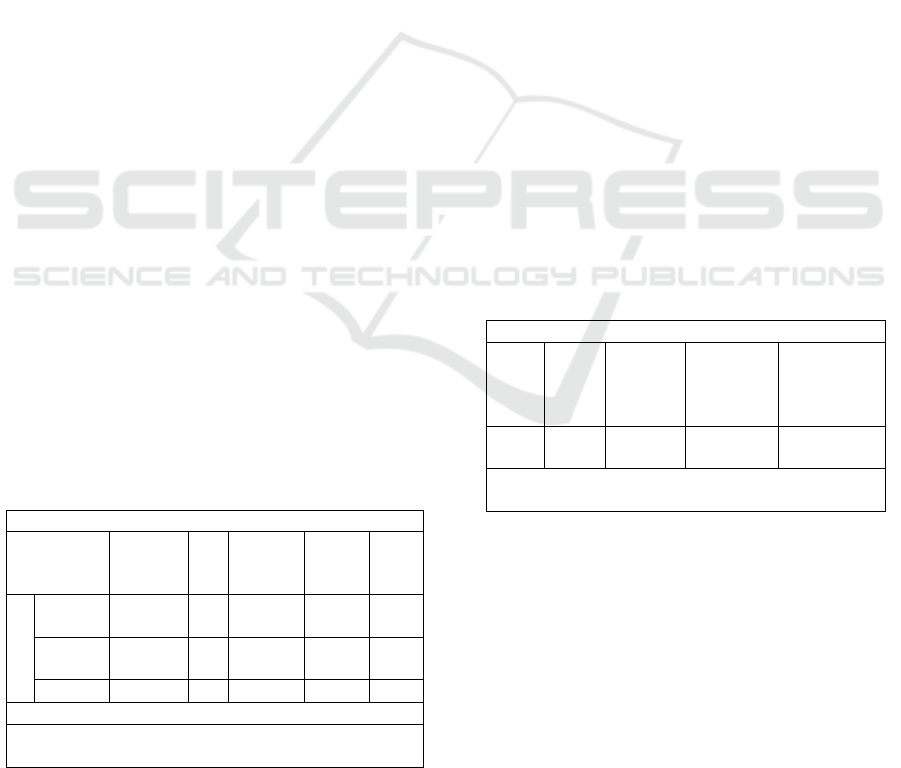
Table 4.7: F Test Results.
ANOVA
a
Model
Sum of
Square
s
df
Mean
Squar
e
F Sig.
1 Regres
sion
245.567 3 81.856 26.64
2
.000
b
Residu
al
211.995 69 3.072
Total 457.562 72
a. Dependent Variable: Kinerja
b. Predictors: (Constant), Work Training,
Selection, Recruitment
(Source: SPSS Data Processing version 21, 2021)
Based on Table 4.7 above, the F count value is
26,642 with a Sig value. 0.000. The value of the F
table can be found using the formula for the value of
df (degree of freedom) with a significance level of 5%
of 5% as follows:
df1 (numerator) = k-1 (3)
= 4-1
= 3
df2 (denominator) = n-k (4)
= 73-4
= 69
So that the value of F table is 2.74.
Based on the table above, the calculation results
obtained with the value of F count 26.642 > F table
2.74 and sig value is 0.00 < 0.05. This appears that
there is an upbeat and significant impact between
recruitment, selection, and job training on the
performance of PT NOV Profab's fitter department
employees.
4.9 Coefficients of Determination Test
It is required to test the coefficient of determination
(R2) to calculate the contribution of all the
independent variables to the variance of the
dependent variable, which can be observed in the
following table:
Table 4.8: Coefficient of Determination Test Results.
Model Summar
y
Mo
del
R
R
Square
Adjuste
d
R
Square
Std. Error
of the
Estimate
1 .733
a
.537
517 .753
a. Predictors: (Constant), Pelatihan Kerja,
Seleksi, Rekrutmen
(Source: SPSS Data Processing version 21, 2021)
Based on Table 4.8 above, the results of the
Summary Model show that the independent variables
of recruitment, selection, and job training contribute
53.7% to the dependent variable of employee
performance. The rest is explained by other variables
that do not fit in this study.
ICAESS 2021 - The International Conference on Applied Economics and Social Science
176

5 DISCUSSION
This discussion is examined to examine and analyze
how the influence of the dependent variable, namely
recruitment, selection, and job training on the
dependent variable, namely the performance of PT
NOV Profab's fitter department employees. The
results of the hypothesis test demonstrate that:
1. The Effect of Recruitment on Employee
Performance
Based on the results of the hypothesis test, there is
a significant positive effect between hiring on the
performance of employees in the fitter department
of PT NOV Profab Indonesia. This is supported
by the average result (mean) in the description of
the answers to the recruitment variable which
shows a high mean value of 4.33. From these
results, it can be seen that the company has a good
recruitment process so that it can improve
employee performance, such as employees of the
fitter department who can understand their job
descriptions well. However, the recruitment
process must be ensured so that it can be carried
out without being complicated or the process is
not too long by measuring "Time to Hire" such as
dividing the recruitment process from CV
screening to interviews.
2. The Effect of Selection on Employee Performance
According to the results of the hypothesis test,
there is a significant positive effect between the
selection on the performance of the employees of
the fitter department of PT NOV Profab
Indonesia. This is supported by the average result
(mean) in the description of the answers to the
selection variable which shows a high mean value
of 4.36. From these results, it can be seen that the
company has a good selection process so that it
can improve employee performance, such as
employees of the fitter department having a good
health record before starting work.
3. The Effect of Job Training on Employee
Performance
According to the results of the hypothesis test,
there is a significant positive effect between job
training on the performance of employees in the
fitter department of PT NOV Profab Indonesia.
This is supported by the average result (mean) on
the description of the answers to the job training
variable which shows a high mean value of 4.40.
From these results, it can be seen that the company
has a good job training process so that it can
improve employee performance, such as
employees of the fitter department who feel their
productivity has increased after attending job
training. However, in the job training process, it
must also be ensured that the facilities and
infrastructure are more adequate when they want
to be used. With the hope that after participating
in job training, employees can reduce the rate of
work accidents at work.
4. The Effect of Recruitment, Selection and Job
Training on Employee Performance
Based on the results of the hypothesis tests, which
are interpreted (simultaneously) through
recruitment, selection, and job training, this has a
significant positive influence on the performance
of employees in PT NOV Profab Indonesia's fitter
department employees. Test results show that
recruiting, selection, and training processes can
improve employee performance. This means that
the company must ensure that the process can
have a significant positive effect and that there are
other variables outside of this study that also
affect the performance of the fitter department
employees.
5. Which variable has the most influence on
Employee Performance
From the results of the Standardized Coefficient
Beta Test, the results for the recruitment variable
of 0.363, the selection variable of 0.327, and the
job training variable of 0.298. From these results,
it can be seen that the attitude variable has the
greatest impact on employee performance, with a
higher score than other independent variables.
6 CONCLUSION
Based on the results of research on recruitment,
selection, and job training to influence the
performance of employees in the fitter department of
PT NOV Profab Indonesia. So, the conclusions of this
study are as follows:
1. The recruitment process has a positive and
significant impact on the performance of PT NOV
Profab Indonesia's fitter department employees. If
the company wants the performance of its
Effect of Recruitment, Selection and Employment Training Process on Employee Performance the Fitter Department of PT NOV Profab
177

employees to be higher, the quality and
effectiveness of the recruitment process will
always be improved.
2. The selection process has a positive and
significant impact on the performance of PT NOV
Profab Indonesia's fitter department employees. If
the company wants the performance of its
employees to be higher, then the selection process
will always be improved in terms of ability and
quality.
3. The job training process has a positive and
significant effect on the performance of the fitter
department employees of PT NOV Profab
Indonesia. If the company wants the performance
of its employees to be higher, then the job training
process is constantly improving their skills and
expertise.
4. The process of recruitment, selection, and job
training have a positive and significant effect on
the performance variables of PT NOV Profab
Indonesia's fitter department employees. With the
results of these tests, there are other variables
outside of this study that can affect the
performance of the fitter department employees.
5. The recruitment process has the greatest influence
on the performance of PT NOV Profab
Indonesia's fitter department employees. This can
be seen from the value generated from the
Standardized Coefficients Beta test by looking at
the highest test results.
REFERENCES
Andrian, K., Utami, H. N., & Mayowan, Y. (2017).
Pengaruh Rekrutmen dan Seleksi Terhadap Kinerja dan
Intention to Leave pada Karyawan PT Cahaya Kurnia
Motor, Bekasi. Jurnal Administrasi Bisnis, 50, 74-84.
Daft, R. L. (2012). Manajemen. (E. Tanujaya, & S. Tiolina,
Trans.) Jakarta: Salemba Empat.
Danang, S. (2012). Manajemen Sumber Daya Manusia.
Jakarta: PT Buku Seru.
Dwihatmojo, S., Nelwan, O. S., & Kawet, R. C. (2016).
Rekrutmen, Pelatihan Dan Pembagian Kerja
Pengaruhnya Terhadap Kinerja Karyawan Pada CV.
Jati Jaya Meubel Amurang. Jurnal EMBA : Jurnal Riset
Ekonomi, Manajemen, Bisnis dan Akuntansi, 4, 120-
129.
Ghozali, I. (2011). Aplikasi Analisis Multivariate dengan
Program SPSS. Semarang: Badan Penerbit Universitas
Diponegoro.
Hamali, A. Y. (2016). Pemahaman Manajemen Sumber
Daya Manusia, Strategi Mengelola Karyawan.
Yogyakarta: CAPS (Center of Academic Publishing
Service).
Kasmadi, & Sunariah, N. S. (2014). Panduan Modern
Penelitian Kuantitatif. Bandung: Alfabeta.
Mardianto, A. (2014). Management Recruitmen. Jakarta:
Pinasthika Publisher.
Rivai, V., & Basri. (2016). Performance Appraisal: Sistem
Yang Tepat Untuk Menilai Kinerja Karyawan Dan
Meningkatkan Daya Saing Perusahaan. Jakarta:
Grafindo.
Silaen, S. (2018). Metodologi Penelitian Sosial Untuk
Penulisan Skripsi dan Tesis. Bandung: In Media.
ICAESS 2021 - The International Conference on Applied Economics and Social Science
178
