The Effect of Liquidity, Profitability, and Solvency to the Financial
Distress in Agricultural Sector Companies Listed on the Indonesia
Stock Exchange (IDX)
Egi Lolita Sukma
1
, Ria ANggraini
1
and Hanna Tiurma Tinambunan
2
1
Managerial Accounting, Politeknik Negeri Batam, Jl Ahmad Yani, Batam, Indonesia
2
Department of Business Administration, Illinois University, Illinois, U.S.A.
Keywords: Financial Distress, Financial Ratios, Liquidity, Profitability, Solvability, Z-Score
Abstract: This study aims to analyse financial ratios, namely liquidity ratios, profitability ratios, and solvency ratios
that affect financial distress conditions. This study uses quantitative research methods. The data used is on
agricultural companies on the Indonesia Stock Exchange (IDX) in 2015-2019, with 75 samples. The
dependent variable of financial distress was measured using the Altman analysis model (Z-Score). The
independent variables were measured using financial ratio indicators, namely liquidity ratios, profitability
ratios, and solvency ratios. This study uses secondary data with database collection techniques and uses a
non-probability sampling technique, purposive sampling. The data used is panel data regression, using the
EViews 9 application. This study shows that the liquidity ratio with the working capital and current ratio to
total assets proxies affects financial distress conditions. Profitability ratios with Return on Equity and return
on assets proxies affect financial distress conditions. The solvency ratio as measured by debt to total assets
affects financial distress conditions. While the solvency ratio analysed by debt to total Equity and time interest
earned does not affect the financial Ratio.
1 INTRODUCTION
Indonesia is an agricultural country. According to the
BPS, in 2019, Indonesian agricultural products
contributed to the gross domestic product (GDP)
value of 13.57% in the second quarter. Thus, one of
the keys to strengthening the national economy still
relies on the agriculture sector. In Indonesia's
economic structure in 2019, the agricultural industry
has provided 12.72% of business fields which are the
third-largest contributor (Central Statistics Agency,
2020). Of course, it is not only the duty of the
government, but companies are also trying to improve
performance in the agricultural sector jointly.
Because if it is optimized, the agricultural industry
may become the most significant contributor to the
country's economy.
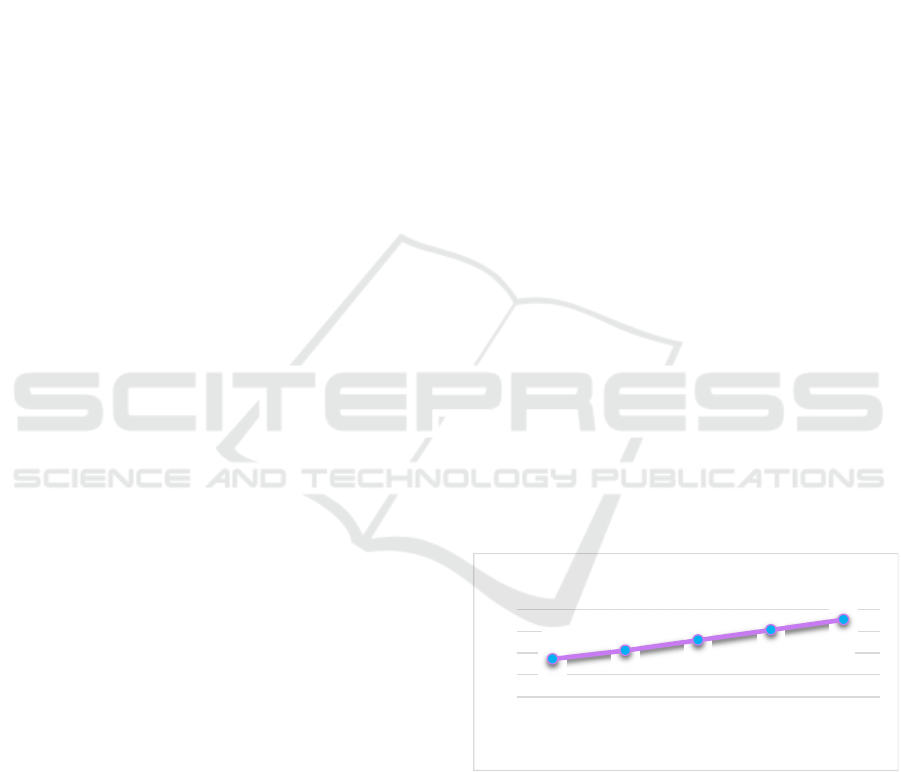
This continuous (real) price GDP is useful for
showing each sector's annual economic growth rate.
For example, based on the graph above, it can be seen
that from 2015 to 2019, GDP, which is calculated at
constant prices by the business sector, increased.
Thus, the development every year shows an increase
which indicates an increase in the performance of the
agricultural industry.
Figure 1: GDP on a constant price basis by business field.
Indonesia, as a developing country, constantly
strives to promote stable economic growth. For this
reason, companies in Indonesia in various sectors can
help realize this by maintaining and improving
company performance, including financial
performance. Various external factors can affect the
Company's actual performance. Companies that are
constantly experiencing decreasing in their
1.171.445,8
1.210.955,5
1.258.375,7
1.307.373,9
1.354.957,3
2015 2016 2017 2018 2019
miliyar rupiah
Source : bps.go.id
Sukma, E., Anggraini, R. and Tinambunan, H.
The Effect of Liquidity, Profitability, and Solvency to the Financial Distress in Agricultural Sector Companies Listed on the Indonesia Stock Exchange (IDX).
DOI: 10.5220/0010860200003255
In Proceedings of the 3rd International Conference on Applied Economics and Social Science (ICAESS 2021), pages 97-108
ISBN: 978-989-758-605-7
Copyright
c
2022 by SCITEPRESS – Science and Technology Publications, Lda. All rights reserved
97
businesses may be feared to experience financial
distress conditions (Khaliq, 2014).
In 2015 there was an unfavourable situation for
the Indonesian economy. There was a weakening of
the rupiah caused by the prolonged crisis in Greece,
the economic recovery in the United States, and the
occurrence of political dynamics during our reign
(Zakaria, 2020). In September 2018, Indonesia again
experienced a weakening of the rupiah, which is due
to the current account deficit, the escalation of the war
in trading between America and China, emerging
market crises such as in Turkey, Iran, Argentina, and
South Africa and the strengthening of the United
States economy (Fauziah & Khoerulloh, 2020).
Quoted from the Greenpeace organization, the
agricultural sector is most affected by the fires from
2015 to 2019. Of the 4.4 million land areas of 1.3
million hectares are oil palm and pulp land.
According to the World Bank, these forest fires have
created negative perceptions of palm oil products, one
of Indonesia's primary export commodities. These
things are external factors of declining performance
so that they can affect business continuity.
As a result of this unfavorable economy,
companies in Indonesia can experience financial
distress, which also impacts company obligations that
have matured. Based on IDX data during 2015-2019,
21 companies have been delisted. It is necessary to
analyze the condition of financial distress as the
concerning of the declining financial condition of a
company. According to Kasmir (2012), companies
are expected to take decisions and actions quickly and
accurately to not cause company failure to
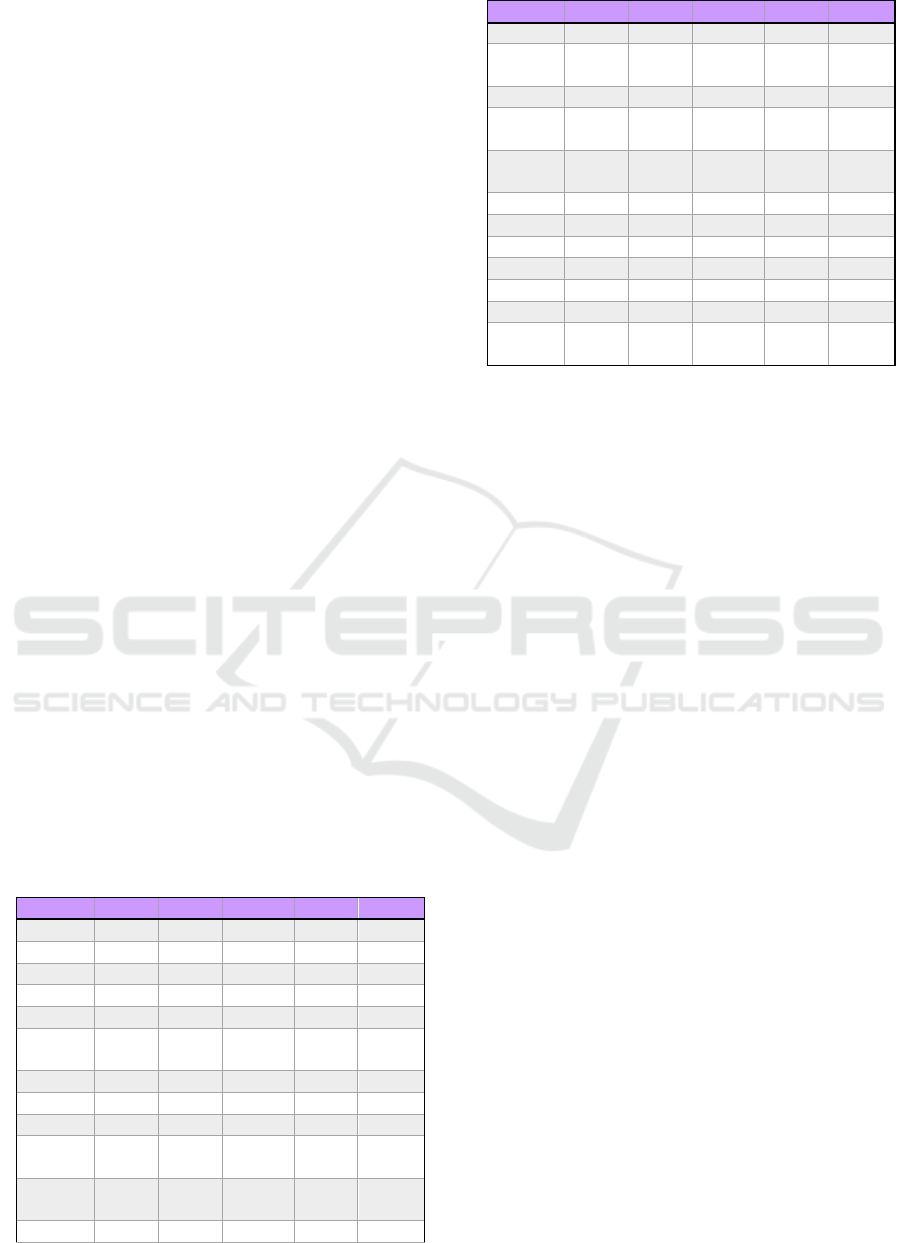
bankruptcy. Some companies in the agricultural
sector experienced a decline in profits to operational
losses.
Table 1: Operating profit of agriculture sector companies.
Emiten 2015 2016 2017 2018 2019
AALI 14,19 18,83 17,63 12,19 5,50
ANDI 14,72 31,36 8,73 17,28 12,53
ANJT 17,04 12,13 44,57 4,69 -5,58
BEEF 4,81 5,17 7,36 10,01 9,46
BISI 22,33 23,79 21,67 21,98 17,61
BWPT 8,75 9,63 13,45 5,85
-
23,37
CSRA
20,40 30,81 20,91 17,42
DSFI 4,12 2,38 2,77 2,63 3,80
DSNG 16,62 10,69 22,69 18,99 12,34
GOLL
-
18,68
12,22 -6,89
-
80,26
-
GZCO 2,53
-
41,14
-5,48
-
35,69
-
90,60
JAWA 11,64 0,70 0,26 -7,24 -6,75
Emiten 2015 2016 2017 2018 2019
LSIP 19,95 21,07 20,23 8,45 5,41
MAGP -0,72
-
83,87
-25,25
-
19,59
-
82,04
MGRO 6,41 6,38 4,19 7,66 3,51
PALM 19,31 21,43 9,93
-
19,41
-
13,09
PGUN
-
236,62
-
69,94
18,79
PNGO 12,43 7,06 7,45
PSGO -7,77 4,78 -4,11 -3,70
SGRO 16,96 15,34 18,02 10,95 9,43
SIMP 11,80 14,11 11,48 6,86 4,78
SMAR 2,81 4,86 4,44 4,23 2,97
SSMS 37,33 32,87 36,63 16,65 69,83
UNSP 4,23 3,68 10,07 -7,88
-
15,89
It can be seen from the table above that several
companies such as Astra Agro Lestari Tbk, Andira
Agro Tbk, BISI International Tbk, PP London
Sumatra Indonesia Tbk, Sampoerna Agro Tbk, Sawit
Sourcemas Sarana Tbk experienced a decline in
financial performance. Several companies even
suffered losses, such as Austindo Nusantara Jaya Tbk,
Gozco Plantations Tbk, Provident Agro Tbk, Eagle
High Plantations Tbk, Jaya Agra Wattie Tbk, Multi
Agro Gemilang Plantation Tbk, Palma Serasih Tbk,
Bakrie Sumatra Plantations Tbk.
According to the IDX, one of the agricultural
sector companies was also sued for bankruptcy in
2020. There were reports of near bankruptcy from PT.
Golden Plantation Tbk (GOLL); this happened
because of two subsidiaries of GOLL, namely PT
Bumiraya Investindo and PT Airlangga Sawit, had
been declared bankrupt. GOLL was sued for
bankruptcy so that it received a special notation 'B',
to note that the special notation 'B' means the issuer
has a petition for a declaration of bankruptcy. The
main reason is because of the negligence of the
management of the company, namely not calculating
financial ratios so that they do not understand the
Company's actual financial condition.
The liquidity ratio or financial ratio shows the
Company's performance in paying its obligations in
the short-term. This Ratio is to calculate and show the
Company's liquidity. For example, suppose the
Company cannot properly manage all its operational
needs. In that case, it will make it difficult for the
Company to pay off its obligations so that at times
like this, the Company will feel financial distress. The
profitability ratio is the ratio of the Company's profit
management (Dewi & Wirajaya, 2013). If the
Company's profitability increases, it can be safe or
avoid a financial crisis. The leverage or solvency ratio
ICAESS 2021 - The International Conference on Applied Economics and Social Science
98

shows company’s ability meeting all of its financial
obligations. If the Company can manage finances
well, Company will be free from financial distress.
Although many previous studies have discussed
how profitability, liquidity and solvency affect
financial distress, the study's results still contain
inconsistencies. Several related studies have
previously been conducted abroad, namely Vietnam,
China, France, Malaysia, and the UAE. They proved
that liquidity, profitability, and solvency significantly
affect financial distress (Vinh, 2015). Another study
by Geng, Bose, & Chen (2014) and Mselmi, Lahiani,
& Hamza (2017) also showed the same results. A
study conducted by Yap, Munuswamy, & Mohamed
(2012) confirmed that liquidity affected financial
distress while profitability and solvency had no
effect. His research shows that profitability has a
significant impact, and liquidity does not
substantially impact financial distress (Zaki, Bah, &
Rao, 2011).
In addition to these countries, related research is
also carried out in Indonesia. Describes the impact of
liquidity, profitability, and leverage on financial
distress, which shows that the three ratios have a
significant effect (Hanifa, 2019). In the same year,
research was also conducted by Fitri & Zannati
(2019). The study results revealed that liquidity and
solvency affect financial distress, while profitability
affected financial distress. Research with the results
of liquidity and solvency ratios has a significant
impact on financial distress (Yuliatri, 2018).
Another study conducted by Afiqoh & Laila
(2018) shows that profitability and solvency affect
financial distress. In the same year, research by
Debora (2018) shows that solvency has a positive
effect, and liquidity affect the financial distress of the
company. The study results, which explained that
solvency has a significant impact, while liquidity and
profitability did not have a considerable impact on
financial distress was carried out by (Hanifah &
Purwanto, 2013). Other studies also explain that
liquidity and solvency do not affect financial distress
(Putri & Merkusiwati, 2014).
Previous research has proven that liquidity and
profitability effect on financial distress significantly.
DAR & DER substantially impacts solvency proxies,
while TIE does not substantially affect financial
distress. This research replicates Rusli, Prihatni &
Buchdadi (2019), who researched in Indonesia. This
research differs from others in terms of the sample
and year of research. This research draws a sample of
companies in the agricultural sector listed on the IDX
from 2015-2019. Therefore, researchers are
interested in researching with the title "The Effect of
Profitability, Liquidity, and Solvency on Financial
Distress in the Agricultural Sector Listed on the
IDX."
2 THEORY AND DEVELOPMENT
OF HYPOTHESES
2.1 Signaling Theory
Signal theory was first coined by Michael Spence
(1973), which is an action by company management
to signal investors about viewing the Company's
prospects. As a result, management must provide the
best decisions to improve the Company's welfare and
increase shareholder wealth. Knowing the
relationship between this research and signal theory
is shown through financial statement information
interpreted as a signal of good news or bad news so
that internal and external parties can appropriately use
it. Therefore, from the beginning, the Company's
business is asked to make financial statements
correctly.
The use of signaling theory is related to
profitability. High profitability will be a good news
signal indicating that the Company's financial
performance is good. Signal theory is associated with
the liquidity ratio, and a good news signal will appear
if the Company has high ability to pay its short-term
debt. The situation shows that the Company can
overcome its debt problems. Signaling theory is
concerned with solvency ratios. Solvency is used to
determine the extent to which the Company can pay
all its debts. The higher the company’s debt indicates
the possibility of the Company having difficulty
paying debts, the lower the solvency will be a signal
of good news.
2.2 Agency Theory
This agency theory arises because of the occurrence
of a contract between the principal and the agent to
manage the company and delegate authority to the
agent in making decisions. The principal delegates
responsibility for the Company's decision-making to
the agent so that the agent is given the mandate to
carry out tasks based on the contract agreement
between the two parties that is carried out properly.
In this case, the principal is the shareholder, while the
management is the agent.
Ownership of information held by managers can
trigger activities according to management's will and
The Effect of Liquidity, Profitability, and Solvency to the Financial Distress in Agricultural Sector Companies Listed on the Indonesia Stock
Exchange (IDX)
99

personal interests, so it is difficult for capital owners
to effectively monitor the activities carried out by
management because of the limited information they
have. There is an opportunity for the agent to
maximize personal welfare contrary to the principal's
interests by limiting the information provided about
the Company to the principal (Jansen & Meckling,
1976). The difference in the ownership of information
held between the two parties causes information
misalignment or information asymmetry.
Stakeholders must be aware of declining or
unfavorable financial performance conditions. This is
related to the potential for financial distress in the
Company.
2.3 Financial Ratio
The liquidity ratio is to show that the company can
pay its short-term debt. The Company will be said to
be liquid if the Company can fulfill its obligations,
whereas if the Company is not liquid or can be said to
be illiquid because the Company is unable to meet its
obligations. This study uses the current ratio and
working capital to total assets.
Profit is income minus expenses and losses during
the reporting period (Dewi & Wirajaya, 2013).
Profitability analysis is very important for creditors
and equity investors. It can be used for Interest and
principal payments for creditors and the determinants
of changes in the value of securities for equity
investors. Therefore, how these profits can maximize
shareholders is an essential task for the Company.
This study uses Return on Equity and Return on
Assets.
Solvency is often called the leverage ratio, means
the company can meet all of the company's financial
obligations (Yanti & Oktari, 2018). This Ratio also
describes the comparison between the assets owned
by the Company and the debts funded by creditors.
Thus, solvency is used to determine how capable a
company can be seen from the level of debt. This
research uses Debt to Total Asset Ratio, Debt to Total
Equity Ratio, and Time Interest Earned.
2.4 Financial Distress
An economic condition that experienced a decline
and crisis in a company before bankruptcy is called
financial distress. Financial distress starts from
difficulty paying the short-term debt as a mild factor
to bankruptcy, the most severe factor (Hanifah &
Purwanto, 2013). This condition also occurs when the
Company is unable or fails to fulfill its obligations
(Hantono, 2019). Companies that will experience
financial distress are common
2.5 The Effect of Financial Ratios on
Financial Distress
2.5.1 The Effect of the Current Ratio on
Financial Distress
The Current Ratio is the simplest way of calculating
the liquidity ratio compared to other methods. This
calculation is intended to measure whether the
company can meet its short-term obligations with the
Company's current liquid assets or current assets.
The results of Rusli, Prihatni & Buchdadi's
research (2019) prove that current ratio affects on
financial distress significantly negative. This means
that the higher the Company's C.R., the lower the
probability that the Company will experience
financial distress because it can manage its current
assets to pay off debt. Short term. According to this
research, the researcher formulated the first
hypothesis as follows,
H01: Current Ratio has no significant effect on
financial distress.
Ha1: Current Ratio has a significant effect on
financial distress.
2.5.2 The Effect of Working Capital to Total
Assets on Financial Distress
Working Capital to Total Assets (WCTA) is a
measure of liquidity. This ratio shows the proportion
of net working capital to total assets. The larger the
WCTA will increase profits which in turn will affect
the increase in profit growth.
The results of Rusli, Prihatni & Buchdadi's
research (2019) prove that working capital to total
assets have a significant negative effect on financial
distress, which means that the higher the company's
WCTA, the lower the company encounters financial
distress. Based on this research, the researcher
formulated the second hypothesis as follows,
H02: Working capital to total assets has no significant
effect on financial distress.
Ha2: Working capital to total assets has a significant
effect on financial distress.
ICAESS 2021 - The International Conference on Applied Economics and Social Science
100

2.5.3 The Effect of ROE on Financial
Distress
ROE is to see how the company can gain net income
by using its capital. ROE calculation can be used as a
benchmark for the Company's financial performance.
The higher the ROE ratio, the higher the Company's
value; the higher the investment by investor.
The results of Rusli, Prihatni & Buchdadi's
research (2019) prove that ROE has a significant
negative effect on financial distress, which indicates
that the higher the Company's ROE, the lower the
probability that the Company will experience
financial distress. Based on this research, the
researcher formulated the third hypothesis as follows,
H03: ROE has no significant effect on financial
distress.
Ha3: ROE has a significant effect on financial
distress.
2.5.4 The Effect of ROA on Financial
Distress
Return on assets (ROA) is a profitability ratio that
measures the Company's efficiency in generating
income or profits from economic resources or assets
owned in its balance sheet. In simpler terms, ROA can
be defined as comparing net income after tax and total
assets owned by a company.
The results of Rusli, Prihatni & Buchdadi's
research (2019) prove that there is a significant
negative effect of ROA on financial distress. This
means that the higher the ROA, the lower the
probability that the Company will experience
financial distress. It indicates the more effective use
of assets, the greater the profit or profit earned. Will
be obtained by the Company. Based on this research,
the researcher formulated the fourth hypothesis as
follows,
H04: ROA has no significant effect on financial
distress.
Ha4: ROA has a significant effect on financial
distress.
2.5.5 The Effect of DAR on Financial
Distress
The debt to assets ratio is needed by the Company in
measuring the Company's financial health, especially
in bearing the debt it has. The debt to assets ratio uses
the Ratio of total debt to total assets owned.
Therefore, if the debt to asset ratio is high, the
company's risk in paying off its obligations.
The results of Rusli, Prihatni & Buchdadi's research
(2019) prove that DAR has a significant positive
effect on financial distress, which pictures that there
is relationship between DAR and financial distress. If
the Company's DAR is higher, then there will be
possibility the company experiencing financial
distress higher. Based on this research, the researcher
formulates the fifth hypothesis as follows,
H05: DAR has no significant effect on financial
distress.
Ha5: DAR has a significant effect on financial
distress.
2.5.6 The Effect of DER on Financial
Distress
Debt to Equity Ratio (debt to equity ratio), or what
can be abbreviated as DER, is the ratio of debt to
Equity. Debt to Equity Ratio (DER) is a financial
ratio that compares debt to Equity. Equity and the
amount of debt used for company operations must be
in a proportional amount.
The results of Rusli, Prihatni & Buchdadi's research
(2019) prove that DER has a significant positive
effect on financial distress, which it has relationship
between financial distress and DER. The higher the
DER, the higher the probability that the Company
will experience financial distress. Based on this
research, the researcher formulated the sixth
hypothesis as follows,
H06: DER has no significant effect on financial
distress.
Ha6: DER has a significant effect on financial
distress.
2.5.7 The Effect of times Interest Earned
Ratio on Financial Distress
The TIE ratio measures the amount of profit before
tax and interest is used to pay interest in the future.
Creditors will prefer companies with higher interest
coverage ratios because it means that the company
can pay its interest debt when it is due.
The results of Rusli, Prihatni & Buchdadi's research
(2019) prove that TIE has no significant adverse
effect on financial distress. Based on this research, the
researcher formulated the seventh hypothesis as
follows,
H07: TIE has a significant effect on financial distress.
Ha7: TIE has no significant effect on financial
distress.
The Effect of Liquidity, Profitability, and Solvency to the Financial Distress in Agricultural Sector Companies Listed on the Indonesia Stock
Exchange (IDX)
101
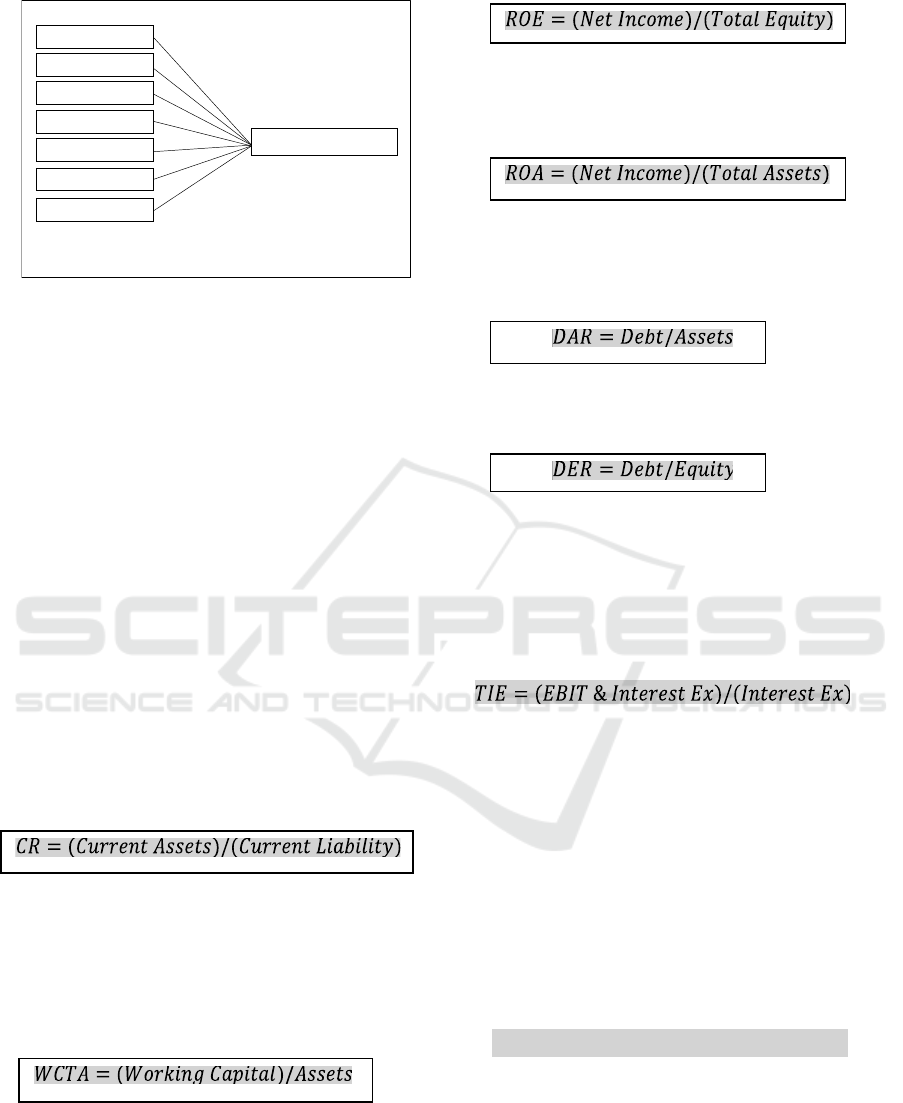
Figure 2: Research Model Framework
3 RESEARCH METHODS
This study is a quantitative study to provide evidence
of the effect of financial ratios on the Company's
financial distress. Secondary data on company annual
reports published on the Indonesia Stock Exchange
(IDX) for the 2015-2019 period through the website
www.IDX.co.id. The population used as the sample
of this study consisted of companies in the
agricultural sector.
3.1 Operational Definition
3.1.1 Dependent Variables
Current Ratio
This ratio is to know the Company's ability to pay off
short-term debts that are maturing.
Source: (Rusli, Prihatni, & Buchdadi, 2019)
Working Capital to Total Assets
Calculating the ratio is to compare working capital
with total assets or commonly referred to as ratios to
calculate the liquidity of the Company's assets
relative to total capital.
Source: (Rusli, Prihatni, & Buchdadi, 2019)
Return on Equity (ROE)
ROE is to measure net profit after tax with own
capital and the efficient use of own funds.
Source: (Rusli, Prihatni, & Buchdadi, 2019)
Return on Assets (ROA)
ROA calculates the yield of the assets used in the
company.
Source: (Rusli, Prihatni, & Buchdadi, 2019)
Debt to Asset Ratio
The ratio calculates the ratio between total debt to
total assets.
Source: (Rusli, Prihatni, & Buchdadi, 2019)
Debt to Equity Ratio
The ratio compares total liabilities with Equity.
Source: (Rusli, Prihatni, & Buchdadi, 2019)
Times Interest Earned Ratio
The ratio analyses the company's ability to pay
interest costs in the next period. This Ratio analyses
profit and interest before tax with interest expense
based on accounting principles.
Source: (Rusli, Prihatni, & Buchdadi, 2019)
3.1.2 Independent Variables
Financial distress
The declining stage of the company's financial that
takes place before the company goes bankrupt or
liquidates is called financial distress. According to
Altman, Altman Z-Score is a discriminant analysis to
predict financial distress (Y).
bankruptcy model:
Source: (Rusli, Prihatni, & Buchdadi, 2019)
Description:
X1: (Current Assets − Current Liabilities) / Total
Assets
X2: Retained Earnings / Total Assets
X3: Earnings Before Interest and Taxes / Total Assets
X4: Book Value of Equity / Total Liabilities Z-Score
H1: CR
H2: WCTA
H3: ROE
FINANCIAL DISTRESS
H4: ROA
H5: DAR
H6: DER
Variabel Dependen
H7: TIE
Variabel Independen
Z = 6,56 X1 + 3,26 X2 + 6,72 X3 + 1,05X4
ICAESS 2021 - The International Conference on Applied Economics and Social Science
102
Zones of discrimination:
Z > 2,6: safe zone
1,1 < Z < 2,6: grey zone
Z < 1,1: distress zone
3.2 Data Processing Techniques
Data processing in this study was carried out in
several steps: determining variables, summarizing,
calculating ratios, and processing data using the
eviews application. The analysis method in this study
uses descriptive statistics, classical assumption tests,
hypothesis testing, and panel data regression analysis.
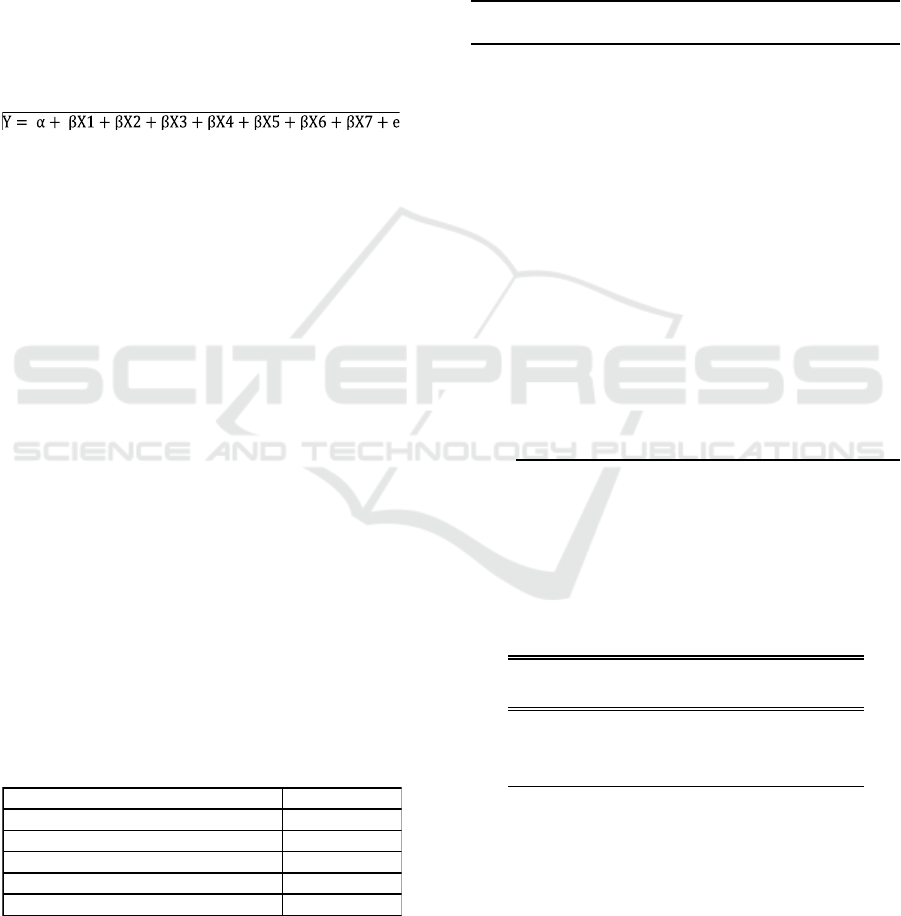
The regression model is:
Description:
Y = financial distress
α = Constant
βX1 = Current Ratio
βX2 = WCTA
βX3 = ROE
βX4 = ROA
βX5 = DAR
βX6 = DER
βX7 = TIE
4 RESULT AND DISCUSSIONS
4.1 Descriptive of Research Samples
The data population is companies that are in the
agricultural sector in Indonesia, which are registered
on the Indonesia Stock Exchange during 2015-2019.
The sample taken is the whole of the population
which among some of the data is not sampled due to
certain reasons. The total sample processed during the
2015-2019 period is 75 companies. The number of
samples for this study is shown in Table 1 as follows:
Table 2: Total Research Sample.
4.2 Descriptive Statistics
The description of statistical analysis data in this
research is presented in tabular form. It displays the
minimum, maximum, mean, and standard deviation
values of the research data. In addition, the results of
the descriptive statistical analysis of the study are
shown in table 3 below.
Table 3 Descriptive Statics
Mean Maximum Minimum
Std.
Deviation
Y
2.376
762
14.915980 -17.775440 5.057127
X1
1.566
533
6.770000 0.070000 1.605499
X2
0.019
938
0.720305 -1.285852 0.302073
X3
-
10.45
5470
25.490000 -350.30000 48.822300
X4
-
0.777
467
15.380000 -58.250000 11.216840
X5
0.531
333
1.650000 0.110000 0.251811
X6
0.830
267
11.270000 -30.640000 4.264892
X7
160.7
72800
6419.5300
00
-3.060000
778.15700
0
N 75
Source: Output Eviews 9 (2021)
4.3 Eviews Model Test Results
Chow Test
Table 4 Chow Test
Effects Test Statistic d.f. Prob.
Cross-section F 7.970037
(
14,53
)
0.0000
Cross-section
Chi-s
q
uare 84.983098 14 0.0000
Source: Output Eviews 9 (2021)
The probability of a chi-square cross-section in the
table above is 0.0000. This indicates that the
probability value of the chi-square cross-section <
0.05. Therefore, the results of the chow test indicate
that it is more appropriate to use the Fixed Effect
Criterion Number of companies
Agricultural companies registered during 2015-2019 24
Incomplete financial statements -7
Not using rupiah -1
Not submitting financial statements -1
(15 companies multiplied by 5 years) 75
The Effect of Liquidity, Profitability, and Solvency to the Financial Distress in Agricultural Sector Companies Listed on the Indonesia Stock
Exchange (IDX)
103
Model (FEM) than the Common Effect Model
(CEM).
Hausman Test
Table 5 Hausman Test
Test
Summar
y
Chi-Sq. Statistic Chi-Sq. d.f. Prob.
Cross-
section
rando
m
42.261398 7
0.000
0
Source: Output Eviews 9 (2021)
The magnitude of the random cross-section
probability value in the table above is 0.0000.
Hausman test results show that a significance of <
0.05. So that the selection of the right model is fixed
effect model (FEM) because the results of the chow
test and Hausman test both show that the right model
is FEM, so there is no need to do the next, namely the
langrage multiplier test.
4.4 Classic Assumption Test
Multicollinearity Test
Table 6 Multicollinearity Test
X1 X2 X3 X4 X5 X6 X7
X1
1.0000
00
0.7426
28
0.3104
87
0.4782
41
-
0.5719
35
0.0012
58
0.4617
80
X2
0.7426
28
1.0000
00
0.5716
97
0.6648
92
-
0.7503
36
0.2800
89
0.3106
25
X3
0.3104
87
0.5716
97
1.0000
00
0.5948
12
-
0.5178
63
0.7109
98
0.1055
22
X4
0.4782
41
0.6648
92
0.5948
12
1.0000
00
-
0.6223
86
0.1155
11
0.2346
45
X5
-
0.5719
35
-
0.7503
36
-
0.5178
63
-
0.6223
86
1.0000
00
-
0.1327
12
-
0.3023
72
X6
0.0012
58
0.2800
89
0.7109
98
0.1155
11
-
0.1327
12
1.0000
00
-
0.0307
02
X7
0.4617
80
0.3106
25
0.1055
22
0.2346
45
-
0.3023
72
-
0.0307
02
1.0000
00
Source: Output Eviews 9 (2021)
Based on the test results, all variables do not have
multicollinearity because they value < 0.8.
Heteroskedasticity Test
Table 7 Glejser Test
F-statistic
1.7792
82 Prob. F (7,67) 0.1060
Obs*R-
square
d
11.756
64
Prob. Chi-Square
(7) 0.1089
Scaled
explained SS
10.884
73
Prob. Chi-Square
(7) 0.1437
Source: Output Eviews 9 (2021)
According to the results that the value of *R-
squared is 11.75664 and the value of probability is
0.1089, which means > 0.05, it can be concluded that
the data does not experience heteroskedasticity
problems.
4.5 Hypothesis Test
Table 8 Fixed Effect Model (FEM)
Variable Coefficient Std. Erro
r
t-Statistic Prob.
C 6.465334 0.296775 21.78533 0.0000
X1 0.250005 0.061282 4.079582 0.0002
X2 4.176591 0.566570 7.371709 0.0000
X3 -0.005073 0.002249 -2.256105 0.0282
X4 0.059207 0.008623 6.866052 0.0000
X5 -8.663884 0.549610 -15.76371 0.0000
X6 0.033516 0.019957 1.679408 0.0990
X7 0.000032 0.000081 0.389715 0.6983
Source: Output Eviews 9 (2021)
Partial tests are to know the effect of independent
variables on dependent variables. The decision to
accept or reject a hypothesis is to look at its
probability value. The decision-making criterion is
that if the probability value is <0.05, the variable has
a significant effect. However, if the probability value
is>0.05, then the variable has no effect. The results of
the partial test can be seen in table 7 above. The
coefficient of determination is x` to determine the
percentage of independent variables together to
explain dependent variables. The results of the
coefficient of determination can be seen in Table 8
below as follows.
Table 9 Coefficient of Determination
Wei
g
hted Statistics
R-square
d
0.997339
Mean dependent
va
r
7.54746
0
Adjusted R-
square
d
0.996284 S.D. dependent va
r
10.9089
0
S.E. of re
g
ression0.559338 Sum s
q
uared resi
d
16.5815
0
ICAESS 2021 - The International Conference on Applied Economics and Social Science
104

F-statistic 945.7964
Durbin-Watson
stat
1.85313
9
Prob
(
F-statistic
)
0.000000
Unwei
g
hted Statistics
R-s
q
uare
d
0.987532
Mean dependen
t
va
r
2.37676
2
Sum square
d
reside 23.59616
Durbin-Watson
stat
1.44226
3
Source: Output Eviews 9 (2021)
Adjusted R-squared in table 8 shows a value of
0,996284. This number will be changed to percentage
form. This means that dependent variables in
financial distress are affected by independent
variables (C.R., WCTA, ROE, ROA, DAR, DER,
and TIE)of 99% (0.9962), and the remaining 1% is
explained by other factors outside the research model.
4.6 Data Analysis
Based on the hypothesis test results between
independent and dependent variables, the summary of
hypothesis test results can be seen in Table 9.
Table 10 Summary of Hypothesis Test Results
Hypothesis Conclusion
H1: C.R. significant effect on financial
distress
Accepted
H2: WCTA significant effect on
financial distress
Accepted
H3: ROE significant effect on
financial distress
Accepted
H4: ROA significant effect on
financial distress
H5: DAR significant effect on
financial distress
H6: DER has no significant effect on
financial distress
H7: TIE has no significant effect on
financial distress
Accepted
Accepted
Unaccepted
Accepted
Based on the summary of the results of the study
in table 4.10, it can be concluded that not all
hypotheses are supported. It is seen from the results
showing that partially Current Ratio (C.R.),
Working Capital to Total Assets (WCTA), Return
on Equity (ROE), and Return on Assets (ROA) and
Debt Asset Ratio (DAR) affect financial distress. At
the same time, Debt Equity Ratio (DER) and Time
Interest Earned (TIE) do not affect financial distress.
4.6.1 Current Ratio Affects Financial
Distress
H1 shows that C.R. affects on financial distress
positive significantly. This is evidenced by a
significance value of 0.0002, which means less than
the significance level of 0.05. The coefficient value is
0.250005, which means the Current Ratio (C.R.)
positively influences financial distress. These results
are in line with the results of research conducted by
Yuliatri (2018) and Yap, Munuswamy, & Mohamed
(2012), which explained that the Current Ratio (C.R.)
has a significant positive effect on financial distress.
A positive influence indicates that the higher the
current ratio value, the higher the value of z-score
financial distress.
Based on this, the more current assets owned by
the Company means that assets that can be used as
money are also more and more so that the Company
can meet its short-term obligations in time. So it will
provide information to management that the
Company is able to meet its short-term obligations,
which shows that the Company is in good health and
not in a depressed state. Different from the results of
research conducted by Zaki, Bah, & Rao (2011) and
Fitri & Zannati (2019), which explained that the
current Ratio does not affect financial distress.
4.6.2 Working Capital to Total Assets
Affects Financial Distress
H2 shows that WCTA affects on financial distress
significantly. This is evidenced by a significance
value of 0.0000, which means less than the
significance level of 0.05. The coefficient value is
4.176591, which means wcta has a positive influence
on financial distress. This result implies that the
higher the value of working capital to total assets, the
higher the value of z-score financial distress. Good
capital utilization will result in good working capital
value and can positively impact the Company's
performance in the next period. Paying attention to
working capital will allow the Company to use its
power source economically to minimize the danger of
the financial crisis. The results of this study are
reinforced by research conducted by Vinh (2015) and
Geng, Bose, & Chen (2014), which explained that
Working Capital to Total Assets (WCTA) has a
significant positive effect on financial distress.
Research by Mselmi, Lahiani, & Hamza (2017) did
not show the same results. The study explained that
Working Capital to Total Assets (WCTA) had no
significant effect on financial distress.
The Effect of Liquidity, Profitability, and Solvency to the Financial Distress in Agricultural Sector Companies Listed on the Indonesia Stock
Exchange (IDX)
105

4.6.3 Return on Equity Affects Financial
Distress
H3 shows that Return on Equity (ROE) has a
significant effect on financial distress. This is
evidenced by a significance value of 0.028, which
means smaller than the significance level of 0.05. The
coefficient value of -0.00507 means Return on Equity
(ROE) negatively influences financial distress. The
results of this study are in line with research
conducted by Rusli, Prihatni, & Buchdadi (2019) and
Vinh (2015), which states that Return on Equity
(ROE) negatively affects financial distress. This
negative influence indicates that the higher the return
on equity value, the lower the value of z-score
financial distress. This can be due to the low level of
the Company's ability to make a profit when viewed
from the overall average numbers in the last 5 years.
This research is not in line with the research results
owned by Mselmi, Lahiani, & Hamza (2017), which
is ROE has no effect on financial distress. Negative
corporate profitability indicates the lack of
effectiveness of the use of company assets to generate
net income. If the company's profitability actually
decreases and even amounts to negative, then the
possibility of the Company going bankrupt is greater.
On the other hand, if the value of a company's ROE
is high, it can be better, and its performance makes
profits. In other terms, ROE can show how much
profit is earned by the Company. But if the higher the
profit obtained allows the existence of funds that are
not used as needed, if this cannot be observed, the
possibility of the Company can experience
bankruptcy before experiencing financial difficulties.
4.6.4 Return on Assets Has an Effect on
Financial Distress
H4 shows that Return on Assets (ROA) has a
significant effect on financial distress. This is
evidenced by a significance value of 0.0000, which
means less than the significance level of 0.05. The
coefficient value is 0.059207, which means Return on
Assets (ROA) positively influences financial
distress. The results of this study are the similar with
research that was conducted by Hanifa (2019) and
Afiqoh & Laila (2018), which states that Return on
Assets (ROA) positively affects financial distress.
This result explains that the amount of net income can
generate each rupiah of the fund embedded in the total
assets, or vice versa. So if the higher the value of
return on assets (ROA), financial distress conditions
are less likely. In contrast to the research results
owned by Yap, Munuswamy, Mohamed (2012) and
Hanifah & Purwanto (2013), which shows that ROA
has no impact on financial distress.
4.6.5 Debt to Assets Ratio Has an Effect on
Financial Distress
H5 shows that the Debt to Total Assets Ratio
(DAR)has a significant effect on financial distress.
This is evidenced by a significance value of 0.0000,
which means less than the significance level of 0.05.
The coefficient value of -8.66388 means the Debt to
Assets Ratio (DAR) negatively influences Financial
distress. The presence of this negative influence
indicates that the higher the value of debt to total
assets, the lower the value of z-score financial
distress. Companies with high DAR values will not
necessarily be spared from financial distress, and
companies with the lowest DAR values also do not
always experience financial distress. This can be
caused if many companies whose activities are
financed by debt will also be the possibility of
financial distress conditions due to the greater the
obligation of the Company to pay the debt. This study
is in line with the results analyzed by Yuliatri (2018)
and Mselmi, Lahiani, & Hamza (2017), who stated
that DAR negatively affects financial distress but,
this study is not in line with the results of Debora
(2018) and Yap, Munuswamy, & Mohamed (2012).
They said that DAR has no effect on financial
distress.
4.6.6 Debt to Equity Ratio Has an Effect on
Financial Distress
H6 shows that the Debt to Total Equity Ratio (DER)
has no significant effect on financial distress. This is
evidenced by a significance value of 0.099, which
means greater than the significance level of 0.05, then
DER cannot predict the condition of financial distress
in agricultural sector companies. The coefficient
value is 0.033516, which means the debt to equity
ratio (DER) positively influences financial distress.
The amount of debt greater than the amount of all net
capital can result in the Company's burden on large
outsiders as well, which will adversely affect the
financial health condition of the Company. In
addition, the amount of debt burden can reduce the
amount of net income the Company will receive,
which will ultimately reduce profits for shareholders.
This research is not in line with the results of research
conducted by Hanifa (2019) and Afiqoh & Laila
(2018), in which DER is able to predict financial
distress. The ideal DER is below 1, but if there are
companies with DER above 1, it can not be said the
Company is not good. This can happen if the
ICAESS 2021 - The International Conference on Applied Economics and Social Science
106

obligation is only short-term debt, business debt to
suppliers (vendors), or debts resulting from income
received in advance (down payment). It can be said
that the debt is relatively healthy. If it turns out that
long-term debt is greater than short-term debt, the
condition is less healthy. The Company will continue
to bear the obligation to pay principal and interest on
the loan until the debt is paid off. These conditions
will suppress profits earned by the Company or may
interfere with liquidity in the future.
4.6.7 Time Interest Earned Has No Effect on
Financial Distress
H7 shows that TIE has no significant effect on
financial distress. This is evidenced by a significance
value of 0.6983, which means greater than the
significance level of 0.05. The coefficient value is
0.000032, which means TIE positively influences
Financial distress. TIE is not the main factor affecting
financial distress in agricultural sector companies
because it has no significant effect. Creditors will
prefer companies with a higher Times Interest Earned
Ratio because it shows the Company can afford to pay
its interest expense at maturity. Companies that have
a high Times Interest Earned Ratio have lower credit
risk. According to the results of research conducted
by Rusli (2019), TIE has no significant negative
influence on financial distress.
5 CONCLUSIONS
In this research, the independent variables used are
financial ratios specified into liquidity (current ratio
and working capital to total assets), profitability
(return on equity and return on assets), and solvency
(debt asset ratio, debt-equity ratio, and time interest
earned). The dependent variable in this study is
financial distress. Then you can conclude as follows:
1. The Current Ratio (C.R.) has a significant effect
on financial distress and positive direction.
2. Working Capital to Total Assets (WCTA) has a
significant effect on financial distress and
positive direction.
3. Return on Equity (ROE) has a significant effect
on financial distress and negative direction.
4. Return on Assets (ROA)has a significant effect
on financial distress and positive direction.
5. Debt Asset Ratio (DAR) has a significant effect
on financial distress and negative direction.
6. Debt Equity Ratio (DER) has no significant
effect on financial distress and positive direction.
7. Time Interest Earned (TIE) has no significant
effect on financial distress and positive direction.
Some limitations in this research need to be put
forward that are useful for developing similar
research in the future. There are several limitations,
namely: This research is limited to companies in the
agricultural sector listed on the IDX, so it has not
represented all companies listed on the IDX, the
period of this study was only conducted for five years,
namely 2015-2019 so that results cannot be
generalized for previous years or after and this study
only tested a few variables namely liquidity ratio,
profitability ratio, and solvency ratio.
Based on the limitations that have been outlined,
the suggestions for future research are: (1) Further
research is expected to expand the research sample;
(2) Expand longer timescales to illustrate the
comparison of financial performance better and better
illustrate the effect of liquidity and solvency on
profitability; (3) Further research is expected to add
other independent variables that are likely to affect
the Company's financial distress.
REFERENCES
Moore, R., Lopes, J., 1999. Paper templates. In
TEMPLATE’06, 1st International Conference on
Template Production. SCITEPRESS.
Smith, J., 1998. The book, The publishing company.
London, 2
nd
edition.
Afiqoh, L., & Laila, N. (2018). Effect of Financial
Performance on The Risk of Bankruptcy of Islamic
Commercial Banks in Indonesia (Altman Z-Score
Modification Method). Journal of Islamic Economics
and Business, Vol. 4, No. 2.
Altman, E. L. (2000). Predicting Financial Distress Of
Companies: Revisiting The Z-Score And Zeta®.
Journal of Banking & Finance.
Central Bureau of Statistics. (2020). Indonesia National
Income 2015-2019. Jakarta: Central Bureau of
Statistics.
CENTRAL BUREAU OF STATISTICS. (2021, January).
Https://www.bps.go.id. Retrieved from
https://www.bps.go.id/publication/download.html?
Basuki, A. T., & Nano, P. (2016). Regression Analysis in
Economic &Business Research. Jakarta: Rajawali Pers.
INDONESIA STOCK EXCHANGE. (2020). Retrieved
from www.IDX.co.id
Deborah, L. I. (2018). The Effect of Good Corporate
Governance & Ratio of Corporate Finance to Financial
Distress.
Dewi, A. S., & Wirajaya, A. (2013). The Effect of Capital
Structure, Profitability, and Company Size on
Company Value. E-Journal of Accounting Udayana
University 4.2,358-372.
The Effect of Liquidity, Profitability, and Solvency to the Financial Distress in Agricultural Sector Companies Listed on the Indonesia Stock
Exchange (IDX)
107

Fauziah, E. S., & Khoerulloh, A. K. (2020). The Effect of
Exports and Imports on Economic Growth with
Exchange Rates as An Intervening Variable. Social
Treasures, Vol. 2,15-24.
Fitri, N., & Zannati, R. (2019). Altman Z-Score Model on
Financial Performance on The Indonesia Stock
Exchange Through Logistic Regression Approach.
ACCURACY: Journal of Accounting and Financial
Research,63 - 72.
Gang, R., Bose, I., & Chen, X. (2014). Prediction of
Financial Distress: An Empirical Study of Listed
Chinese Companies Using Data Mining. European
Journal of Operational Research.
Ghozali, I. (2016). Multivariate Analysis Application With
IBM SPSS 23 Program (8th Edition). Semarang:
Diponegoro University Issuing Board.
Greenpeace Indonesia. (2020). Greenpeace.org. Retrieved
from https://www.greenpeace.org/
Hanifa, R. U. (2019). Effect of Liquidity, Profitability,
Leverage, and Activity on Corporate Financial Distress.
Hanifah, O. E., & Purwanto, A. (2013). The Effect of
Corporate Governance Structure and Financial
Indicators on Financial Distress Conditions.
Diponegoro Journal of Accounting, 1.
Hantono. (2019). Predicting Financial Distress Using the
Altman Score Model, Grover Score, Zmijewski Score
(Case Study On Sub-Sectors of Large Trading
Companies). Jem Site Mikroskil.
Jansen, M.C., & Meckling, W. H. (1976). Theory of the
Firm: Managerial Behavior, Agency Cost, and
Ownership Structure. Journal of Financial and
Economics, 3(4), 305-360.
Cashmere. (2012). Analysis of Financial Statements 5th
edition. Jakarta: PT Raja Grafindo Persada.
MINISTRY OF AGRICULTURE OF THE REPUBLIC
OF INDONESIA. (2015-2019). Financial Statements.
Jakarta: Ministry of Agriculture of the Republic of
Indonesia.
MINISTRY OF AGRICULTURE OF THE REPUBLIC
OF INDONESIA. (2020). Retrieved from
https://www.pertanian.go.id/.
Khaliq, A. (2014). Identifying Financial Distress Firms: A
Case Study of Malaysia's Government Linked
Companies. International Journal of Economics,
Finance, and Management.
Mselmi, N., Lahiani, A., & Hamza, T. (2017). Financial
distress prediction: The case of French small and
medium-sized firms. International Review of Financial
Analysis,67-80.
Princess, N. K., & Merkusiwati, N. L. (2014). The Effect of
Corporate Governance Mechanism, Liquidity,
Leverage, and Corporate Size on Financial Distress. E-
Journal of Accounting Udayana University 7.1.
Rusli, M., Prihatni, R., & Buchdadi, A. D. (2019). The
Effect Of Liquidity, Profitability, And Solvability To
The Financial Distress Of Manucatured Companies
Listed On The Indonesia Stock Exchange (Idx) Period
Of the Year 2015-2017. Academy of Accounting and
Financial Studies Journal.
Spence, M. (1973). Job Market Signaling. Quarterly
Journal of Economics,355-374.
Vinh, V. X. (2015). Using Accounting Ratios in Predicting
Financial Distress: An Empirical Investigation in the
Vietnam Stock Market. Journal of Economics and
Development, Vol.17, No.1, 41-49.
Widarjono, A. (2009). Econometrics: Theory and
Application for Economics and Business. Yogyakarta:
Ekonisia.
Yanti, L. D., & Oktari, Y. (2018). Effect of Profitability
Rate, Solvability, Company Size and Size of Public
Accounting Firm On Inspection Delay (Empirical
Study: Manufacturing Companies Registered in IDX
2013-2016). Eco-Buss.
Yep, B.C., Munuswamy, D. S., & Mohamed, D. Z. (2012).
Evaluating Company Failure in Malaysia Using
Financial Ratios and Logistic Regression. Asian
Journal of Finance & Accounting.
Yuliatri, P. (2018). Effect of Liquidity, Solvency, Activity,
and Cash Flow on the Company's Health.
Zakaria, M. (2020). The Effect of the Fed's Interest Rate on
Exchange Rates.
Zaki, E., Bah, R., & Rao, A. (2011). Assessing probabilities
of financial distress of banks in UAE. International
Journal of Managerial Finance, 304-320.
ICAESS 2021 - The International Conference on Applied Economics and Social Science
108
