Human Development Index in Indonesia: Are We in Line with SDGs
and How Much Have We Grown?
Tery Setiawan
a
, Indah S. R. Kuntari
b
and Indah Puspitasari
c
Department of Psyhology, Maranatha Christian University, Prof. Drg. Surya Sumantri 65, Bandung, Indonesia
Keywords: Human Development, Indonesia, Well-Being, Sustainable Development Goals, Latent Growth.
Abstract: Human development index encapsulates the attainment of health, education, and living standards of one nation.
We posit that the progress towards the 2030 sustainable development goals is vital in ensuring positive
achievement in HDI, especially in a developing country such as Indonesia. In this study, we aim to investigate
the relation between the current fulfilment of the 2030 agenda and HDI in Indonesia and examine the growth
Indonesia has made in 2016 thru 2020. By using national data gathered by Statistics Indonesia, we carefully
selected relevant indicators of the 2030 agenda to run regression model on HDI. Additionally, we employed
latent growth modelling to show the growth of HDI in Indonesia. Controlling for provincial minimum wage,
our regression analyses show that partnership for the goals, represented by the percentage of individuals using
internet, is the strongest predictor for positive attainment of HDI. Further, there is a small positive increment
of HDI annually within each province as well as between provinces. On average, the growth model
demonstrates a significant difference in measurement years between provinces, with year 2020 being the peak
among other years. These novel findings shed light on Indonesia’s human development, which echoes the
progress of national development.
1 INTRODUCTION
Human development index (HDI) was put forth in the
human development report in 1990 and since then
marked the shift in perspective of human
development; involving not only economic terms but
also health and education (Conceição, 2019). In brief,
HDI is a composite index composed of life
expectancy at birth, educational attainment (via
expected years of schooling and the mean years of
schooling), and gross national income (GNI) per
person (in US dollar) at purchasing-power parity
(Lind, 2019). Based on these four country-specific
statistics, HDI then classifies a country into three
ranks of development: developed, still developing,
and under developed (Hou, Walsh, & Zhang, 2015).
Although development rank is not the solely primary
objective of HDI, this rank is useful to indicate the
progress of national development of a country and
allows for cross-country comparison.
a
https://orcid.org/0000-0003-1813-9097
b
https://orcid.org/0000-0001-9658-0852
c
https://orcid.org/0000-0001-5505-5269
HDI treats humans as the source of development
of a country. The United Nations Development
Programme (UNDP) expressed a clear view on this,
“People are the real wealth of a nation” (UNDP, 1990,
p. 9). Further, HDI was much needed amid a
country’s financial growth. According to UNDP, a
nation’s development, should create a conducive
environment for its citizens to flourish and enjoy
“long, healthy, and creative lives” (p. 9). By
providing such environment, people are expected to
live with dignity, lead a productive work life, and
maintain a positive well-being. It is important to note,
however, that HDI is a simplified measure of human
development and limited to only objective well-
being, such as income and health. Other dimensions
which explain individuals’ well-being such as social
connections are not as straightforward because of its
subjectivity. Although both categories are necessary
to provide the overall quality of individual’s life, this
article specifically is focused only on the objective
470
Setiawan, T., Kuntari, I. and Puspitasari, I.
Human Development Index in Indonesia: Are We in Line with SDGs and How Much Have We Grown?.
DOI: 10.5220/0010754500003112
In Proceedings of the 1st International Conference on Emerging Issues in Humanity Studies and Social Sciences (ICE-HUMS 2021), pages 470-480
ISBN: 978-989-758-604-0
Copyright
c
2022 by SCITEPRESS – Science and Technology Publications, Lda. All rights reserved

dimensions of well-being captured through the HDI
measure.
One of the main weaknesses in HDI revolves
around its statistical calculations. First, the
combination of expected years of schooling and mean
years of schooling makes it difficult to analyse the
individual impact on HDI (Herrero, Martínez, &
Villar, 2012). Second, employing geometric mean
poses a two-fold risk in the interpretation. On the one
hand, geometric mean normalizes values given in the
dataset. Thus, it is difficult to justify a country’s
educational attainment when such index is obtained
through the combination of two variables. On the
other hand, geometric mean clears out the scaling
issue. But it is heavily affected by the choice of
minima for each HDI dimension (Klugman,
Rodríguez, & Choi, 2011). If any of the dimension
falls at the minimum bound, the whole index then
approaches to zero bringing down the other
dimensions. Third, from its birth HDI undermines the
importance of ecological domain (Biggeri & Mauro,
2018). During the current pandemic times that we live
in, this issue has become more apparent and urgent
than ever before. Even in the 2020 human
development report, UNDP argues that human
development should also address the assurance to
protect the planet to ensure sustainable development
for future generations (UNDP, 2020).
In detail, in 2015 all members of the United
Nations (UN) have agreed to pursue 17 sustainable
development goals (SDGs) to end poverty, protect the
planet, and enable people live with peace and
prosperity by 2030 (Conceição, 2019; UNDP, n.d.).
The goals include eliminating poverty in all forms,
providing good health and well-being, and ensuring
gender equality. These SDGs are directly (and
indirectly) related to human development,
represented by HDI. Although the relation seems
obvious (see Conceição, 2019), there is still lack of
evidence to support a consistent relationship between
SDGs and HDI. Indonesia provides such interesting
case.
The fourth largest country in population is ranked
high in human development index (UNDP, 2020).
However, Indonesia is still struggling with many
societal as well as ecological issues. In terms of civil
and political rights, Indonesia is ranked at 64 globally
and thus, considered a nation with flawed democracy
(Prasetia, 2021). In terms of health, (World Health
Organization, 2017) reports there is still high
inequality in health access in the country. Moreover,
in terms of ecology, Indonesia is the world’s largest
concentration of seagrass (UNDP, 2020). However,
most of their seagrass is unhealthy. In addition, there
are numerous SDGs’ indicators that are indirectly
related to the HDI but might play a big role in
enhancing HDI. For instance, given the importance of
internet in financial and education sectors, having
access to the internet may predict a higher level of
HDI than not having it (Setiawan & Suhartomo,
2019). In addition, although there exist many reports
of HDI in Indonesia from time to time, there is none
that offers growth prediction. Even though having
such information gives an overview of the nation’s
human development over the years. Moreover, the
knowledge provides a vital insight for policy makers
and scholars in proposing the direction of the
country’s development. All this echoes the necessity
to carefully look at the relation between the
achievement of SDGs and the HDI level of a nation,
in this case Indonesia.
In addition, currently a large number of research
focused solely on improving the assessment of SDGs
and the HDI measure (Klugman et al., 2011;
Nguefack-Tsague et al., 2011), whereas few to none
studies the empirical link between the two concepts.
Even though the theoretical link between some of the
SDG’s indicators, e.g., built environment, and the
HDI, e.g., heath indicator, has been drawn by many
research, the investigation has not involved the real
index obtained from the SDG’s indicators
operationalization and the HDI measures. In this
study, we use the figures obtained from the SDGs and
the HDI assessments available by Statistics
Indonesia.
By using real figures, we aim for a two-fold goal.
One, providing evidence for the relation between
SDGs and the HDI level. Two, providing a better
estimate for the relation between decent living
environment and empowerment, on the one hand, and
objective well-being on the other. Living
environment has been shown by Dean and colleagues
(2018) to affect mental health of the residents. More
importantly, this investigation demonstrates that
studying the theoretical link of interest should never
address environment as only the physical form, and
instead should take into account all the necessary
components, such as food availability for the
residents, water and energy availability, and housing
options (Sayles et al., 2019). Further, empowerment
is equally important mainly because it indicates that
people have an option and the freedom to choose.
This knowledge gives valuable insight into the role of
empowerment in developing a sense of unity among
the people and later can turn into a collective action
to promote better welfare for everyone in the
community (Drury et al., 2015).
Human Development Index in Indonesia: Are We in Line with SDGs and How Much Have We Grown?
471

Taken together, we aim to investigate to what
extent the relevant SDGs indicators are related to the
HDI in Indonesia and to what extent the HDI in
Indonesia have progressed in the last five years
(2016-2020). As echoed earlier, providing a secure
and healthy place for individuals to grow allows
people to expand their capabilities (Conceição, 2019;
UNDP, 1990, 2020). Therefore, we expect that the
progress towards SDGs is related to the growth of
HDI. Moreover, with the achievement of SDGs in
Indonesia in the past five years, we also expect to see
an increment of the HDI within that period.
2 CONCEPTUAL FRAMEWORK
2.1 Human Development
Human development is an effort to expand
opportunities of the population to achieve a decent
life (UNDP, 1990). At the practical level, increasing
the basic capacity involves increasing the
productivity of the population through enhancing
knowledge, a decent standard of living and a decent
health so that they can live a healthy long life. In
detail, human development should be based on the
following basic premises: (1) human as the centre of
growth, (2) human development is intended to
enlarge the options available to citizens, not only to
increase their income, (3) human development is
intended to improve human capabilities, (4) human
development involves productivity, equity,
sustainability and empowerment, and (5) human
development is the basis to determine development
goals and ways to achieve them.
Based on the premises, we can conclude that
human development is about people’s quality of life.
Indeed, human development has now progressed
from solely economic indicators to people’s well-
being indicators, in which economic is one of them
(Stiglitz, Sen, & Fitoussi, 2009). The notion of well-
being encompasses a wide array of human
necessities. Several studies show the importance of
well-being in various life domains, such as health
(Marcinko, 2015; Steptoe, Deaton, & Stone, 2015),
education (Chen, 2011), and society (MacIlvaine,
Nelson, Stewart, & Stewart, 2013). Over time, the
measurement of well-being evolved with the
inclusion of psychological indicators. Individual's
subjective perception of their well-being is an
important indicator of the quality of human life.
Thus, the notion of well-being should be treated
as multi-dimension concept. Standing on the shoulder
of previous scholars, well-being should, at least,
include economic living standards (i.e., income,
consumption), health, education, personal activities
(e.g., work, leisure activities), political participation,
social life and interpersonal relationships, living
environment, and insecurity (e.g., economically,
physically, or psychologically). Dimensions such as
living standards, health, and education can be
objectively captured through the notion of human
development proposed by the UNDP (1990). It is
important to reiterate that this study relies on the HDI
measure to capture individual’s well-being and
therefore, only accounts for the objective nature of
well-being.
2.2 The Relation between SDGs and
HDI in Indonesia
HDI is put forth as a composite single-number
indicator that captures the basic dimensions involved
in human development, which are health, education,
and income (Conceição, 2019). Meanwhile, all UN
member countries, including Indonesia, have agreed
to set up goals or development targets to pave the way
for a positive human development. These
development targets are summarized in 17 SDGs with
169 targets and 232 indicators. The goals are ending
poverty, having zero hunger, ensuring good health
and well-being for the population, providing quality
education, ensuring gender equality, providing clean
water and sanitation, affordable and clean energy,
decent work and economic growth, industry,
innovation, and infrastructure, reduced inequalities,
sustainable cities and communities, supporting
responsible consumption and production, climate
action, life below water, life on land, and finally
peace, justice and strong institutions (UNDP, n.d.).
SDGs officially replaced the Millennium
Development Goal's (MDG's) concept which ended
in 2015.
As a follow-up action by Indonesia, in 2017, the
government passed the Presidential Regulation
(Perpres: Peraturan Presiden) No. 59 of 2017 with
the tagline "no one left behind". If the goals can be
carried out comprehensively, it is believed that there
will be a positive change in individuals’ well-being as
well as their behaviours in caring the environment.
Thus, the progress towards the fulfilment of SDGs
can ensure the improvement of HDI (Haryanto,
2018).
Efforts to achieve the SDGs target are a priority
for Indonesia's national development, requiring
synergy of planning policies at the national level and
at the provincial and district/city levels. Several
SDGs indicators worth mentioning to support HDI
ICE-HUMS 2021 - International Conference on Emerging Issues in Humanity Studies and Social Sciences
472

include an increase in minimum consumption below
1,400 kcal/capita/day, increase in number of
individuals having a birth certificate, and decrease in
unmet need for health services. Due to these
improvements, a person is expected to be in good
health and thus, can survive longer. If they are sick,
they can easily make arrangements with the health
service provider to speed up their recovery. Further,
having a birth certificate is the first step towards a
decent living in Indonesia (Badan Pusat Statistik,
2021a). With the certificate, individuals can be
registered officially to obtain social security (known
as BPJS), to be registered in the tax department,
school, to work in the formal sector, to buy property
or land, to be eligible for voting, and to be able to
obtain a passport. Thus, ensuring the achievement of
SDGs can help improve the rank of HDI of Indonesia.
Most importantly, achieving SDGs means allowing
Indonesian citizens to lead a productive and healthy
life in a sustainable environment, both ecologically as
well as institutionally.
Given numerous indicators of SDGs, we carefully
select relevant indicators to be included in the study.
Two main criteria for selection are the immediate
impact on the people’s welfare and the availability of
the latest data provided by the Statistics Indonesia
(Badan Pusat Statistik). The following SDGs
indicators are involved in the study: the calory intake
below 1400 kcal/day (zero hunger SDG), unmet need
for health services (good health and well-being),
knowledge and understanding about modern
contraception (gender equality SDG), level of
unemployment (decent work and economic growth
SDG), access to decent and affordable housing
(sustainable cities and communities SDG), having a
birth certificate (peace, justice and strong institutions
SDG), democracy index (peace, justice and strong
institutions SDG), and access to the internet
(partnership for the goals SDG).
Based on the aforementioned above, we
hypothesize that (H1) calory intake below 1400
kcal/day, (H2) unmet need for health services and
(H4) unemployment level are expected to be
negatively related to the HDI. Whereas (H3) the
knowledge and understanding about modern
contraception, (H5) access to decent and affordable
housing, (H6) having a birth certificate, (H7)
democracy index, and (H8) access to internet are
positively related to the growth of HDI. Furthermore,
with the current achievement of SDGs we expect to
see a yearly positive growth of HDI from the period
of 2016 to 2020 (H9).
3 METHOD
This study used secondary data provided by Statistics
Indonesia. The data was laid out according to
province, enabling us to do cross-province
comparison in later analysis. In specific, we obtained
the HDI numbers from the Statistical Yearbook of
Indonesia from 2016 thru 2020. For the SDGs
indicators, since the latest record of the achievement
of SDGs in 2020 has yet been published, we obtained
the latest SDGs indicators numbers from the official
site of Statistics Indonesia. The quality data were
gathered through reliable surveys, such as National
Labor Force Survey (Sakernas: Survei Angkatan
Kerja Nasional) and National Socioeconomic Survey
(Susenas: Survey Sosial Ekonomi Nasional). The
followings are measures used in this study:
3.1 Dependent Variable
HDI is a composite measure consisted of three
dimensions, which are (1) life expectancy at birth for
assessment, (2) the education uses number of years of
schooling for adults aged 25 years and above and the
expected number of years of schooling for children of
school-entering age, and (3) the standard of living by
gross national income per capita (Klugman et al.,
2011). Each dimension is assigned equal weighting
and normalized to attain a range from zero to one. The
HDI is then obtained by calculating a geometric mean
of all three dimensions.
3.2 Independent Variables
There are eight SDGs indicators that were treated as
independent variables and the following descriptions
were taken from the 2019 report of SDGs progress by
the Statistics Indonesia (Badan Pusat Statistik, 2019).
Calory intake below 1,400 kcal/day is a
straightforward measure capturing the proportion of
individuals with calory intake of individuals
minimum below 1,400 kcal/day. This number is set
as a minimum suggested for each individual that is
adjusted to their age range (Badan Pusat Statistik,
2019).
Unmet need for health services is the percentage
of individuals who suffer from health complaints but
do not seek outpatient treatment (Badan Pusat
Statistik, 2021d). In order to get the percentage, BPS
compares the number of people who experience
health complaints and their activities that are
disturbed but do not seek outpatient treatment to the
number of the outpatient treatment. The activities that
are disturbed can involve work, school or other daily
Human Development Index in Indonesia: Are We in Line with SDGs and How Much Have We Grown?
473
activities. Reasons why people do not seek outpatient
treatment can vary from having no medical saving to
having no means of transportation. This data was
gathered by the Statistics Indonesia itself.
Knowledge and understanding about modern
contraception measure the percentage of knowledge
and understanding of couples of childbearing age
about modern contraception, such as birth-control pill
(Badan Pusat Statistik, 2019). This data was provided
by Indonesian Demographic and Health Survey
(Survei Demografi dan Kesehatan Indonesia).
Level of unemployment measures the percentage
of the total unemployed to the total labour force. BPS
(Badan Pusat Statistik, 2021c) extended the concept
of unemployment to accommodate the revision of the
term proposed by the international labour
organization (ILO). Currently, unemployment term
covers those who are looking for work, those who are
starting up a new business/firm/establishment, those
who are not looking for work due to the discouraging
presumption, and those who are not looking for work
because having already secured a job but yet to start
(future starter). The data was gathered by Sakernas.
Access to decent and affordable housing measures
the percentage of households with access to decent
and affordable housing. According to BPS (Badan
Pusat Statistik, 2021b), a decent housing is the one
that meets the following criteria: 1) sufficient area of
at least 7.2 m2 per capita 2) available access to proper
drinking water, 3) available access to proper
sanitation, and 4) durable housing.
Having a birth certificate refers to the percentage
of individuals aged 0-17 with a birth certificate. This
birth certificate should be issued by the Civil Registry
in each region, and not the one from a hospital or
doctor (Badan Pusat Statistik, 2021a). This document
holds high importance in ensuring the recognition of
a child lawfully and thus, protecting their rights. On
the contrary, children without an official birth
certificate will face difficulties in accessing health
and education services.
Democracy index measures the index of free and
fair elections, the role of Regional People's
Representative Assembly, the role of the political
parties, local government bureaucracy, and
independent judiciary (UNDP, 2010). It ranges from
0-100, with higher score indicating higher index.
Access to internet measures the proportion of
individuals using the internet. The use includes
accessing social media, such as facebook, twitter, and
whatsapp.
3.3 Control Variable
We employed province minimum income as a control
variable to ensure that any relation found was not
spurious due to the difference of province minimum
income.
3.4 Strategy for Analyses
First, we performed multilinear regression in a
stepwise fashion to test hypothesis 1 thru 8 on SPSS
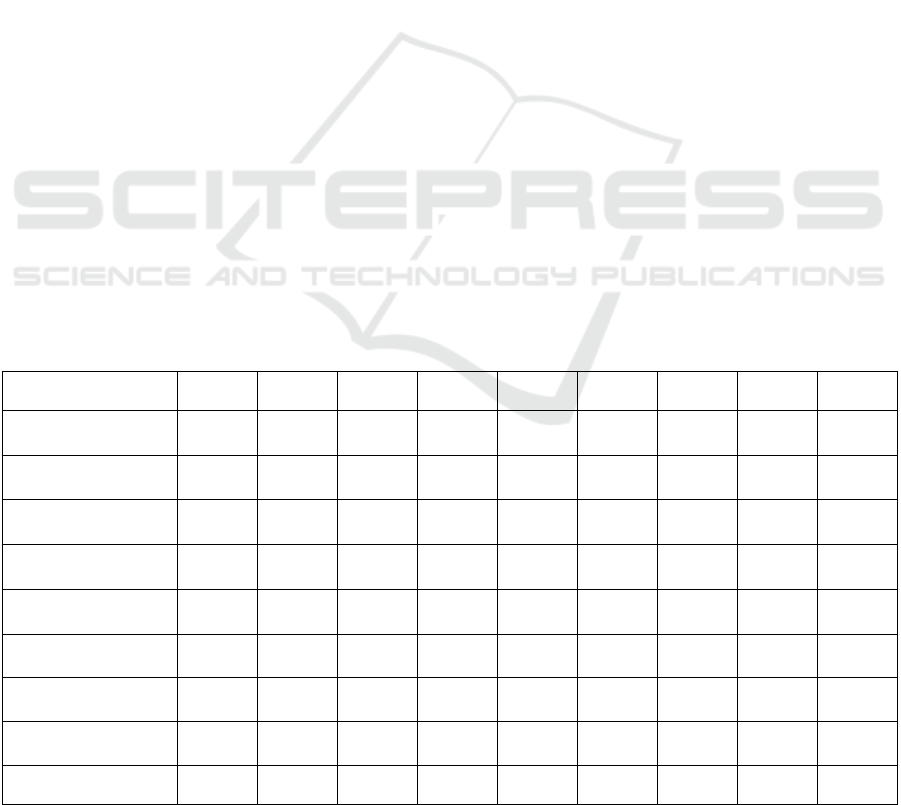
Table 1: Bivariate Correlations Between Variables.
Measure 1 2 3 4 5 6 7 8 9
1. HDI -
-.52
(.002)
-.29
(.094)
.59
(.000)
.48
(.004)
.38
(0.03)
.72
(.000)
.48
(.004)
.85
(.000)
2. Calory Intake - -
-.18
(.305)
-.56
(.000)
-.09
(.617)
-.22
(.221)
-.58
(.000)
-.43
(.011)
-.51
(.002)
3. Unmet need for
health services
- - -
.26
(.136)
-.37
(.030)
.08
(.631)
-.11
(.532)
.03
(.875)
-.30
(.080)
4. Modern
contraception
- - - -
.17
(.339)
.44
(.009)
.74
(.000)
.42
(.014)
.48
(.004)
5. Unemployment
level
- - - - -
-.10
(.572)
.11
(.520)
-.01
(.964)
.61
(.000)
6. Access to housing - - - - - -
.38
(.025)
-.01
(.953)
.21
(.225)
7. Birth certificate - - - - - - -
.49
(.004)
.62
(.000)
8. Democracy index - - - - - - - -
.44
(.009)
9. Access to internet - - - - - - - - -
Bold indicates significance at level p < .05.
ICE-HUMS 2021 - International Conference on Emerging Issues in Humanity Studies and Social Sciences
474
25. To do this, we took the latest HDI figures (year
2020) and test it on the latest SDGs indicators
numbers provided by Statistics Indonesia. Each
model is built upon each SDG indicator following the
order of SDGs according to UNDP, e.g., as we did not
include SDG 1, calory intake as SDG 2 became the
first indicator to be included in the model, unmet need
health services became the second and continued until
the last SDG (UNDP, n.d.). Prior to calculation, we
performed preliminary tests to ensure that all
predictors have linear relationship with the HDI and
that there is no multicollinearity between predictors.
We ran normality tests by calculating the residuals,
that is difference between the measured value and the
predicted value, for each predictor in the regression
model. The Shapiro-Wilk for normality test indicated
that access to housing, knowledge about modern
contraception, the level of unemployment, and unmet
needs for healthcare services deviate from normality.
However, their skewness and kurtosis values did not
exceed 2 and 7, respectively. Therefore, as suggested
by Kim (2013), we may still consider the data to be
acceptable. Next, we found that all predictors were
linearly related to the HDI. Further, all predictors had
variance inflation factor (VIF) values ranging from
1.58 to 4.26 with tolerance statistics above .2, which
indicated no multicollinearity (Field, 2009). The
correlation matrix in Table 1 also supports the
finding.
Looking closely at Table 1, we found that the HDI
level is correlated with all of the predictors, except
with the percentage of people with unmet needs for
healthcare services. The strongest correlation found
with the percentage of people having a birth
certificate. While, surprisingly, the lowest coefficient
was found between the HDI level and access to
housing and democracy index.
Second, we ran growth curve modelling using
SPSS 25 to test whether there is a positive growth of
HDI in Indonesia in the past five years, from 2016
thru 2020 (H9). In doing so, we started with a null
model using provinces to predict HDI over the five-
year period. Next, we set up a model using time as a
predictor for the fixed effect. By this, we allowed the
province’s intercepts to randomly vary but the slope
for the time is fixed. Subsequently, we set up a model
allowing time to vary at level 2. Here, we allowed the
province’s intercepts and the slope for the time to
randomly vary. By doing this we can identify
increment of HDI across provinces as well as across
years.
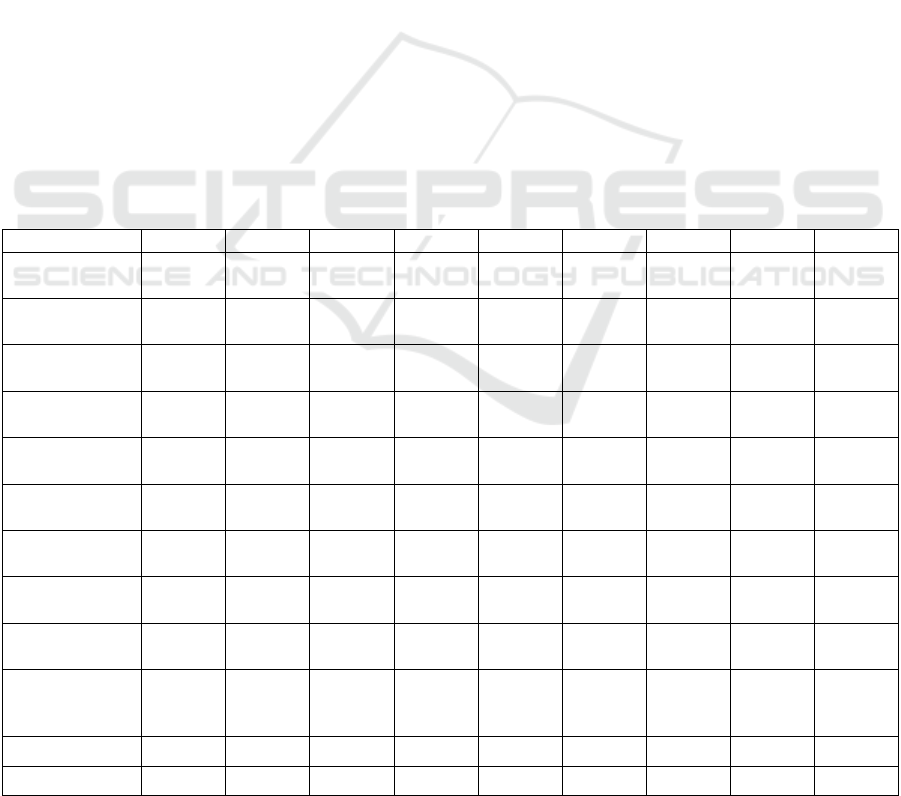
Table 2: Regression model of HDI on independent variables.
Model 1 Model 2 Model 3 Model 4 Model 5 Model 6 Model 7 Model 8 Model 9
Intercept
74.32
(.000)
79.85
(.000)
-10.15
(.657)
-3.71
(.867)
10.10
(.658)
46.50
(.085)
44.37
(.076)
38.51
(.091)
38.52
(.110)
Calory Intake
-31
(.002)
-.35
(.000)
-.17
(.040)
-.17
(.034)
-.18
(.025)
-.11
(.140)
-.08
(.251)
-.03
(.676)
-.03
(.682)
Unmet need for
health services
-.98
(.007)
-1.21
(.000)
-.95
(.004)
-.88
(.006)
-.44
(.202)
-.39
(.219)
-.31
(278)
-.31
(.301)
Modern
Contraception
.90
(.000)
.79
(.001)
.61
(.017)
.10
(.742)
-.00
(.987)
.10
(.699)
.10
(704)
Unemployment
Level
.45
(.064)
.55
(.026)
.70
(.004)
.78
(.001)
.32
(.245)
.31
(.256)
Access to
Housing
.06
(.088)
.06
(.083)
.08
(016)
.06
(.054)
.06
(.074)
Birth Certificate
.12
(.026)
.10
(.053)
.06
(.240)
.06
(.074)
Democracy
Index
.16
(.024)
.10
(.165)
.10
(.175)
Access to
Internet
.15
(.017)
.15
(020)
Province
Minimum
Income
.00
(.974)
F test 11.69 11.28 16.43 14.36 12.95 13.46 14.41 16.12 13.76
Adjusted R
2
.24 .38 .58 .62 .64 .69 .74 .79 .77
Note. Bold indicates significance at level p < .05.
Human Development Index in Indonesia: Are We in Line with SDGs and How Much Have We Grown?
475
4 RESULTS
In Table 2, we start with the proportion of individuals
with calory intake below 1400 kcal/day into account.
The results if Model 1 confirm hypothesis 1, in which
the proportion of individuals with 1400 kcal/day
calory intake is negatively related to the level of HDI
(b = -.31, p = .002). In Model 2, we also expected that
there would be a negative relation between the
percentage of individuals with unmet need for health
services and the HDI. The results supported
hypothesis 2 (b = -.98, p = .007). Next, we expected
that the knowledge and understanding of young
productive couples on modern contraception would
be positively related to the HDI. The results in Model
3 support hypothesis 3 confirming a positive relation
between variables of interest (b = .90, p = .000).
Further, Model 4 takes into account the level of
unemployment. Contrary the expectation, the results
disconfirm hypothesis 4 that there is no significant
relationship between the percentage of the total
unemployed to the total labour force and the HDI.
Model 4, however, still demonstrates significant
relationships between the previous indicators and the
HDI. This indicates that by keeping deficiency of
calory intake and unmet need at low level and with
the help of knowledge of the use of modern
contraception among young couples, human
development can progress in the right track even
though unemployment may seem competitive. Model
5 tests hypothesis 5 that is the percentage of
households with access to decent and affordable
housing would be positively related to the HDI. Here,
we find that there is no significant relationship
between the variables of interest. However, we find
that by including the variable of access to housing
makes the knowledge and understanding of the use of
modern contraception significant (b = .61, p = .017)
Next, Model 6 includes birth certificate to test
hypothesis 6. As expected, the percentage of
individuals aged 0-17 with a birth certificate is
positively related to the HDI (b = .12, p =.026).
Considering the importance of such document, this
shows that registration of a child’s birth paves the
way for a growth of human development.
Furthermore, Model 7 includes democracy index
to promote positive human development. The results
confirm hypothesis 7 that the higher the democracy
index the higher the level of HDI (b = .16, p = .024).
The inclusion of democracy index makes birth
certificate no longer plays a significant role in the
HDI progress. Subsequently, Model 8 considers the
proportion of individuals using the internet. We find
that there is a significant relation between using the
internet and the HDI (b =.15, p =.020). Interestingly,
the role of the internet use makes the other significant
relations in the previous model insignificant. The
results seem to be in line with the increasing
embeddedness of internet use in individual’s daily
life. Finally, we included province minimum wage in
Model 9 to test whether previously found relations
were spurious due to the inclusion of province
minimum wage. We found that there was no
significant relationship between province minimum
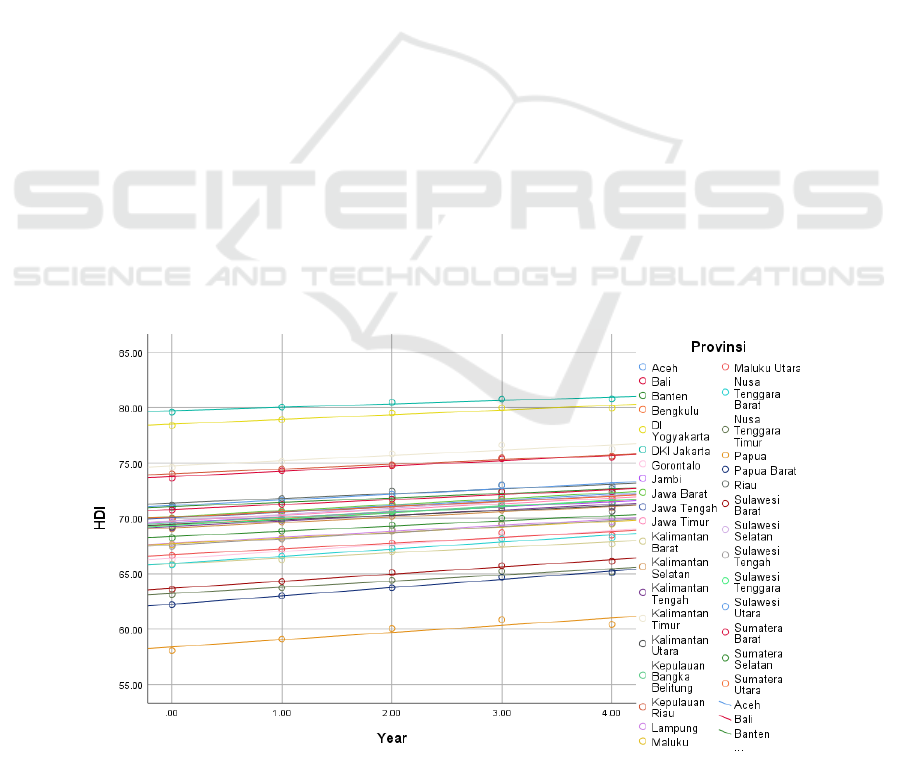
Note. .00 = 2016; 1.00 = 2017; 2.00 = 2018; 3.00 = 2019; 4.00 = 2020
Figure 1: Predicted growth of the HDI throughout 2016 to 2020.
ICE-HUMS 2021 - International Conference on Emerging Issues in Humanity Studies and Social Sciences
476
Table 3: Latent growth model of HDI from 2016-2020.
Model 0 Model 1 Model 2
Intercept 70.28 (.000) 69.26 (.000) 69.14 (.000)
Level 1 (fixed effect)
Year .51 (.000) .62 (.000)
Variance of the residuals (within province across time) .72 (.000) .06 (.000)
Level 2
Year 2016 .01 (.105)
Year 2017 .00 (.274)
Year 2018 .00 (.035)
Year 2019 .01 (.024)
Year 2020 .36 (.000)
Variance of the means (between provinces) 15.43 (.000) 15.56 (.000) 16.61 (.000)
Variance of the means (between years) .01 (.001)
Note. Bold indicates significance at level p < .05.
wage and the HDI and, moreover, the relations
found in Model 8 remained the same in Model
9.Furthermore, we conducted growth curve model to
test hypothesis 9 that there is increment of the HDI in
Indonesia from 2016 to 2020. Figure 1 plots the
growth of HDI over the five years. As expected, DKI
Jakarta province shows the highest growth of all
provinces while Papua is shown to have the lowest
growth.
In relation to the predicted growth across
provinces and years, we first start with Model 0 or
null model (see Table 3). Here, the grand mean of the
HDI is 70.28 (p = .000). We find that there is a
significant variance of the HDI within provinces
across time (b = .72, p = .000). In addition, there is
also a significant variance of the HDI between
provinces (b = 15.43, p = .000), which indicates a
possible random effect of provinces. Therefore, in
Model 1 we set time as a fixed-effect predictor and
allow the province’s intercepts to randomly vary. The
results show that, at level 1, time is positively related
to the HDI (b = .51, p = .000). Although reduced, the
variance of the HDI within province also remains
significant (b = .06, p = .000). Whereas the variance
of the HDI between provinces is slightly changed (b
= 15.56, p = .000). To further test the increment
during the five years, we set time as a level 2 random-
effect predictor. The results show that, at level 1,
time’s relation with the HDI is slightly increased (b =
.62, p = .000). At level 2, we find a low variance of
the HDI across years (b = .01, p = .001). Taken
together, these results show that there is a slight
significant growth of the HDI in the period of 2016 to
2020. However, the difference of the HDI between
provinces across time is still significantly substantial
(b = 16.61, p = .000).
5 DISCUSSION AND
CONCLUSION
The current study explores the progress of the HDI in
Indonesia by testing the relations between SDGs
indicators and the HDI in Indonesia and looking at the
growth of HDI from 2016 to 2020. Being ranked at a
high development country, Indonesia seems to be
struggling with its own societal and ecological
problems (see BPS, 2019; UNDP, 2020). Some of our
findings are consistent with the expectations, while
others provide alternative explanations.
First, we find that the fulfilment of minimum daily
calory intake is related to the growth of HDI in
Indonesia. This finding shows that by eliminating
hunger, one of which through minimizing the
percentage of individuals with calory intake below
1,400 kcal/day, helps individuals to have a healthy
life and support their education. The fulfilment of
calory intake does not stand alone in providing a
healthy life. Our finding also shows that by lowering
the number of people with unmet health services
Human Development Index in Indonesia: Are We in Line with SDGs and How Much Have We Grown?
477

strongly helps the increment of the HDI in Indonesia.
This is somewhat corroborates the report of the state
of health inequality in Indonesia (World Health
Organization, 2017). Due to health inequality that still
widely exists across the nation, the rank of HDI in
Indonesia will be most likely to increase only slightly
from year to year.
Similarly, the knowledge and understanding
among couples of childbearing ages about modern
contraception highly supports the growth of HDI.
This finding corroborates the notion that personal
autonomy, captured through gender equality,
provides options that expand people’s capabilities
(Stiglitz et al., 2009). In addition, having a birth
certificate and high democracy index also support
growth of the HDI. This shows that people’s well-
being is largely determined by access to vital
knowledge, sense of security in the community, and
more importantly, being able to choose freely
(UNDP, 1990).
In contrast, our finding shows that unemployment
level is not associated with the growth of HDI.
Furthermore, access to housing is also found not to be
a significant predictor to the HDI. These findings
contradict the notion that economic indicators,
through means of employment and housing, support
individuals’ well-being. However, given the
condition that other indicators, e.g., minimum daily
calory intake and healthcare service are met, this
finding validates the claim by Stiglitz et al. (2009)
that the measure of subjective well-being should also
be considered to accompany the objective well-being
captured in the current HDI.
Further, the number of people having access to the
internet is found to be associated with the HDI. Most
interestingly, the inclusion of this predictor weakens
all the other variables. Given the high importance of
internet in people’s daily lives, this finding suggests
that being able to access the internet empowers
people with knowledge necessary to improve their
health and socio-economic conditions. A program
such as e-health has been shown to promote
information exchange among health professionals,
even in the war zones (Eyesenbach, 2007). In
addition, internet enables people in less developed
areas to receive the same knowledge as others in more
developed areas. Thus, internet empowers people
with the same quality of education and skills needed
for higher education and labour opportunities
(Johnson, 2016). In sum, having access to
information and communications technology (ICT),
part of Goal 9, will significantly affect the choices
and opportunities available to people. Inexpensive
and reliable access to the internet enables other
capabilities in the areas of education, work, and
political participation, among others. However, it is
worth noting that the use of internet can also bring
detrimental impact on human development. It is
shown that higher internet use is related to higher
crime incidence in Indonesia (Setiawan &
Suhartomo, 2019).
Regarding the growth of HDI in Indonesia, we
find that there is a slight increment of the HDI from
2016 to 2020. A plausible explanation for this is due
to the apparent variance of the HDI across provinces.
Indonesia still experiences widespread unequal
development in many domains. Take internet for
instance, although internet has given positive impacts
on human development, the existence of internet
divide exacerbates the inequality in education and
human capital in rural and remote islands in Indonesia
(Sujarwoto & Tampubolon, 2016).
There are, at least, two limitations notable in this
study. One, due to the availability of data this study
cannot include subjective well-being measure.
Therefore, the current study solely relies on the HDI
measure, although we are aware that human
development cannot be captured by only four
measures and simplified into one index measure.
Two, SDG indicators employed in this study may
oversimplify the real problems. Indicators such as
political participation and religious freedom are
rarely captured perfectly in a democracy index.
Therefore, future studies are encouraged to explore
human development further by including other
relevant indicators claimed to associate with
subjective well-being. Three, due to the availability
of the data our statistical analysis cannot compute the
progress of SDGs in 2016 to 2020 and the growth of
HDI altogether in the same model. However, our
findings can still provide a nuanced description of the
relation between SDGs and the HDI as well as the
growth of HDI in Indonesia.
In conclusion, this study shows that relevant SDG
indicators are related to the growth of HDI in
Indonesia. Given the embeddedness of internet in
people’s daily life, having access to the internet is
shown to be the strongest predictor for the growth of
HDI (see Puspitasari & Ishii, 2016; Setiawan &
Suhartomo, 2019; Sujarwoto & Tampubolon, 2016
for internet impacts and divides in Indonesia).
Additionally, we show a glance of optimism in the
growth of HDI in Indonesia. Although the disparity
between provinces is still substantial, the HDI in
Indonesia has shown to keep growing. Overall,
despite criticisms directed towards the measure of
HDI and the operationalization of SDGs, both
concepts still provide a useful yardstick to gauge the
ICE-HUMS 2021 - International Conference on Emerging Issues in Humanity Studies and Social Sciences
478

human development of a country relative to others
and allow for cross-province comparison within one
country (Adam, Kammas, & Lapatinas, 2015; Blum,
2013; Hák, Janoušková, & Moldan, 2016). Moreover,
the link between SDGs and the HDI paves the way
for further investigation on the importance of well-
being towards the development of a nation,
considering its objective and subjective nature. This
study is expected to encourage future research to
build upon the current impact of the Covid-19
pandemic on the growth of HDI in the next few years.
REFERENCES
Adam, A., Kammas, P., & Lapatinas, A. (2015). Income
inequality and the tax structure: Evidence from
developed and developing countries. Journal of
Comparative Economics, 43(1), 138–154.
https://doi.org/10.1016/J.JCE.2014.05.006
Badan Pusat Statistik. (2019). Indikator tujuan
pembangunan berkelanjutan Indonesia 2019
[Indicators of Indonesia’s 2019 sustainable
development goals].
Badan Pusat Statistik. (2021a). Persentase penduduk usia 0-
17 Tahun dengan kepemilikan akta lahir (40%
Terbawah).
Badan Pusat Statistik. (2021b). Persentase rumah tangga
yang memiliki akses terhadap hunian yang layak dan
terjangkau menurut provinsi.
Badan Pusat Statistik. (2021c). Statistik Indonesia.
Badan Pusat Statistik. (2021d). Unmet need pelayanan
kesehatan menurut Provinsi, 2015-2018.
Biggeri, M., & Mauro, V. (2018). Towards a more
‘Sustainable’ Human Development Index: Integrating
the environment and freedom. Ecological Indicators,
91(March), 220–231. https://doi.org/10.1016/j.eco
lind.2018.03.045
Blum, M. (2013). The influence of inequality on the
standard of living: Worldwide anthropometric evidence
from the 19th and 20th centuries. Economics & Human
Biology, 11(4), 436–452. https://doi.org/10.1016/
J.EHB.2012.12.002
Chen, W. (2011). How education enhances happiness:
Comparison of mediating factors in four East Asian
Countries. Social Indicators Research 2011 106:1,
106(1), 117–131. https://doi.org/10.1007/S11205-011-
9798-5
Conceição, P. (2019). Human development and the SDGs
(pp. 24–26). pp. 24–26. The World Bank.
Dean, J. H., Shanahan, D. F., Bush, R., Gaston, K. J., Lin,
B. B., Barber, E., … Fuller, R. A. (2018). Is nature
relatedness associated with better mental and physical
health? International Journal of Environmental
Research and Public Health, 15(7), 9–11.
https://doi.org/10.3390/ijerph15071371
Drury, J., Evripidou, A., & van Zomeren, M. (2015).
Empowerment: The intersection of identity and power
in collective action. In D. Sindic, M. Barreto, & R. C.
Lopes (Eds.), The intersection between power and
identity (pp. 1–36). Psychology Press.
Eyesenbach, G. (2007). Poverty, human development, and
the role of eHealth. J Med Internet Res, 9(4)(e34).
https://doi.org/10.2196/jmir.9.4.e34
Field, A. (2009). Discovering Statistics Using SPSS (3rd
ed.). California: Sage Publications.
Hák, T., Janoušková, S., & Moldan, B. (2016). Sustainable
Development Goals: A need for relevant indicators.
Ecological Indicators, 60, 565–573. https://doi.org/
10.1016/J.ECOLIND.2015.08.003
Haryanto, J. T. (2018, September). Isu SDGs dan perbaikan
kualitas IPM. Investor.Id.
Herrero, C., Martínez, R., & Villar, A. (2012). A Newer
human development index. Journal of Human
Development and Capabilities, 13(2), 247–268.
https://doi.org/10.1080/19452829.2011.645027
Hou, J., Walsh, P. P., & Zhang, J. (2015). The dynamics of
Human Development Index. Social Science Journal,
52(3), 331–347. https://doi.org/10.1016/j.soscij.2014.
07.003
Johnson, K.-A. (2016). Do internet and human capital
matter for economic growth in developing countries?
Empirical evidence from WAEMU Countries. Modern
Economy, 07(11), 1186–1197. https://doi.org/10.4236/
me.2016.711116
Kim, H.-Y. (2013). Statistical notes for clinical researchers:
Assessing normal distribution (2) using skewness and
kurtosis. Restorative Dentistry & Endodontics, 38(1),
52. https://doi.org/10.5395/rde.2013.38.1.52
Klugman, J., Rodríguez, F., & Choi, H. J. (2011). The HDI
2010: New controversies, old critiques. Journal of
Economic Inequality, 9(2), 249–288. https://doi.org/
10.1007/s10888-011-9178-z
Lind, N. (2019). A Development of the Human
Development Index. Social Indicators Research,
146(3), 409–423. https://doi.org/10.1007/s11205-019-
02133-9
MacIlvaine, W. R., Nelson, L. A., Stewart, J. A., & Stewart,
W. C. (2013). Association of strength of community
service to personal wellbeing. Community Mental
Health Journal 2013 50:5, 50(5), 577–582.
https://doi.org/10.1007/S10597-013-9660-0
Marcinko, I. (2015). The moderating role of autonomous
motivation on the relationship between subjective well-
being and physical health. PLOS ONE, 10(5),
e0126399. https://doi.org/10.1371/JOURNAL.PONE.
0126399
Nguefack-Tsague, G., Klasen, S., & Zucchini, W. (2011).
On weighting the components of the human
development index: A statistical justification. Journal
of Human Development and Capabilities, 12(2), 183–
202. https://doi.org/10.1080/19452829.2011.571077
Prasetia, A. (2021, February). Indeks demokrasi 2020
turun, KSP jelaskan upaya pemerintah cegah
intoleransi. Detik.Com.
Puspitasari, L., & Ishii, K. (2016). Digital divides and
mobile Internet in Indonesia: Impact of smartphones.
Human Development Index in Indonesia: Are We in Line with SDGs and How Much Have We Grown?
479
Telematics and Informatics, 33(2), 472–483.
https://doi.org/10.1016/j.tele.2015.11.001
Sayles, J. S., Mancilla Garcia, M., Hamilton, M.,
Alexander, S. M., Baggio, J. A., Fischer, A. P., Pittman,
J. (2019). Social-ecological network analysis for
sustainability sciences: A systematic review and
innovative research agenda for the future.
Environmental Research Letters, 14(9). https://doi.org/
10.1088/1748-9326/ab2619
Setiawan, T., & Suhartomo, A. (2019). The relation
between internet use and societal development in
Indonesia. ICSECC 2019 - International Conference on
Sustainable Engineering and Creative Computing: New
Idea, New Innovation, Proceedings, 133–137.
https://doi.org/10.1109/ICSECC.2019.8907127
Steptoe, A., Deaton, A., & Stone, A. A. (2015). Subjective
wellbeing, health, and ageing. The Lancet, 385(9968),
640–648. https://doi.org/10.1016/S0140-6736(13)614
89-0
Stiglitz, J. E., Sen, A., & Fitoussi, J.-P. (2009). Report by
the Commission on the Measurement of Economic
Performance and Social Progress.
Sujarwoto, S., & Tampubolon, G. (2016). Spatial inequality
and the internet divide in Indonesia 2010–2012.
Telecommunications Policy, 40(7), 602–616.
https://doi.org/10.1016/j.telpol.2015.08.008
UNDP. (n.d.). Sustainable development goals.
UNDP. (1990). Human Development Report 1990.
Concept and measurement of human development. In
United Nations Development Programme.
UNDP. (2010). Indeks demokrasi Indonesia 2010:
Kebebasan yang bertanggungjawab dan Substansial.
UNDP. (2020). Human Development Report 2020 -The
Next Frontier: Human Development and the
Anthropocene.
World Health Organization. (2017). State of health
inequality Indonesia. Retrieved from https://apps.who.
int/iris/handle/10665/259685
ICE-HUMS 2021 - International Conference on Emerging Issues in Humanity Studies and Social Sciences
480
