
Breast Cancer Histopathological Image Classification using
Progressive Resizing Approach
Hendra Bunyamin
1a
, Hapnes Toba
1b
, Meyliana
2c
and Roro Wahyudianingsih
3d
1
Informatics Engineering, Maranatha Christian University, Jl Prof. drg. Surya Sumantri, M.P.H. No. 65, Bandung, Indonesia
2
Accounting Department, Maranatha Christian University, Jl Prof. drg. Surya Sumantri, M.P.H. No. 65, Bandung, Indonesia
3
Faculty of Medicine, Maranatha Christian University, Jl Prof. drg. Surya Sumantri, M.P.H. No. 65, Bandung, Indonesia
Keywords: Breast Cancer Histopathological Image Classification, Deep Learning, Convolutional Neural Network, Pro-
gressive Resizing, Vahadane Image Normalization.
Abstract: Breast cancer (BC) is a lethal disease which causes the second largest number of deaths among women in the
world. A diagnosis of biopsy tissue stained with hematoxylin & eosin, commonly named BC histopathological
image, is a non-trivial task which requires a specialist to interpret. Recently, the advance in machine learning
techniques driven by deep learning techniques and competition datasets has enabled the automation and pre-
diction of histopathological images interpretation. Each different competition dataset has its own state-of-the-
art technique; therefore, this paper explores an avenue of research by merging popular BC histopathological
images research datasets and searching for the best performing models on the unified dataset. The merging
process maintains similar classes among the datasets; consequently, the unified dataset has three classes and
the prediction problem is cast into multi-class classification problem. We propose a combination of Vahadane
preprocessing technique and training method using progressive resizing approach. Our approach demonstrates
that both utilizing Vahadane image normalization and utilizing our progressive resizing technique achieve
around 99% in F
1
score , which is comparable among other state-of-the-art models. The unified dataset is also
provided online for advancing research in histopathological images interpretation.
1
INTRODUCTION
Breast cancer (BC) is the cause of the second largest
deaths among women (Spanhol et al., 2016; Bray et
al., 2018; McKinney et al., 2020) in the world. Data
Global Cancer Observatory 2018 from World Health
Organization (WHO) showed that the most number of
cancer cases in Indonesia is BC with 58,256 of
348,809 patients or 16.7% (World Health
Organization, 2018). However, cancer screening re-
search encompassing imaging procedures, such as di-
agnostic mammogram (X-rays), magnetic resonance
imaging, ultrasound (sonography), and thermography
has been conducted for more than four decades and
deemed beneficial to likely lessen number of deaths
caused by BC significantly (Stenkvist et al., 1978;
Institute of Medicine and National Research Council,
a
https://orcid.org/0000-0002-5150-4394
b
https://orcid.org/0000-0003-0586-8880
c
https://orcid.org/0000-0001-6198-7484
d
https://orcid.org/0000-0002-0800-9937
2005; Tabar et al.
,
2011
;
Canadian Task Force on
Preventive Health Care, 2011; Marmot et al., 2013).
Furthermore, patients with suspected breast
cancer need to have a biopsy which is frequently used
to con- firm the diagnosis before treatment is planned
(Millis, 1984).
Generally, a biopsy is conducted by taking a
sample of tissue from a suspicious area. Next, the
sample is stained with hematoxylin and eosin (H&E)
substance used to differentiate a nucleus with a
parenchyma. The difference can be observed through
an optical microscope; moreover, the images seen
through the microscope are captured as giga-pixel
images and commonly named as whole-slide images
(WSI) for further digital image processing, such as
cancer cell segmentation or detection (Aresta et al.,
2019).
Bunyamin, H., Toba, H., Meyliana, . and Wahyudianingsih, R.
Breast Cancer Histopathological Image Classification using Progressive Resizing Approach.
DOI: 10.5220/0010754100003113
In Proceedings of the 1st International Conference on Emerging Issues in Technology, Engineering and Science (ICE-TES 2021), pages 351-357
ISBN: 978-989-758-601-9
Copyright
c
2022 by SCITEPRESS – Science and Technology Publications, Lda. All rights reserved
351
Biopsy diagnosis from histopathological images
is considered a gold standard for determining al most
all types of cancer, specifically BC International
Agency for Research on Cancer, 2012; David
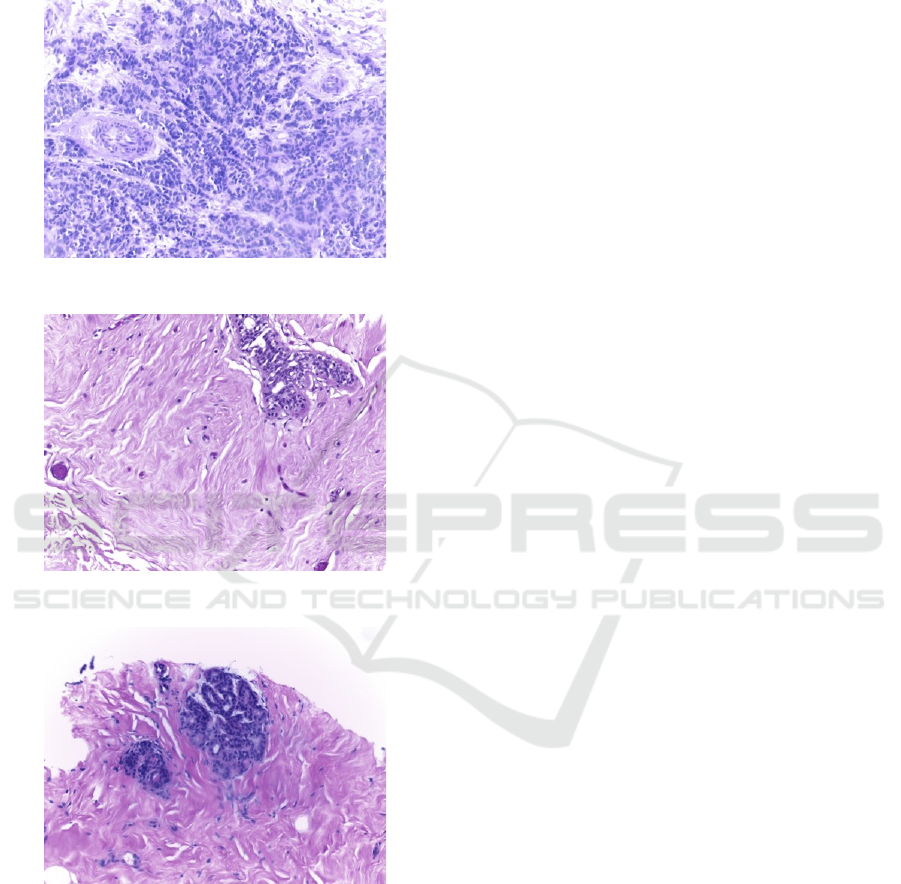
Figure 1: An image of malignant cells.
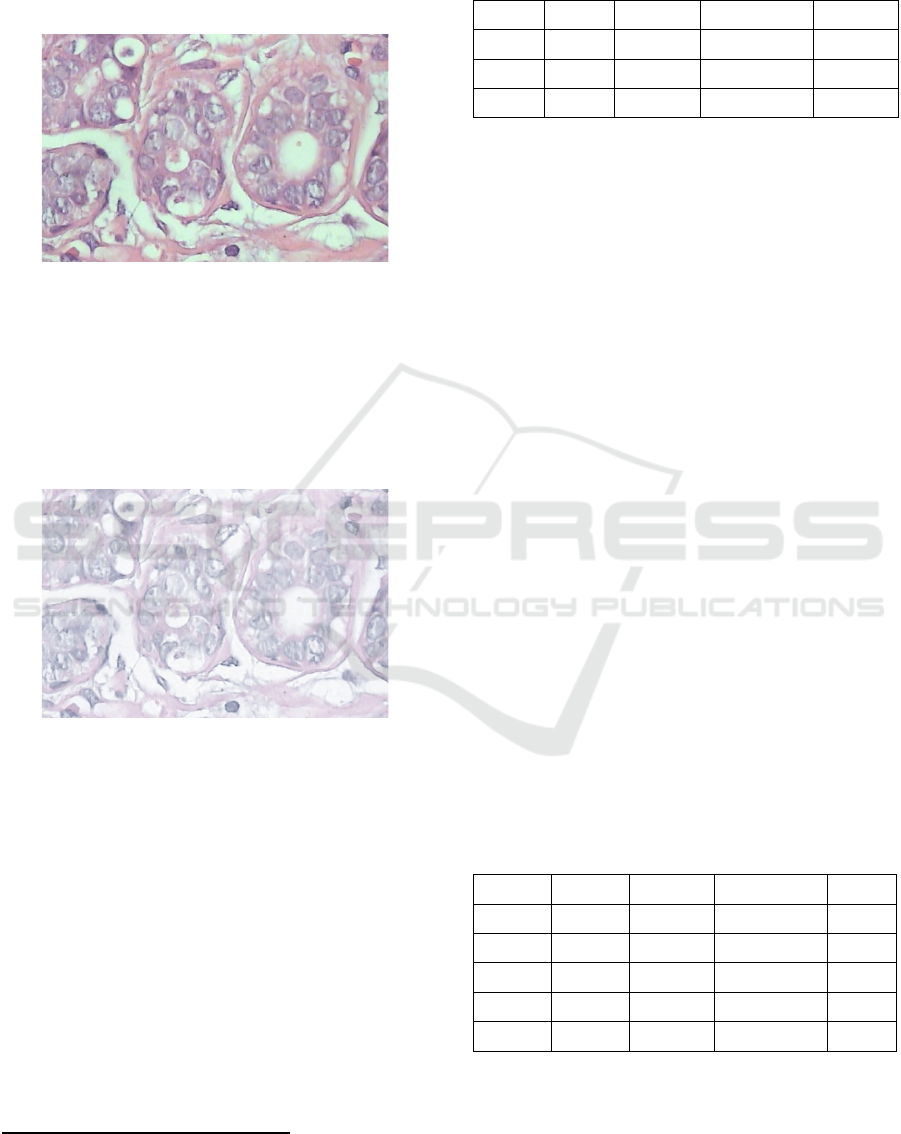
Figure 2: An image of benign cells.
Figure 3: An image of normal cells.
S. Strayer, 2014). Properties of the histo-
pathological images are analyzed by pathologists in
order to find types of the breast cancers. Figure 1 and
Figure 2 show malignant and benign cancer cells
while Figure 3 shows normal cells.
In developing countries, such as Indonesia, the
ratio of physician to population is still lower than the
WHO-recommended figure; moreover, ongoing geo-
graphical disparities exist which exacerbate the short-
age of physicians (Asia Pacific Observatory on
Health Systems and Policies, 2017). With the advent
of Artificial Intelligence (AI), particularly deep
learning, there are vast opportunities to help classify
types of BC with some degrees of automation.
are datasets which charge the deep learning algo-
rithms. Fortunately, international research organiza-
tions such as Pathological Anatomy and Cytopathol-
ogy (P&D) Laboratorium in Parana, Brazil Spanhol
et al., 2016), the Institute of Molecular Pathology and
Immunology of the University of Porto (IPA-
TIMUP) and the Institute for Research and
Innovation in Health (i3S) in Porto, Portugal (Aresta
et al., 2019), and Center for Bio-Image Informatics,
University of California in Santa Barbara, USA
(Gelasca et al., 2008) have released publicly available
BC histopathological image datasets.
Each publicly available dataset has its own char-
acteristic; furthermore, combining these characteris-
tics into a unified dataset will make a rich learning
dataset for deep learning models. A deep learning
model which learns from the unified dataset will be
better in generalization on unseen data than the one
learns from only one dataset (Geron, 2019
).
Therefore
,
firstly this paper also provides a unified
dataset as a new publicly available dataset to help this
research field progress.
Secondly, the paper initializes a deep learning
model which functions as a baseline on the new uni-
fied dataset. After the Vahadane preprocessing tech-
nique (Vahadane et al., 2016) is applied into our uni-
fied dataset, we feed the preprocessed dataset into a
model which employs a progressive resizing ap-
proach (Howard and Gugger, 2020). Both the
preprocessing technique and the resizing approach
are suitable to our problem; hence, the performance
of our model has soared and put the model among
state-of-the-art models for BC histopathological
image classification problem.
In the remainder of this paper, we first explore
related work which delves into various datasets and
relevant BC histopathological image classification
techniques. Next, we turn our attention to the
Vahadane preprocessing technique and progressive
resizing. Finally, we discuss our results and conclude
with a few general observations and directions for
future work
2
RELATED WORK
The related work of our paper discusses BC
histopathological images datasets and relevant BC
classification techniques.
ICE-TES 2021 - International Conference on Emerging Issues in Technology, Engineering, and Science
352

2.1
Histopathological Image Datasets
We have searched and found three publicly accessi-
ble datasets on the Internet that are BreaKHis (Span-
hol et al., 2016), BACH (Aresta et al., 2019), and
UCSB benchmark dataset for bioimaging applica-
tion (Gelasca et al., 2008).
The BreaKHis consists of 7,909 BC
histopathological
images taken from 82 patients from
January 2014 to December 2014 with different
magnifying factors (40, 100, 200, and 400) (Spanhol
et al., 2016). Moreover, the numbers of benign and
malignant cases are 2,480 and 5,429 respectively
.
The
benign category includes adenosis (A), fibroadenoma
(F), phyllodes tumor (PT), and tubular adenoma
(TA); additionally, the malignant category covers
ductal carcinoma (DC), lobular carcinoma (LC),
mucinous carcinoma (MC), and papillary carcinoma
(PC). Laboratorium P&D (Pathological Anatomy and
Cytopathology, Parana, Brazil) has published this
dataset for research purposes.
The BACH was released as a grand challenge on
BC histopathological images which is a part of the
15th International Conference on Image Analysis and
Recognition (ICIAR 2018). The annotation for the
dataset was done by pathologists from the Institute of
Molecular Pathology and Immunology of the
University of Porto (IPATIMUP) and the Institute for
Research and Innovation in Health (i3S) (Aresta et
al., 2019). The histopathological images were
obtained from patients in Porto and Castelo Branco
area, Portugal in year 2014, 2015, and 2017. The
dataset consists of microscopy dataset and whole-
slide images dataset; specifically, the whole-side
images dataset is used for an image segmentation task
besides. Our research employs the microscopy dataset
which categorizes BC cells into 1) benign, 2)
malignant, 3) in situ carcinoma, and 4) invasive
carcinoma. Furthermore, the dataset is composed of
400 training images and 100 test images with equal
number of images in each category.
The third dataset is University of California, Santa
Barbara (UCSB) benchmark dataset for bioimaging
application (Gelasca et al., 2008). The dataset
comprises of 58 histopathological images which are
used for BC histopathological image classification
task with associated ground truth data available.
2.2
Histopathological Classification
Techniques
Prior work has established several techniques to solve
BC histopathological images classification problem.
An early BC histopathological classification
technique begins with three extracted features from
images, that are curvelet transform, statistical data
from Gray Level Co-occurrence Matrix (GLCM), and
Completed Local Binary Patterns (CLBP) (Zhang et
al., 2011). Next, these three features construct an
input layer for Random Subspace Ensemble
(Skurichina and Duin, 2002).
The Random Subspace Ensemble in their research
comprises 20 multi-layer perceptron (MLP) whose
number of hidden layers are random values in range
between 30 and 50 inclusively. The accuracy of the
model has achieved 95.22% on the 3-class (normal, in
situ carcinoma, and invasive carcinoma) dataset
released by the Computer Science department of Israel
Institute of Technology which is, unfortunately, not
publicly available.
Other prior work employs a combination of Con-
volutional Neural Network (CNN) and a Support
Vector Machines classifier on BACH dataset (Araujo
et al., 2017). This combination model achieves
accuracies of 77.8% for four-class and 83.3% for
carcinoma/non-carcinoma BC classification tasks and
recall of 95.6%. Another work on BACH dataset
comes from combining several deep neural networks
and gradient boosted trees classifiers (Rakhlin et al.,
2018). The model gains 87.2% accuracy and 93.8%
accuracy for 4-class classification and 2-class
classification task respectively. Lastly, a work on
BACH dataset fine-tunes Inception-v3 CNN with a
strategy for image patches extraction (Golatkar et al.,
2018). The Inception-v3 model acquires accuracy of
85% over four classes and 93% for non-cancer
(normal or benign) vs. malignant (in situ or invasive
carcinoma). A current state-of-the-art technique,
which outperforms the previous work by Araujo et
al. (2017), Rakhlin et al. (2018), and Golatkar et al.
(2018) forms
a new hybrid convolutional and
recurrent deep neural network enriched with
multilevel feature representation of image patches
(Yan et al., 2020). This technique combines the
strengths of convolutional and recurrent neural
networks and preserves the short-term and long-
term spatial correlations among the patches. The
method achieves an average accuracy of 91.3% for 4-
class classification task. Unfortunately, the dataset of
this work is not available for outside of China.
3
RESEARCH METHODOLOGY
Our research methodology consists of merging the
dataset, preprocessing the dataset, building the
baseline, and constructing progressive resizing
approach.
Breast Cancer Histopathological Image Classification using Progressive Resizing Approach
353

3.1
Merging the Dataset
Three different datasets (Spanhol et al., 2016; Aresta
et al., 2019; Gelasca et al., 2008) have different
classes; therefore, in order to merge those different
classes, those labels need adjusting. Firstly, the
classes
in BreaKHis dataset are benign and malig- nant. The
benign class has subclasses: adenosis, fi- broadenoma,
phyllodes tumor, and tubular adenoma, while the
malignant class consists of adenosis, fi- broadenoma,
phyllodes tumor, and tubular adenoma. Secondly,
BACH dataset have four classes, such as normal,
benign, in situ carcinoma, and invasive carci- noma.
Lastly, UCSB benchmark dataset has benign and
malignant classes. After considering the number of
classes, we opt to choose three classes, that are
normal, benign, and malignant. Specifically, both in
situ carcinoma and invasive carcinoma of the BACH
are joined into the malignant class of the new unified
dataset.
3.2
Color Normalization
Next, the Vahadane technique which combines
Sparse Non-negative Matrix Factorization (SNMF)
and Structure-preserving Color Normalization
(SPCN) (Vahadane et al., 2016) is applied into our
images. Particularly, the Vahadane technique solves
both stain separation and color normalization
problems. The stain separation problem is cast into a
non-negative matrix factorization (NMF) with an
addition of a sparseness constraint. Moreover, the
color basis of an image is substituted by the one
of a pathologist-preferred target image. This is the
algorithm of SPCN whose advantage is to maintain
the image’s original stain concentrations. The way
SPCN works is through replacing the color basis of a
source image with those of a pathologist-preferred
target image, while still maintaining its original stain
concentrations. The flexibility to select a preferred
target appearance in different scenarios as opposed to
a fixed target color appearance model is another
advantage of our technique over others such as
Macenko et al. (2009).
3.3
Building the Baseline
ResNet-34 (He et al., 2016) is chosen to be the
baseline for our experiment because ResNet
architecture which relies on residual connections is the
most widely used architecture and proven to be a
strong baseline among CNN architectures;
furthermore, recent development in image
classification models is getting more and more on
using the same trick of residual connections or
tweaking the original ResNet architecture (Howard
and Gugger, 2020).
3.4
Constructing Progressive Resizing
Approach
Progressive resizing approach was one of the most
important innovations when fast.ai and its team won
the DAWNBench Competition in 2018 (Howard and
Gugger, 2020). The idea is very simple, that is to start
training using small images and finally end the
training using large images. Training with small
images for most of the epochs helps finishing the
training much faster. Additionally, completing
training with large images achieves a much higher
final accuracy. Progressive resizing is also another
strategy of data augmentation. Accordingly, better
generalization of our models should be expected
when they are trained with progressive resizing.
4
RESULTS
4.1
The Unified Dataset
The unified dataset has three classes such as normal,
benign, and malignant.
Table 1: Statistics of image sizes which consist of mean,
standard deviation, minimum, Q1, Q2, Q3, and maximum
(measurement unit: pixel).
Statistics Width Height
Count
8
,
367
.
000
8, 367.000
Mean 513.540 765.802
Standard deviation 230.537 287.778
Minimum 456.000 700.000
Q
1
460.000 700.000
Q
2
(median)
460.000 700.000
Q
3
460.000 700.000
Maximum
1
,
536
.
000
2, 048.000
Table 1 shows the statistics of our unified dataset.
Furthermore, 70% of the dataset is chosen randomly
to be training set and the rest is determined as
validation set. The code to unify the three datasets can
be viewed in the github repository.
ICE-TES 2021 - International Conference on Emerging Issues in Technology, Engineering, and Science
354
4.2
Normalizing Colors of Images
We employ StainTools library to do the nor-
malization. The library can be found at Peter
Byfield’s github repository
e
.
Figure 4: An image before applying Vahadane normaliza-
tion.
Figure 4 and Figure 5 show an example of an im-
age before and after normalization respectively.
Briefly, normalization is a process of replacing the
color basis of a source image with those of a
pathologist-preferred target image, while still
maintaining its original stain concentrations.
Figure 5: An image after applying Vahadane normalization.
4.3
Performance of the First Baseline
ResNet-34 model as a baseline is created by employ-
ing fast.ai library. Before the model is trained with the
unified dataset, all images are resized into the mean of
width and height of the images that is 514 pixels by 766
pixels respectively; specifically, the resizing
technique does not preserve the aspect ratio of the
images. In addition, the standard of one epoch is used
to do a fine-tuning process on the pre-trained ResNet-
3 4 ( H o w a r d a n d G u g g e r , 2 0 2 0 ) .
e
https://github.com/Peter554/StainTools
Table 2: The F
1
scores of the the baseline by fine-tuning
ResNet-34 pre-trained model (Train = train loss, Valid =
validation loss; the higher the F
1
score is, the better the
performance of the baseline is).
Epoch Train Valid F
1
score Time
0
0.636 0.516 85.547% 19:06
Epoch Train Valid F
1
score Time
0
0.104 0.741 83.733% 05:13
Table 2 displays the performance of ResNet-34
model. We opt to use F
1
score as our performance
metric since the number of instances in each class
of our dataset are imbalanced and F
1
is the best choice
for measuring performance on imbalanced datasets
(Sokolova and Lapalme, 2009).
4.4
Performance of the Progressive
Resizing
To assess the effect of progressive resizing, we con-
struct another baseline (ResNet-50) based on a data
augmentation technique, the so-called presizing trick.
Firstly, we resize all images to dimensions that are
significantly larger than the target training
dimensions. Next, we arrange all common
augmentation operations including a resize to the
final target size into one big chuck of operation, and
finally performing the operation on the GPU only
once at the end of trick.
The ResNet-50 enhanced with a presizing trick is
quite a strong baseline (F
1
score of 98.443%). How-
ever, we can still improve the performance of the
model by using the progressive resizing. Firstly, we
normalize our input data (Z-normalization) so it has a
mean of 0 and a standard deviation of 1 and verify the
effect of Z-normalization on training the model.
Table 3: The F
1
scores of the the second baseline (ResNet-
50) by using presizing trick (Train = train loss, Valid =
validation loss; the higher the F
1
score is, the better the
performance of the baseline is).
Epoch Train Valid F
1
score Time
0
0.313 0.312 91.196% 03:40
1
0.213 0.808 74.228% 03:39
2
0.160 0.089 97.547% 03:38
3
0.116 0.048 97.976% 03:38
4
0.079 0.0315 98.443% 03:38
Breast Cancer Histopathological Image Classification using Progressive Resizing Approach
355
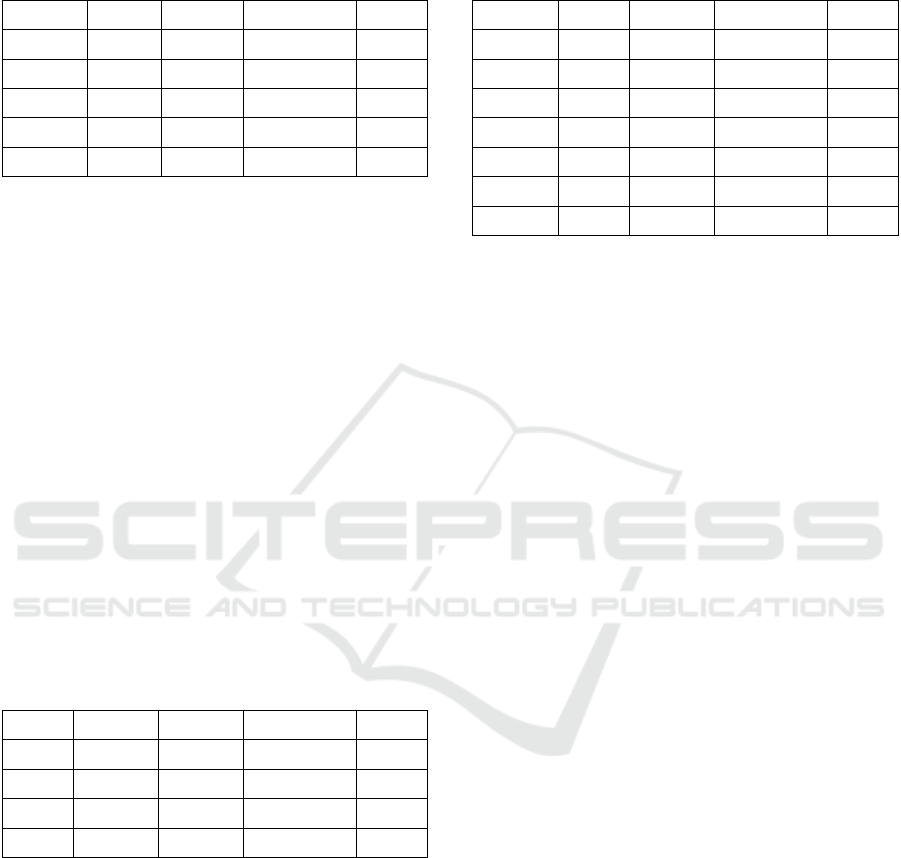
Table 4: F
1
scores of the the third baseline (ResNet-50) by
using presizing trick and Z-normalization (Train = train
loss, Valid = validation loss; the higher the F
1
score is, the
better the performance of the baseline is).
Epoch Train Valid F
1
score Time
0
0.578 0.376 93.182% 03:40
1
0.239 0.249 93.90% 03:40
2
0.148 0.046 98.384% 03:38
3
0.092 0.038 98.626% 03:39
4
0.072 0.037 98.682% 03:38
Table 4 shows utilizing Z-normalization improves
F
1
score a little; however, Z-normalization on input
data becomes a standard when working with pre-
trained models. Next, we employ the progressive
resizing approach by starting a training with small
images (128 pixels by 128 pixels) and ending the
training using large images (the original image size).
This approach works because features learned by early
layers of CNNs are not quite specific to the size of an
image as the layers find curves and edges. Moreover,
the subsequent layers may later find shapes such as
cell shapes. Therefore, changing image size in the
middle of the training does not mean that the
parameters of the models are completely different; it
just requires the models to learn a little bit differently,
that is by using transfer learning, in other words, fine-
tuning.
Table 5: F
1
scores of finding an optimal learning rate by
Cyclical Learning Rates method (Train = train loss, Valid
= validation loss; the higher the F
1
score is, the better the
performance of the baseline is).
Epoch Train Valid F
1
score Time
0
0.931 0.963 78.857% 03:21
1
0.397 0.109 95.593% 03:22
2
0.198 0.053 97.787% 03:21
3
0.115 0.042 98.426% 03:20
Table 5 displays the process of finding an
optimal learning rate by Cyclical Learning Rates
(Smith, 2017).
Table 6: F
1
scores of fine-tuning ResNet-50 as a part of
progressive resizing approach (Train = train loss, Valid =
validation loss; the higher the F
1
score is, the better the
performance of the baseline is).
Epoch Train Valid F
1
score Time
0
0.109 0.049 97.117% 03:39
Epoch Train Valid F
1
score Time
0
0.081 0.044 98.501% 03:40
1
0.097 0.033 98.861% 03:39
2
0.076 0.025 98.981% 03:38
3
0.060 0.025 98.924% 03:39
4
0.050 0.022 99.102% 03:38
Table 6 shows that utilizing progressive resizing
approach achieves F
1
score of 99.102%. Although our
performance cannot be compared to the current state-
of-the-art (Yan et al., 2020) and other previous works
because of different metrics (Araujo et al.,
2017;
Rakhlin et al., 2018; Golatkar et al., 2018) and dataset
(Yan et al., 2020), to the best of our knowledge, the
performance of our approach is among the highest BC
classification model considering its nearly perfect F
1
score. Source codes of our approach are publicly
available at our github repository.
5
CONCLUSIONS
We have created a unified dataset merged from three
popular datasets and propose the dataset for
advancing research in BC classification field.
Moreover, in addition to the dataset contribution, we
also provided a strong model using progressive
resizing approach whose F
1
score is 99.102%. We
argue that our model is comparable among other state-
of-the-art models for the dataset.
REFERENCES
Araujo, T., Aresta, G., Castro, E., Rouco, J., Aguiar, P.,
Eloy, C., Polonia, A., and Campilho, A. (2017).
“Classification of Breast Cancer Histology Images
using Convolutional Neural Networks”. PLOS ONE,
12(6), 1-14.
Aresta, G., Araujo, T., Kwok, S., Chennamsetty, S. S.,
Safwan, M., Alex, V., Marami, B., Prastawa, M., Chan,
M., Donovan, M., et al. (2019). “BACH: Grand
Challenge on Breast Cancer Histology Images”. Med.
Image Anal. 6(1), 122-139.
Asia Pacific Observatory on Health Systems and Policies
(2017). “The Republic of Indonesia Health System
ICE-TES 2021 - International Conference on Emerging Issues in Technology, Engineering, and Science
356

Review. Health Systems Tran. 7(1), 24-30.
Bray, F., Ferlay, J., Soerjomataram, I., Siegel, R. L., Torre,
L. A., and Jemal, A. (2018). “ Global Cancer Statistics
2018: Globocan Estimates of Incidence and Mortality
Worldwide for 36 Cancers in 185 Countries”. CA: A
Cancer J. Clin. 68(6), 394-424.
Canadian Task Force on Preventive Health Care (2011).
“Recommendations on Screening for Breast Cancer
in Average-risk Women Aged 40-74 Years”. Cmaj,
183(17), 1991-2001.
David S. Strayer, E. R. (2014). Rubin’s Pathology: Clinico-
pathologic Foundations of Medicine (Pathology (Ru-
bin)) Seventh Edition. LWW.
Gelasca, E. D., Byun, J., Obara, B., and Manjunath, B.
(2008). “Evaluation and Benchmark for Biological Im-
age Segmentation”. In 2008 15th IEEE International
Conference on Image Processing, 1816-1819. IEEE.
Geron, A. (2019). Hands-on Machine Learning with Scikit-
Learn, Keras, and TensorFlow: Concepts, Tools, and
Techniques to Build Intelligent Systems Second Edition.
O'Reilly Media Inc.
Golatkar, A., Anand, D., and Sethi, A. (2018). “Classifica-
tion of Breast Cancer Histology using Deep Learning”.
In International Conference Image Analysis and
Recognition, 837-844. Springer.
He, K., Zhang, X., Ren, S., and Sun, J. (2016). “Deep
Residual Learning for Image Recognition”. In
Proceedings of the IEEE Conference on Computer
Vision and Pattern Recognition, 770-778.
Howard, J. and Gugger, S. (2020). Deep Learning for
Coders with fastai and PyTorch. O’Reilly Media Inc.
Institute of Medicine and National Research Council
(2005). Saving Women’s Lives: Strategies for Improving
Breast Cancer Detection and Diagnosis. The National
Academies Press, Washington, DC.
International Agency for Research on Cancer (2012). WHO
Classification of Tumours of the Breast [OP]
(Medicine) 4th Edition. World Health Organization.
Macenko, M., Niethammer, M., Marron, J. S., Borland, D.,
Woosley, J. T., Guan, X., Schmitt, C., and Thomas, N.
E. (2009). “A Method for Normalizing Histology Slides
for Quantitative Analysis”. In 2009 IEEE International
Symposium on Biomedical Imaging: From Nano to
Macro, 1107-1110. IEEE.
Marmot, M. G., Altman, D., Cameron, D., Dewar, J.,
Thompson, S., and Wilcox, M. (2013). “The Benefits
and Harms of Breast Cancer Screening: An
Independent Review”. British Journal of Cancer,
108(11), 2205.
McKinney, S. M., Sieniek, M., Godbole, V., Godwin, J.,
Antropova, N., Ashrafian, H., Back, T., Chesus, M.,
Corrado, G. C., Darzi, A., Etemadi, M., Garcia-
Vicente, F., Gilbert, F. J., Halling-Brown, M., Hass-
abis, D., Jansen, S., Karthikesalingam, A., Kelly, C. J.,
King, D., Ledsam, J. R., Melnick, D., Mostofi, H.,
Peng, L., Reicher, J. J., Romera-Paredes, B., Side-
bottom, R., Suleyman, M., Tse, D., Young, K. C.,
De Fauw, J., and Shetty, S. (2020). “International
Evaluation of an AI System for Breast Cancer
Screening”. Nat. 577(7788), 89-94.
Millis, R. R. (1984). “Needle Biopsy of the Breast”. Monog.
Pathol. (25), 186-203.
Rakhlin, A., Shvets, A., Iglovikov, V., and Kalinin, A. A.
(2018). “Deep Convolutional Neural Networks for
Breast Cancer Histology Image Analysis”. In
International Conference Image Analysis and
Recognition, 737-744. Springer.
Skurichina, M. and Duin, R. P. (2002). “ Bagging,
Boosting and the Random Subspace Method for Linear
Classifiers”. Pattern Anal. Appl. 5(2), 121-135.
Smith, L. N. (2017). “Cyclical Learning Rates for Training
Neural Networks”. In 2017 IEEE Winter Conference on
Applications of Computer Vision (WACV), 464-472.
IEEE.
Sokolova, M. and Lapalme, G. (2009). “A Systematic
Analysis of Performance Measures for Classification
Tasks”. Infor. Proc. Manage. 45(4), 427-437.
Spanhol, F. A., Oliveira, L. S., Petitjean, C., and Heutte, L.
(2016). “A Dataset for Breast Cancer Histopathological
Image Classification”. IEEE Trans. on Biomedical
Engineering, 63(7), 1455-1462.
Stenkvist, B., Westman-Naeser, S., Holmquist, J., Nordin,
B., Bengtsson, E., Vegelius, J., Eriksson, O., and Fox,
C. H. (1978). “Computerized Nuclear Morphometry as
an Objective Method for Characterizing Human Cancer
Cell Populations”. Cancer Res. 38(12), 4688-4697.
Tabar, L., Vitak, B., Chen, T. H.-H., Yen, A. M.-F., Cohen,
A., Tot, T., Chiu, S. Y.-H., Chen, S. L.-S., Fann, J. C.
Y., Rosell, J., et al. (2011). “Swedish Two-county Trial:
Impact of Mammographic Screening on Breast Cancer
Mortality during 3 Decades”. Radiology, 260(3), 658-
663.
Vahadane, A., Peng, T., Sethi, A., Albarqouni, S., Wang,
L., Baust, M., Steiger, K., Schlitter, A. M., Esposito, I.,
and Navab, N. (2016). “Structure-preserving Color
Normalization and Sparse Stain Separation for
Histological Images. IEEE Transactions on Medical
Imaging, 35(8), 1962-1971.
World Health Organization (2018). Data Global Can- cer
Observatory 2018. https://gco.iarc.fr/today/data/
factsheets/populations/360-indonesia-fact-sheets.pdf.
Accessed: 2020-01-04.
Yan, R., Ren, F., Wang, Z., Wang, L., Zhang, T., Liu, Y.,
Rao, X., Zheng, C., and Zhang, F. (2020). Breast Cancer
Histopathological Image Classification using a Hybrid
Deep Neural Network. Meth. 173(1), 52-60.
Zhang, Y., Zhang, B., and Lu, W. (2011). Breast Can-
cer Classification from Histological Images with
Multiple Features and Random Subspace Classifier
Ensemble. In AIP Conference Proceedings, 1371(1),
19-28.
Breast Cancer Histopathological Image Classification using Progressive Resizing Approach
357
