
Biochemical Characteristics of Ground Robusta Coffee under
Various Postharvest Technologies and Processing Parameters
Sri Wulandari, Makhmudun Ainuri
*
and Anggoro Cahyo Sukartiko
Department of Agro-Industrial Technology, Faculty of Agricultural Technology, Universitas Gadjah Mada
Jl. Flora 1 Bulaksumur, Yogyakarta 55281 Indonesia
Keywords: Caffeine, Chlorogenic Acid, Sucrose, Lipid, Roasting, Milling, Full Wash, Honey, Natural, Robusta Coffee.
Abstract: The purpose of this study was to analyze the biochemical characteristics of ground Robusta coffee under
various postharvest technologies and processing parameters and to find out the best treatment combination.
The orthogonal array notation of Taguchi method used was L
9
(3
4
) with four factors and three levels from
postharvest (full wash, honey, and natural), temperature (150 ºC, 175 ºC, 200 ºC), roasting time (10 minutes,
12.5 minutes, and 15 minutes) and milling (80 mesh, 100 mesh, and 120 mesh). The tested biochemical
characteristics were moisture, caffeine, chlorogenic acid, sucrose, and lipid contents. ANOVA for the mean
and SNR values were performed to determine significant differences between treatments. The best conditions
were carried out by Grey Relational Analysis, which furthermore tested with a confirmation test. The analysis
results showed that the effectiveness of the treatment had significant differences from each treatment from
parameters: moisture content, caffeine, chlorogenic acid, and lipid. The best conditions were the combination
of postharvest technologies (full wash), temperature and roasting time (175℃ and 12.5 minutes), and milling
(100 mesh) with moisture content (3.21%), caffeine (0.81%), chlorogenic acid (8.1%), sucrose (2.58%), lipids
(8.5%) and these results have been confirmed.
1 INTRODUCTION
Coffee is one of the mainstay plantation commodities
for Indonesia's national income and foreign
exchange. According to data from the International
Coffee Organization (ICO) in 2019, Indonesia ranks
fourth with a total production of 12 million bags of
coffee weighing 60 kg. In Indonesia, the Sumatra
Island is the largest coffee plantation area,
specifically in Bengkulu province which ranks 6
th
as
the largest coffee barn in Indonesia. Bengkulu coffee
plantation produced 184,168 tons of coffee in 2018
(Directorate General of Estate Crops, 2018)
There are three postharvest technologies for red-
picked Robusta coffee beans in Bandung Jaya,
Kepahiang, Bengkulu: In the full wash, honey, and
natural process. In the full wash process, the cherry
coffee must be soaked in a soaking tub, and then only
submerged cherry coffee is peeled off with a peeling
machine. Afterward, it is soaked for twenty-four
hours before dried in the drying house pulped coffee
beans washed. The honey process is simpler. After
the coffee cherries are peeled with a peeling machine,
the coffee beans from the pulper machine are
fermented in a sack for twenty-four hours, and then
dried in the drying house. In the natural process,
cherry coffee is not peeled in the peeling machine.
After soaking in the tub, it is immediately carried out
in the drying house.
Harvesting methods such as selective harvesting
are better than strip harvesting. Postharvest
processing affects all physical and roast quality
attributes so that variations in the physical properties
of roasting results due to different harvesting and
postharvest processing methods affect the quality of
ground coffee (Ameyu, 2016). Interaction of varieties
and postharvest processing methods affect the
biochemical yield of coffee beans (Kassaye et al.,
2019), such as different processing for wet pulper,
hand pulper, and eco pulper showing varying results
in fatty acid concentrations (Richard et al., 2020). The
wet method caused an increase in chlorogenic acid
and trigonelline content and a slight loss of sucrose
content compared to the dry method (Duarte et al.,
2010)
Roasting and milling operations are important
operations in ground coffee processing. Roasting is
the key to the quality of ground coffee, when roasting
Wulandari, S., Ainuri, M. and Sukartiko, A.
Biochemical Characteristics of Ground Robusta Coffee under Various Postharvest Technologies and Processing Parameters.
DOI: 10.5220/0010753900003113
In Proceedings of the 1st International Conference on Emerging Issues in Technology, Engineering and Science (ICE-TES 2021), pages 333-343
ISBN: 978-989-758-601-9
Copyright
c
2022 by SCITEPRESS – Science and Technology Publications, Lda. All rights reserved
333

occurs the process of forming the taste and aroma of
the coffee beans. The aroma of coffee is intrinsically
related to chemical compounds in the beans, which
occur during the roasting process (Toledo et al.,
2016). While the factors that influence the roasting
process are the type and physio-organoleptic
properties of the coffee beans, the ratio of temperature
and roasting time, the degree of roasting, and the
roasting method (Mulato, 2019). The roasting process
causes changes in the chemical composition and
biological activity of coffee: while natural phenolic
compounds may be lost, other antioxidant
compounds are formed such as the products of the
Maillard reaction (Wang et al., 2011). Roasting
involves high-temperature treatment which triggers
non-enzymatic browning reactions, breakdown of
polymers (proteins, lipid, carbohydrates), breakdown
of polyphenols, and other chemical changes (Wei &
Tanokura, 2015).
The milling process in coffee aims to reduce the
particle size of coffee beans, this operation can also
affect the quality of ground coffee (Yüksel et al.,
2020). Like the fine texture of ground coffee, it also
determines the taste and aroma of ground coffee
(Bladyka, 2016).
Statistical methods have been developed and used
in various fields, one of which is optimization. The
statistical method commonly applied for optimization
is Taguchi. The Taguchi method is off-line quality
control which means preventive quality control that
ensures the product design or process before it
reaches production at the shop floor level. The
Taguchi method is expected to improve the quality of
products and processes while minimizing costs and
resources. The method is aimed to make the product
robust against noise (Sidi & Wahyudi, 2013). Taguchi
method is used to analyze the experimental finding to
achieve one or more of the following three objectives:
(1) to determine trends in the influence of factors and
interactions being studied, (2) to identify important
factors and their relative influence on outcome
variability, (3) to determine the best or optimum
conditions for a product or process (Roy, 2010).
Based on these considerations, it is necessary to
study the relationship between postharvest
technologies and processing parameters towards the
biochemical characteristics in premium, red-picked
Robusta coffee. This study aimed to analyze
differences in biochemical characteristics consisting
of moisture, caffeine, chlorogenic acid, sucrose, and
lipid content of premium red pick Robusta coffee
based on postharvest technologies (full wash, honey,
and natural) and processing parameters (roasting and
milling) of coffee in Bandung Jaya, Kepahiang,
Bengkulu. The Taguchi experiment was used in this
research and to find out the best conditions from
ground Robusta coffee used Grey Relational
Analysis.
2 METHODS (AND MATERIALS)
The method used in this research was the
experimental method which began with a literature
study, established problem formulations and
boundaries, determined parameters, performed the
tests, analyzed data, discussed test results, and drawn
the conclusions.
2.1 Taguchi Experimental Design
Experimental design involves evaluating the ability
of two or more factors (parameters) to influence the
average or variability of the combined results for a
specific product or process characteristics. Several
steps proposed by Taguchi to conduct experiments
systematically include the following: problem
formulation, experimental objectives, identification
of independent and dependent factors, determination
of each factor level, identification of interactions
between control factors, selection of orthogonal
arrays, experimental preparation, experiments
execution, analysis of data results with ANOVA,
interpretation of results, and confirmation (Sidi and
Wahyudi, 2013).
2.1.1 Determination of Each Factor’s Level
(Roy, 2010)
Determination of factors and levels is carried out
based on the results of literature studies, discussions
with coffee experts, and academics. In this study,
four-factor variables were selected at three levels
presented in Table 1.
Table 1: Factors and level treatment selected in processing
ground Robusta coffee.
No Facto
r
Level 1 Level 2 Level 3
1
Postharvest
technolo
g
ies
Full
wash
Honey Natural
2
Temperature
of roasting
150ºC 175 ºC 200 ºC
3
Time of
roastin
g
10.0
minutes
12.5
minutes
15.0
minutes
4 Milling 80 mesh
100
mesh
120
mesh
ICE-TES 2021 - International Conference on Emerging Issues in Technology, Engineering, and Science
334
2.1.2 Selection of Orthogonal Matrix
(Roy, 2010)
An orthogonal matrix is a matrix of rows and
columns. Columns reflect the factors that can be
altered during an experiment. The row is a
combination of experiment levels and influence (Sidi
& Wahyudi, 2013). The orthogonal matrix used was
a standard matrix for experiments with a number of 3
levels: L
9
(3
4
), L
27
(3
13
) and L
81
(3
40
). The chosen
orthogonal matrix is one with a degree of freedom
equal to or greater than the experimental degree, as in
this study with a matrix L
9
(3
4
) where L denotes: Latin
square design, 9 denotes the number of rows or
experiments, 3 denotes the number of levels, and 4
denotes the number of columns or factors. Table 2
showed the orthogonal matrix L
9
(3
4
) which had 4
factors and 3 levels.
Table 2: Orthogonal Matrix L
9
(3
4
).
Experiment
number
Experimental factors
A B C D
1 1 1 1 1
2 1 2 2 2
3 1 3 3 3
4 2 1 2 3
5 2 2 3 1
6 2 3 1 2
7 3 1 3 2
8 3 2 1 3
9 3 3 2 1
The factors and levels that have been compiled
when combined follow the orthogonal array matrix
used, they can be presented in Table 3.
Table 3: The full interpretation of Taguchi’s orthogonal
array.
Experiment
number
Ex
p
erimental factors
Postharvest
technologies
Tempe-
rature of
roastin
g
Time of
roasting
Millin
g
1 Full wash 150ºC
10.0
minutes
80
mesh
2 Full wash 175ºC
12.5
minutes
100
mesh
3 Full wash 200ºC
15.0
minutes
120
mesh
4 Honey 150ºC
12.5
minutes
120
mesh
5 Honey 175ºC
15.0
minutes
80
mesh
6 Honey 200ºC
10.0
minutes
100
mesh
7 Natural 150ºC
15.0
minutes
100
mesh
8 Natural 175ºC
10.0
minutes
120
mesh
9 Natural 200ºC
12.5
minutes
80
mesh
2.1.3 The Stage of Carrying Out the
Taguchi Experiment
The processing treatment was carried out based on a
combination of factors and levels in the Taguchi
method with the experimental design shown in Table
3. The green coffee bean samples was prepared for
each treatment so that the total ingredients used were
27 kg (9 kg green bean full wash, 9 kg green bean
honey, and 9 kg natural green bean). Before the
roasting process, 1 kg of the bean sample was
weighed in triplicate one treatment. The sample was
roasted with the temperature and roasting time
according to the combination of factors and levels.
After the roasting process was complete, the coffee
was cooled and put into a labeled plastic. After
cooling (8-24 hours), the sample was grounded using
a grinder machine in the coffee processing plant.
Milling was carried out with a variety of mesh,
namely: 80, 100 and 120 mesh (Table 1).
The quality of ground coffee resulted from the
experiments was evaluated its biochemical
characteristics. The characters included moisture,
caffeine, chlorogenic acid, sucrose, and lipid content.
Determination of moisture content used the oven
method. The sample was dried in an oven set to 100
℃ - 102 ℃ until the sample has a constant weight.
Caffeine content was determined using the Balley-
Andrew method. The chlorogenic acid concentration
was measured using an HPLC instrument. The
sucrose content was calculated as the difference
between reducing sugar and the total sugar. The sugar
reduction was determined based on the Nelson
Somogyi method. Meanwhile, the lipid content was
measured using the Soxhlet method, the principle of
Soxhlet method was the separation of the components
contain in the substance by filtering for carried out
several times using a certain solvent so that the
desired component was obtained.
2.2 Data Analysis
2.2.1 Determine Effectiveness Treatments
with S/N (Signal to Noise) and ANOVA
The Taguchi method is used to design experiments
based on the orthogonal arrays to obtain the
maximum amount of information with minimum
Biochemical Characteristics of Ground Robusta Coffee under Various Postharvest Technologies and Processing Parameters
335

experiments. Moreover, it can also analyze the
experimental data based on the signal-noise ratio. The
signal-noise ratio (S/N) is the ratio of the mean
standard deviation which serves as an objective
function for the optimization process The
biochemical quality characteristics discussed in this
study are moisture content, caffeine, chlorogenic
acid, sucrose, and lipid in ground coffee. The quality
characteristics of the ratios used for each parameter
are described as follows:
1. Moisture content (smaller the better) which
means the smaller in moisture content value on
the test results, the better the nature of the ground
coffee produced, this determination refers to
where the maximum moisture content in coffee is
7% (The National Standardization Agency of
Indonesia, 2004), the moisture content is related
to the shelf life to prevent discoloration, mold and
the appearance of other microorganisms, so that
if the content is high, the product is easily
contaminated by microorganisms (Novita et al.,
2010).
2. Caffeine is determined (large the better), based
on states that caffeine in coffee it also as an index
of organoleptic quality and used as a
consideration to determine the mixing formula
for a recipe of ground coffee mixture (Marsilani
et al., 2020). The main role of caffeine in the
body is to increase psychomotor work so that the
body remains awake and provides a
psychological effect in the form of increased
energy (Thomas et al., 2016).
3. Chlorogenic acid is determined (larger the better)
with the consideration that chlorogenic acid is
beneficial for human health, namely as an
antioxidant, antiviral, hepatoprotective, and plays
a role in antispasmodic activities, high
chlorogenic acid in coffee can be used as a source
of therapy or drug manufacture (Farhaty &
Muchtaridi, 2014)
4. Sucrose is determined (larger the better) because
sucrose plays a role in influencing the test and
aroma of coffee so it is expected that its presence
is always high in coffee (Borem et al., 2016)
5. Lipids is determined (smaller the better) because
lipids in coffee affect the taste of coffee grounds,
an increase in free fatty acids during storage will
cause rancidity in coffee grounds so that it affect
to the taste, causing a decrease in the quality of
ground coffee (Hayati et al., 2012).
A mathematical model for the signal to noise ratio
(S/N) (Jeffrey et al., 2011):
For Smaller the better
SNR = -10 log (
∑
− 𝑦𝑖
) (1)
For Larger the better
SNR = 10 log (
∑
) (2)
where y
i
is a quality measurement; and n is the total
of the measurements.
ANOVA in Taguchi to detect differences in the
mean performance of the test groups of parts.
ANOVA can analyze the total variance into factor
variance so that it can be seen the effect of each factor
on the total variance. The use of ANOVA in the
Taguchi method is used as a statistical method to
interpret experimental data in the calculation of the
process as follows (Jeffrey et al., 2011):
1. Calculating the total sum of squares (Sstotal),
with the following formula :
Ss total=
∑
𝑦
2
(3)
Where y is the data for every replication.
2. Calculating the Sum of squares due to mean
(Ssmean)
Ssmean=𝑛.𝑦
2 (4)
Where n is total all replication.
3. Calculating the sum of square due to factors
SS
A
, SS
B,
etc), example factor A:
SSA=[ (𝐴1
)
2
𝑥𝑛1] +[(𝐴1 )
2
𝑥𝑛2]+…+
=[ (𝐴𝑖
)
2
𝑥𝑛1]-𝑠𝑠𝑚𝑒𝑎𝑛 (5)
4. Calculating the sum of square total (SST
SST= (𝑆𝑠𝑡𝑜𝑡𝑎𝑙− 𝑆𝑠𝑚𝑒𝑎𝑛) (6)
5. Calculating the sum of squares due to error
(SSe)
𝑆𝑆𝑒 = 𝑆𝑆𝑡𝑜𝑡𝑎𝑙 − 𝑆𝑆𝑚𝑒𝑎𝑛− 𝑆𝑆
A
-𝑆𝑆
B
-𝑆𝑆n (7)
6. The degrees of freedom factor (DF)
𝐷𝐹 =
(
𝑛𝑢𝑚𝑏𝑒𝑟 𝑜𝑓 𝑙𝑒𝑣𝑒𝑙𝑠 − 1
)
(8)
7. The degrees of freedom factor total (DF total)
𝐷𝐹 𝑡𝑜𝑡𝑎𝑙 =(𝑛𝑢𝑚𝑏𝑒𝑟 𝑜𝑓 𝑒𝑥𝑝𝑒𝑟𝑖𝑚𝑒𝑛𝑡 − 1) (9)
8. Calculating mean sum of squares (MS)
𝑀𝑆 =
(10)
Where MS is mean Square, DF is degrees of freedom
9. Calculating of (F-Ratio)
𝐹 𝑟𝑎𝑡𝑖𝑜 =
(11)
10. Calculating the pure sum of square (SS’) for
each factor
SS’=(𝑆𝑆 𝑓𝑎𝑐𝑡𝑜𝑟− (𝑣 𝑓𝑎𝑐𝑡𝑜𝑟 𝑥𝑀𝑆 𝑒𝑟𝑟𝑜𝑟 (12)
11. Calculating % Ratio of each factor, example
factor A:
% 𝑅𝑎𝑡𝑖𝑜 𝐴 =
(13)
ICE-TES 2021 - International Conference on Emerging Issues in Technology, Engineering, and Science
336
2.2.2 Determination of The Best Treatment
To overcome the multi-response problem in the
Taguchi method, Grey Relational Analysis (GRA)
was performed to obtain the best treatment with
several analysis steps below (Jeffrey et al., 2011):
1. Calculating the normalization of SNR value for
each response to reduce the effect of using
different units and reduce variability, the
equation is as follows:
X
i
*
(j)
=
(
)
()
(
)
()
(14)
(for signal to noise larger the better)
X
i
*
(j)
=
(
)
()
(
)
()
(15)
(For signal to noise small the better)
where xi(j) is the measurement of the quality
characteristics
2. Calculating the delta and gamma values (grey
relational coefficient) for each response. After
the deviation sequence value was obtained, put
into the formula to calculate the Grey Relational
Coefficient value. Distance measure Δ
oi
(j) was
performed which was the absolute value of the
difference between 𝑥
∗
and 𝑥
∗
on j point.
Δ
oi
(j) = ׀𝑥
∗
(
𝑗
)
− 𝑥
∗
(
𝑗
)
׀ (16)
Note:
𝑥
∗
(
𝑗
)
= 1 (highest value of SNR was inversed as
(1)
calculating grey relational coefficient γ
0i
(j), with
following equation:
γ
0i
(j) =
(
)
(17)
Note:
𝛥
= minimum value of 𝛥
(𝑗)
𝛥
= maximum value of 𝛥
(𝑗)
𝜆 = coefficient range between 0 and 1 (value
𝜆 determined by the decision-maker as he
expected, generally 𝜆 = 0,5)
3. Calculating grey relational grade which resulted
from the average of the grey relational coefficient
from the whole response
γ
i
=
∑
𝜉(𝑘) (18)
4. After obtaining the Grey Relational Grade value
for each experiment, the highest value was
determined from the response of each factor at
each level.
2.2.3 Confirm Test
The confirmatory experiment is designed to ensure
that the variables and levels chosen provide the
expected results. The confirmation test results are
declared valid or accepted if the confirmation test’s
confidence interval falls within the optimal value
interval and rejected if the confidence interval is not
within the optimal value interval. The confidence
interval was calculated using equations (Jeffrey et al.,
2011).
Optimal Condition (Taguchi Experiment)
a. Optimal Condition
𝜇𝑝𝑟𝑒𝑑𝑖ction= 𝑦̅ 𝑖𝑗𝑘𝑜𝑝𝑡𝑖𝑚𝑎𝑙− 𝑦̅ (19)
Note:
𝑦𝑖𝑗𝑘
optimal = The sum of the average value of
the optimal level
b. Calculation of Confidence Interval
𝐶𝑙𝑚𝑒𝑎𝑛 = ±
𝐹 ∝;𝑣1;𝑣2𝑥𝑀𝑆𝑒1 𝑥
(20)
𝑛𝑒𝑓𝑓=
Note:
Cl = confidence interval
𝐹∝;𝑣1;𝑣2 = F-ratio value from table
∝ = Risk, confidence level = 1 – risk
𝑣1 = Degree of freedom for the numerator
𝑣2 = Degree of freedom for the denominator
𝑀𝑆𝑒= Mean polled error sum of squares
Confirmatory Experiment
a. Calculation of Mean Value
µ=
∑
(21)
b. Calculation of confident interval
𝐶𝑙𝑚𝑒𝑎𝑛=±
𝐹 ∝;𝑣1;𝑣2𝑥𝑀𝑆𝑒1 𝑥
+
(22)
Note: r = The number of observations used to
calculate the mean
3 RESULT AND DISCUSSION
3.1 Effectiveness of Treatment on
Biochemical Characteristics
3.1.1 Moisture Content
ANOVA calculations use equations 3 to 13. In
Biochemical Characteristics of Ground Robusta Coffee under Various Postharvest Technologies and Processing Parameters
337
moisture content result presented in Table 4:
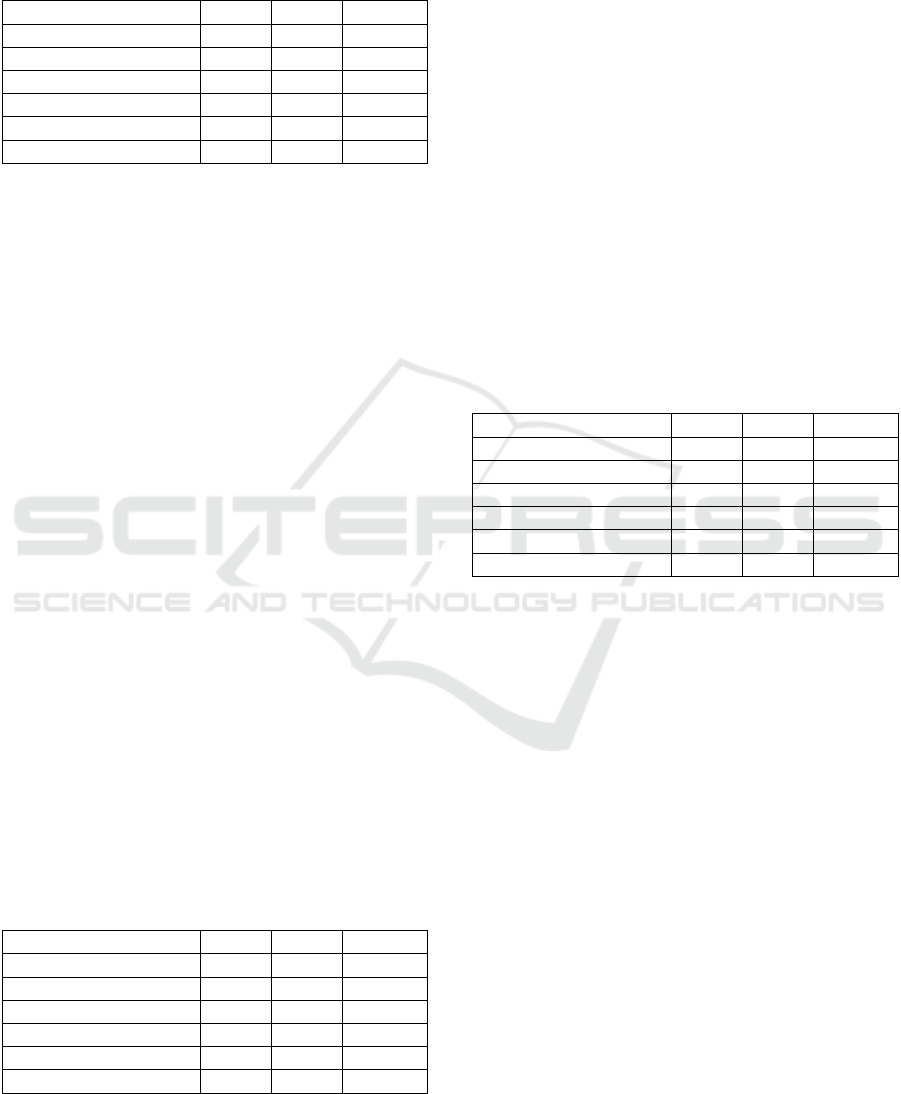
Table 4: ANOVA calculation of moisture content mean
from ground coffee.
Source F Ratio % ratio F -Table
Postharvest technolo
g
ies 2619.28 49.12 4.256
Temperature of roasting 881.0 16.51 4.256
Time of roastin
g
199.51 3.72 4.256
Millin
g
1626.19 30.49 4.256
Residual Erro
r
1 0.16 4.256
Total 100
According to ANOVA in Table 4, calculation
average of moisture content, all factors have an F-
ratio value ≥ F-Table which means that they have a
significant influence on the characteristics of the
moisture content. Postharvest technology factor is the
most influential factor on moisture content with the
largest contribution of 49.12%. Post-harvest handling
is an activity that includes all treatments from
harvesting to the production of green coffee beans
(Mayrowani, 2013). One of the causes to decrease in
moisture content is post-harvest handling and drying
of coffee beans (Novita et al., 2010). Full wash, honey
and natural processes which have different processing
stages affect the moisture content of the coffee beans,
this also affects the moisture content of the ground
coffee produced because the moisture content of the
initial coffee beans used is different. In addition, the
mill size factor also contributes greatly to the
moisture content of ground coffee, the size of the
mesh affects the resulting texture, the larger the mesh
size, the smoother the resulting material (Yulia et al.,
2018). The larger of the mesh size (the smaller the
particle size of the ground coffee), the higher the
absorbance intensity.
3.1.2 Caffeine
Table 4 shown the result of ANOVA calculations in
caffeine content.
Table 5: ANOVA calculation of caffeine mean from ground
coffee.
Source F Ratio % Ratio F-Table
Postharvest technolo
g
ies 75.50 22.04 4.256
Temperature of roasting 219.07 64.52 4.256
Time of roasting 26.00 7.40 4.256
Millin
g
12.93 3.53 4.256
Residual Erro
r
1 2.51 4.256
Total 100
According to ANOVA calculation in Table 5,
calculation average of caffeine, all factors have an F-
ratio value ≥ F-Table which means that they have a
significant influence on the characteristics of the
caffeine. Roasting temperature factor is the most
influential factor on caffeine content with the largest
contribution of 64.52%. Roasting time and higher
roasting temperature increased caffeine content due
to the breakdown of liquids and acids (Agustina et al.,
2019). Higher roasting temperature intensified the
caffeine content in the ingredients, as the amount of
liquid and acidic substances decreased, the amount of
non-liquid content such as caffeine, minerals, and
lipids increased (Wijayanti & Anggia, 2020).
3.1.3 Chlorogenic Acid
The results of the ANOVA calculations in
chlorogenic acid are presented in Table 6:
Table 6: ANOVA calculation of chlorogenic acid mean
from ground coffee.
Source F Ratio % Ratio F-Table
Postharvest technologies 370.23 60.17 4.256
Tem
p
erature of roastin
g
105.69 17.06 4.256
Time of roastin
g
15.73 2.40 4.256
Milling 117.51 18.99 4.256
Residual Erro
r
1 1.39 4.256
Total 100
In Table 6, it is known that all factors have an F-
ratio value ≥ F-Table, it means that the factors have a
significant effect on the characteristics of chlorogenic
acid. Postharvest technologies factor is the most
influential factor on the levels of chlorogenic acid
with the largest contribution of 60.17%. The
differences in the stages of processing coffee in full
wash, honey and natural processes in this study have
an effect on the content of chlorogenic acid. This is
appropriate where the biochemistry of coffee is
significantly influenced by the processing process,
such as the wet processing method causing an
increase in the content of chlorogenic acid (Duarte et
al., 2010).
3.1.4 Sucrose
The results of the ANOVA calculations of sucrose are
presented in Table 7.
ICE-TES 2021 - International Conference on Emerging Issues in Technology, Engineering, and Science
338
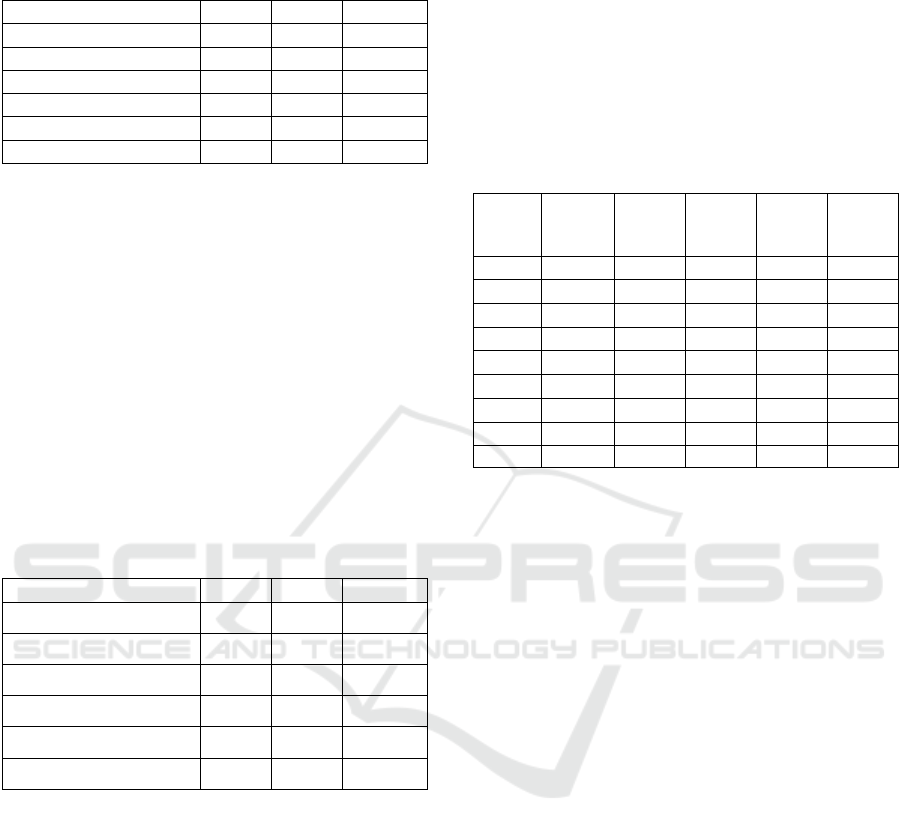
Table 7: ANOVA calculation of sucrose mean from ground
coffee.
Source F Ratio % Ratio F-Table
Postharvest technologies 1.62 5.71 4.256
Tem
p
erature of roastin
g
2.08 9.93 4.256
Time of roastin
g
2.28 11.73 4.256
Milling 0.41 -5.44 4.256
Residual Erro
r
1 78.07 4.256
Total 100
F-ratio value ≤ F-Table which means that it does
not have a significant effect on the characteristics of
sucrose. Roasting time factor donating a percentage
ratio of 11.73% and a roasting temperature of 9.93%.
Roasting time and roasting temperature cause a
decrease in the content of sucrose, amino acids,
proteins, and polysaccharides (Williamso &
Hatzakis, 2019), because roasting causes the
evaporation of some substances in the coffee beans.
3.1.5 Lipid
The results of the ANOVA calculations of lipid are
presented in Table 8.
Table 8: ANOVA calculation of lipid mean from ground
coffee.
Source F Ratio % Ratio F Table
Postharvest technologies 4580.48 37.34 4.256
Temperature of roasting 2435.06 19.85 4.256
Time of roasting 4642.02 37.85 4.256
Milling 600.66 4.89 4.256
Residual Error 1 0.07 4.256
Total 100
Table 8 shows the F ratio value ≥ F-Table, this
means that all factors have a significant effect on the
lipid of ground coffee. The roasting time factor is the
most influential factor on lipid content with the
largest contribution of 37.85%. Differences in the
coffee process result in distinct tastes, owing
primarily to differences in the chemical composition
it contains. Wet-processed coffee beans contain
higher levels of amino acids, fats, and ash, and
contain less protein and caffeine than dry-processed
coffee. Conducted a study and demonstrated that
roasting had a significant impact on coffee and on the
lipid composition of coffee beans (Williamson &
Hatzakis, 2019).
3.2 Determination of the Best
Treatment
There were 5 types of response variables in this study,
each with a different set of quality characteristics
(moisture content “small the better, caffeine “large
the better”, chlorogenic acid “large the better”,
sucrose “large the better”, and lipid “small the better).
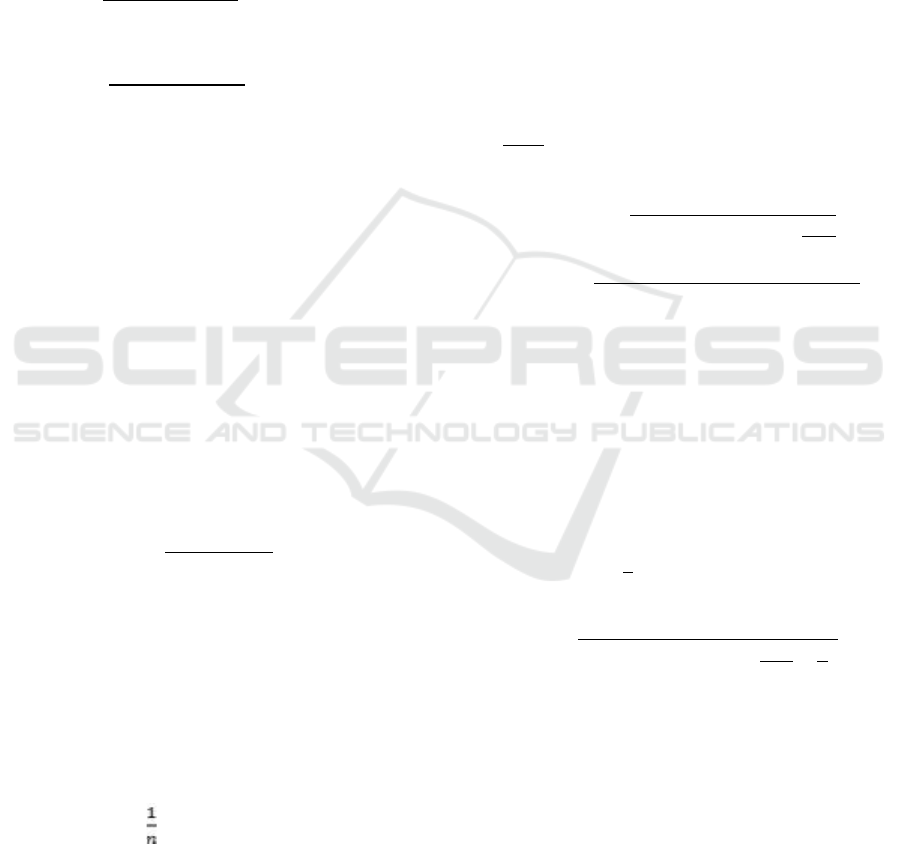
Table 9: SNR value for each response.
Experi
ment
Moisture
content
Caffeine
Chloro-
genic
aci
d
Sucrose Lipid
I -12.95 -3.54 15.32 -6.07 -20.76
II -13.06 -2.21 17.45 -3.69 -21.59
III -12.72 -1.67 13.84 -14.89 -21.06
IV -11.93 -2.62 9.11 -10.62 -20.83
V -10.38 -1.83 8.95 -20.00 -20.96
VI -11.85 -1.57 7.77 -13.55 -18.85
VII -13.94 -3.04 16.93 -13.36 -21.30
VIII -13.14 -2.73 12.79 -20.00 -21.03
IX -11.54 -2.33 9.98 -20.00 -21.27
The calculation of the SNR value for the five
responses was calculated with equation (1) and
equation (2). The result presented in Table 9: After
calculating the SNR, then the normalization of the
SNR was performed under equations (14) and (15).
The normality data of SNR is presented in Table 10.
Before performing the analysis using Grey
Relational Grade, first calculate the delta value and
gamma value of each response according to equation
(16), equation (17), and equation (18). Deviation
sequence (Delta) is presented in Table 11, meanwhile
the Grey Relational Coefficient and Grey Relational
Grade are presented in Table 12.
After obtaining the Grey Relational Grade value
for each experiment, the best treatment was
calculated as the response of each factor at each level
that produced the highest value (Table 13).
In table 13, the best treatment was obtained from
combination of the factors of A1B2C2D2 levels (full
wash postharvest technologies, roasting temperature
175 ºC, roasting time 12.5 minutes, and milling 100
mesh).
After obtaining the Grey Relational Grade value
for each experiment, the best treatment was
calculated as the response of each factor at each level
that produced the highest value (Table 13).
Biochemical Characteristics of Ground Robusta Coffee under Various Postharvest Technologies and Processing Parameters
339
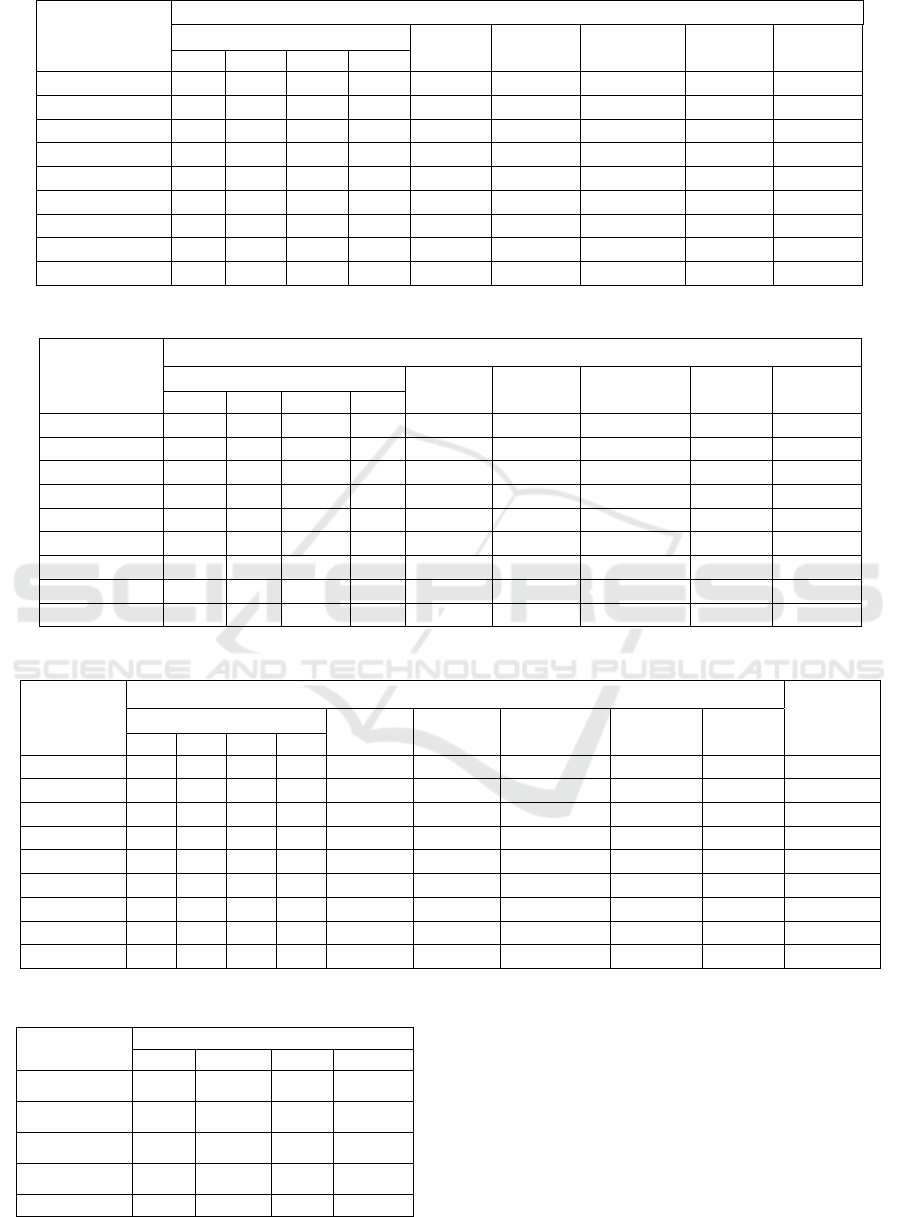
Table 10: Normality of data.
Experiment
Normality of data
Factor
Moisture
content
Caffeine
Chlorogenic
acid
Sucrose Lipid
A B C D
I 1 1 1 1 0.720 0.000 0.779 0.854 0.698
II 1 2 2 2 0.753 0.672 1.000 1.000 1.000
III 1 3 3 3 0.656 0.947 0.627 0.313 0.805
IV 2 1 2 3 0.435 0.470 0.138 0.575 0.723
V 2 2 3 1 0.000 0.867 0.122 0.000 0.771
VI 2 3 1 2 0.413 1.000 0.000 0.395 0.000
VII 3 1 3 2 1.000 0.257 0.946 0.407 0.894
VIII 3 2 1 3 0.774 0.410 0.519 0.000 0.795
IX 3 3 2 1 0.324 0.613 0.229 0.000 0.884
Table 11: Deviation sequence (Delta).
Experiment
Deviation sequence (Delta)
Factor
Moisture
content
caffeine
Chlorogenic
acid
Sucrose Lipid
A B C D
I 1 1 1 1 0.280 1.000 0.221 0.146 0.302
II 1 2 2 2 0.247 0.328 0.000 0.000 0.000
III 1 3 3 3 0.344 0.053 0.373 0.687 0.195
IV 2 1 2 3 0.565 0.530 0.862 0.425 0.277
V 2 2 3 1 1.000 0.133 0.878 1.000 0.229
VI 2 3 1 2 0.587 0.000 1.000 0.605 1.000
VII 3 1 3 2 0.000 0.743 0.054 0.593 0.106
VIII 3 2 1 3 0.226 0.590 0.481 1.000 0.205
IX 3 3 2 1 0.676 0.387 0.771 1.000 0.116
Table 12: Grey Relational Coefficient and Grey Relational Grade.
Experimen
t
Grey Relational Coefficient
Grey
Relational
Grade
Factor
Moisture
content
Caffeine
Chlorogenic
acid
Sucrose Lipid
A B C D
I 1 1 1 1 0.641 0.333 0.694 0.775 0.623 0.613
II 1 2 2 2 0.669 0.604 1.000 1.000 1.000 0.855
III 1 3 3 3 0.592 0.904 0.572 0.421 0.720 0.642
IV 2 1 2 3 0.469 0.485 0.367 0.541 0.643 0.501
V 2 2 3 1 0.333 0.790 0.363 0.333 0.686 0.501
VI 2 3 1 2 0.460 1.000 0.333 0.453 0.333 0.516
VII 3 1 3 2 1.000 0.402 0.903 0.458 0.825 0.717
VIII 3 2 1 3 0.689 0.459 0.510 0.333 0.709 0.540
IX 3 3 2 1 0.425 0.564 0.393 0.333 0.812 0.506
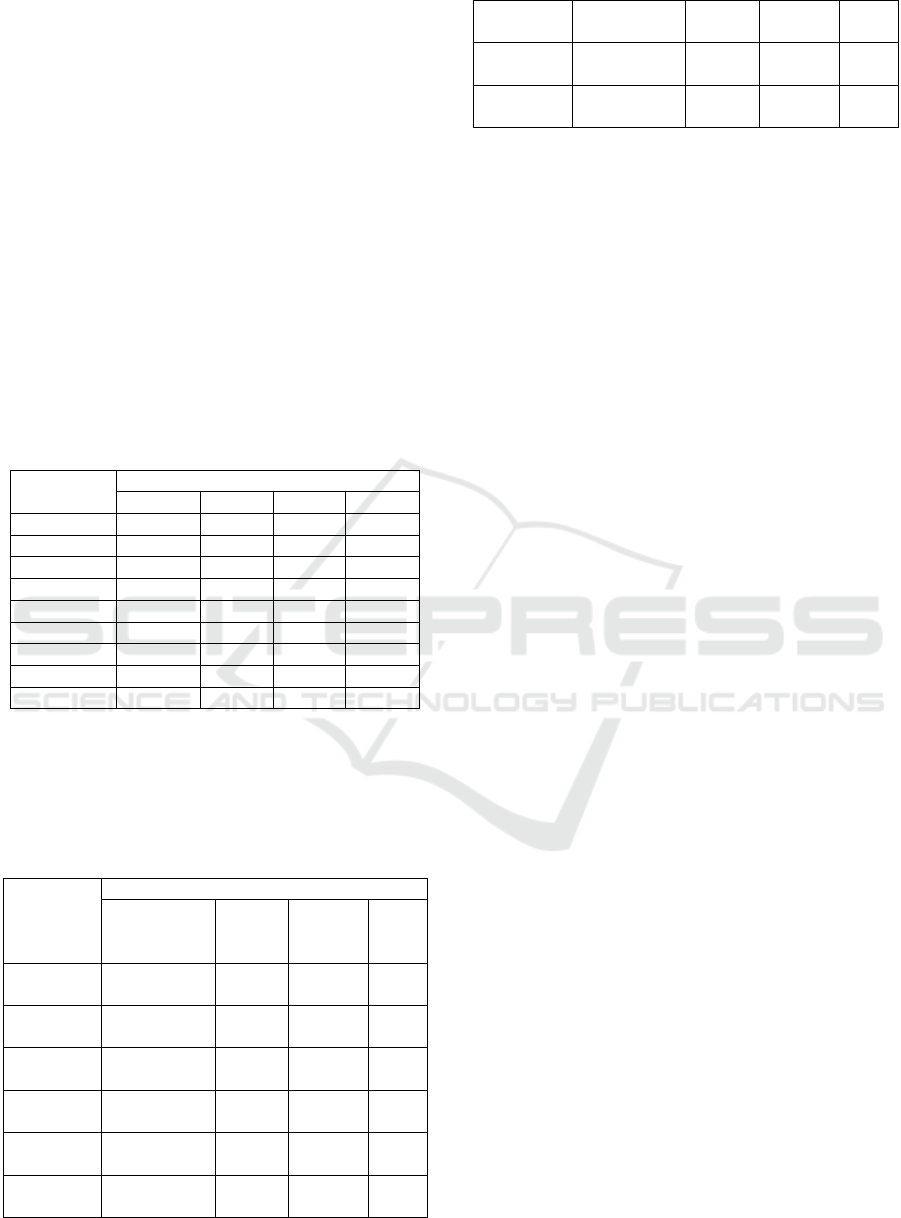
Table 13: The response of each factor at each level.
Level
Facto
r
A B C D
1 0.703 0.611 0.556 0.540
2 0.506 0.632 0.621 0.696
3 0.588 0.554 0.620 0.561
Delta 0.197 0.077 0.064 0.156
Ran
k
1 3 4 2
In table 13, the best treatment was obtained from
combination of the factors of A1B2C2D2 levels (full
wash postharvest technologies, roasting temperature
175 ºC, roasting time 12.5 minutes, and milling 100
mesh).
3.3 Confirm Test
Confirmation is done by comparing the actual value
ICE-TES 2021 - International Conference on Emerging Issues in Technology, Engineering, and Science
340
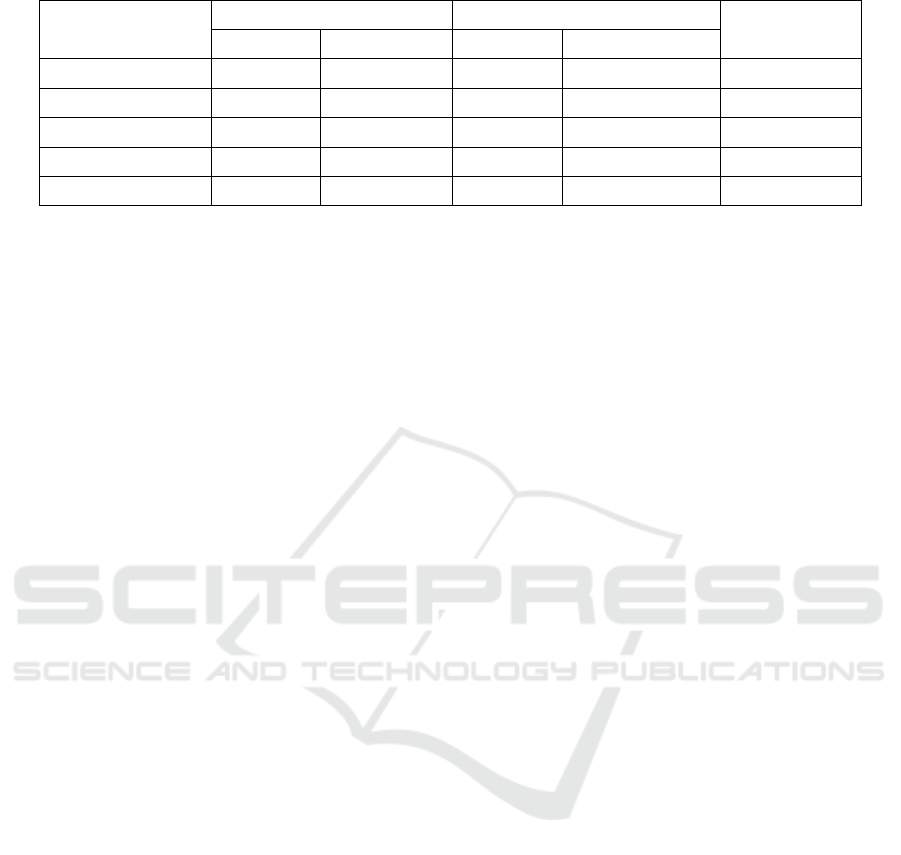
Table 14: Comparison experiment result confident intervals.
Response
Taguchi experiment Confirmatory experiment
Note
Prediction Optimization Prediction Optimization
Moisture content 3.37 3.37±0.2745 3.21 3.21±0.3783 Confirmed
Caffeine 0.84 0.84±0.0249 0.81 0.81±0.0343 Confirmed
Chlorogenic acid 7.19 7.19±1.0444 8.1 8.1±1.4395 Confirmed
Sucrose 0.75 0.75±0.3494 2.58 2.58±0.4815 Confirmed
Lipid 9.56 9.56±0.5599 8.5 8.5±0.7717 Confirmed
with the prediction interval so that the upper and
lower limits can be known. The treatment is said to
be confirmed if the actual value is in the predicted
value interval. The confidence interval was calculated
using equations (19) to (22). Table 14 comparison
experiment result in confidents intervals. The
decision on whether the optimal condition can be
accepted or not is to compare the mean value of the
prediction on Taguchi and the results of the
confirmation experiment with each level of
confidence. If the confidence interval of the
confirmation experiment is within the confidence
interval of the Taguchi experiment, then the decision
is accepted and confirmed even though not all are
vulnerable. In Table 14, biochemical characteristic in
confirmatory experiment is confirmed because the
result better than Taguchi experiments.
The best combination of factors and levels in this
study was the treatment with full wash postharvest
technology, temperature 175ºC, roasting time 12.5
minutes and milling 100 mesh, with moisture content
values (3.21%), caffeine (0.81%), chlorogenic acid
(8.1%), sucrose (2.58%), and lipid (8.5%). Research
related to the effect of postharvest handling on
chlorogenic acid and caffeine content shows that in
wet processing is greater than that of semi-wet and
dry processing (Kassaye et al., 2019). Similarly with
this study, to get a good chlorogenic acid and
caffeine, proper postharvest technology was the full
wash method.
The interaction between temperature and roasting
time has a significant effect on parameters, such as
moisture content, ash content, caffeine content,
antioxidant activity, yield (Saloko et al., 2019). At
different temperatures, the moisture content tends to
fluctuate, the longer the roasting time, the higher the
evaporated water. A roasting temperature of 190ºC
and a time of 10 minutes is the best combination of
treatments, if the temperature and roasting time
exceed it will cause a decrease in the quality of the
ash and caffeine content (Thomas et al., 2016).
Similarly with this study the combination of
postharvest technology full wash, temperature 175ºC,
time 12.5 minutes, and milling 100 mesh, interact
with each other to produce the best moisture and
caffeine content.
Chlorogenic acid will be degraded higher with a
long time and high temperature. The temperature of
225ºC for 19 minutes chlorogenic acid degraded up
to 85% (Diviš et al., 2019). The roasting process
produces melanoidin and aroma compounds while
reducing other important ingredients such as sucrose,
protein, amino acids, fatty acids, chlorogenic acids,
and polysaccharides. Only caffeine is relatively stable
during roasting because it is stable to heat (Wang &
Lim, 2015). Controlling the temperature and roasting
time at 175ºC and 12.5 minutes in this study caused
biochemical parameters such as caffeine, chlorogenic
acid, sucrose, and lipid to be in the best position.
Roasting conditions such as roasting degree affect
the antioxidants in coffee. During roasting, low water
activity and high temperature support the
development of the Maillard reaction, so that
phenolic compounds also participate in this reaction
which become part of melanoidin, can maintain or
increase antioxidant compounds, but with increasing
roasting activity will cause greater damage than
phenolic compounds. So that coffee that comes from
light roasting shows a greater antioxidant capacity
(Vignoli et al., 2014). The combination of treatment
with full wash postharvest technology, roasting
temperature of 175C, time of 12.5 minutes, and
milling 100 mesh, this find out light roasting product
so caused the best in biochemical characteristic.
4 CONCLUSIONS
The effectiveness of treatment has a significant
difference from each treatment for the parameters of
moisture, caffeine, chlorogenic acid, and lipid content
because value F-Ratio ≥ F-Table, but not significantly
Biochemical Characteristics of Ground Robusta Coffee under Various Postharvest Technologies and Processing Parameters
341

different for the mean on the sucrose parameter.
The best treatment was the combination of full
wash postharvest technologies, roasting temperature
175 ºC, roasting time 12.5 minutes, and milling mesh
100 which resulted in moisture content (3.21%),
caffeine (0.81%), chlorogenic acid (8.1%), sucrose
(2.58%), and lipid (8.5%). All these results were
confirmed through a confirmatory experiment.
ACKNOWLEDGMENTS
This research project is supported by the Final Project
Recognition (RTA) 2020, the Directorate of research,
Universitas Gadjah Mada.
REFERENCES
Agustina, R., Nurba, D., Antono, W., & Septiana, R.
(2019). Effect of Temperature and Roasting Time on
Physical-Chemical Properties of Arabica Coffee and
Robusta Coffee. Proceedings of the National Seminar,
53(9), 1689–1699.
Ameyu, M. A. (2016). ‘Physical Quality Analysis of
Roasted Arabica Coffee Beans Subjected to Different
Harvesting and Postharvest Processing Methods in
Eastern Ethiopia’.Journal of Food Science and Quality
Management. 57(1), 2224–6088.
The National Standardization Agency of Indonesia. (2004).
Ground coffee SNI 01-3542-2004. Jakarta, Indonesia.
Bladyka, E. (2016). ‘Coffee Brewing -Wetting, Hydrolysis
& Extraction’. Specialty Coffee Association of America,
1–6
Borém, F.M., Figueiredo, L.P., Ribeiro, F.C, Taveira ,J. H.
S., Giomo, G. S., & Salva, T. J. G. (2016). ‘The
Relationship between Organic Acids, Sucrose and the
Quality of Specialty Coffees’. African J. Agric. 11,
709–17.
Directorate General of Estate Crops. (2018). Tree Crop
Estate Statistics Of Indonesia 2017-2019 Coffee.
Directorate General of Estate Crops, 96.
Diviš, P., Pořízka, J., & Kříkala, J. (2019). ‘The effect of
coffee beans roasting on its chemical composition’.
Potravinarstvo Slovak J. of Food Sci. 13(1), 344–350
Duarte, G. S., Pereira, A. A., & Farah, A. (2010).
‘Chlorogenic acids and other relevant compounds in
Brazilian coffees processed by semi-dry and wet post-
harvesting methods’. Elsevier ltd J. Food Chemistry.
118(3), 851–855
Farah, A. (2012). Coffee: Emerging Health Effects and
Disease Prevention. First Edition. Inc and Institute of
Food Technologists (USA): Wiley Blackwell
Publishing Ltd;
Farhaty, N., & Muchtaridi. (2014).’Overview of Chemical
and Pharmacological Aspects of Chlorogenic Acid
Compounds in Coffee Beans’. Reviews. Supplement
Pharmacy, 14(1), 214–227.
Fisdiana, U., & Fitriyadi, E. M. (2018). ‘Effect of Roasting
Time on Moisture Content, Yield and Color of Robusta
Coffee Beans (Coffea canephora var. robusta ex
Frochner’. Agropross. 80(10), 22–24.
Hayati, R., Marliah, A., & Rosita, F. (2012). ‘Chemical
Characteristics and Sensory Evaluation of Arabica
Coffee Powder’. J Floratek. 7, 66–75.
ICO. (2019) Total Production by all exporting countries.
Retrieved from http:www.ico.org/prices/po-producti
on.pdf
Jeffrey Kuo, C. F., Su, T. L., Jhang, P. R., Huang, C. Y., &
Chiu, C. H. (2011). ‘Using the Taguchi method and
grey relational analysis to optimize the flat-plate
collector process with multiple quality characteristics in
solar energy collector manufacturing’. Elsevier Ltd J.
Energy, 36(5), 3554–3562.
Kassaye, T., Desalegn, A., Derbew, B., & Pascal, B. (2019).
‘Biochemical composition of Ethiopian coffees (Coffea
arabica L.) as influenced by variety and postharvest
processing methods’. African Journal of Food Science,
13(2), 48–56.
Marsilani, O. N., Wagiman, & Sukartiko, A. C. (2020).
‘Chemical profiling of western Indonesian single origin
robusta coffee’. IOP Conference Series: Earth and
Environmental Science. 425(1).
Mayrowani, H. (2013). Policies on Coffee Post-Harvest
Technology Development and Its Development Issues.
Forum Penelitian Agro Ekonomi, 31(1), 31–50.
Mulato, S. (2019). Physical and Chemical Changes of
Coffee Beans During Roasting.https://www.cctcid.
com/2019/07/22/.
Novita, E., Syarief, R., Noor, E., & Mulato, S. (2010).
‘Smallholder Coffee Bean Quality Improvement with
Semi Wet Processing based on Clean Production’.
Agrotek, 4(1), 76–90.
Richard, K. K., Beatrice, M., & Patrick, M. (2020). ‘Effects
of processing methods on fatty acid profiles and
biochemical compounds of Arabica coffee cultivars’.
African Journal of Food Science, 14(4), 92–97.
Roy, R. K. (2010). A Primer on the Taguchi Method.
Second Edition. Dearborn, Michigan.
Saloko, S., Sulastri, Y., Murad, & Rinjani, M. A. (2019).
‘The effects of temperature and roasting time on the
quality of ground Robusta coffee (Coffea robusta) using
Gene Café roaster’. AIP Conference Proceedings, 2199
(April 2020).
Sidi, P., & Wahyudi, M. (2013).’Taguchi Method
Application to Find Out Roundness Optimization In
Lathe Process’. Mechanical Engineering. 4(2), 101-108.
Tawali, A. B., Abdullah, N., & Wiranata, B. S. (2018). The
‘Influence of Fermentation Using Bacteria Lactic Acid
Yoghurt to the Flavor of Coffe Robusta (Coffea
robusta)’. Canrea J. Food Technology, Nutrition, and
Culinary, 90–97.
Thomas Edvan, B., Edison, R., Made Same, D., S. (2016).
‘The Effect of Temperature and Roasting Time on the
Quality of Robusta Coffee [Coffea robusta]’. Journal of
Plantation Agro Industry.. 4(1), 31–40.
ICE-TES 2021 - International Conference on Emerging Issues in Technology, Engineering, and Science
342

Toledo, P. R. A. B., Pezza, L., Pezza, H. R., & Toci, A. T.
(2016). ‘Relationship Between the Different Aspects
Related to Coffee Quality and Their Volatile
Compounds’. Comprehensive Reviews in Food Science
and Food Safety. 15(4), 705–719.
Vignoli, J. A., Viegas, M. C., Bassoli, D. G., & Benassi, M.
de T. (2014). ‘Roasting process affects differently the
bioactive compounds and the antioxidant activity of
arabica and robusta coffees’. Food Research
International. 61, 279–285.
Wang, H. Y., Qian, H., & Yao, W. R. (2011). ‘Melanoidins
produced by the Maillard reaction: Structure and
biological activity’. Elsevier Ltd. Food Chemistry,
128(3), 573–584.
Wang, X., & Lim, L. T. (2015). ‘Physicochemical
Characteristics of Roasted Coffee’. Coffee in Health
and Disease Prevention, 247–254.
Wei, F., & Tanokura, M. (2015). Chapter 10 - Chemical
Changes in the Components of Coffee Beans during
Roasting. In V. R. Preedy (Ed.), Coffee in Health and
Disease Prevention (pp. 83–91). Academic Press.
https://doi.org/https://doi.org/10.1016/B978-0-12-
409517-5.00010-3
Wijayanti, R., & Anggia, M. (2020). ‘Analysis of Cafein,
Antioxidant and Quality level of Coffee Powder of
Some Small and Medium Industries (SMI) in The
Tanah Datar Regency’. Journal of Agricultural
Technology & Industry. 25(1). 1–6.
Williamson, K., & Hatzakis, E. (2019).’Evaluating the
effect of roasting on coffee lipids using a hybrid
targeted-untargeted NMR approach in combination
with MRI’. Elsevier Ltd Food Chemistry. 299(7),
125039.
Yüksel, A. N., Özkara Barut, K. T., & Bayram, M. (2020).
‘The effects of roasting, milling, brewing and storage
processes on the physicochemical properties of Turkish
coffee’. LWT-Food science and Technology.131(6), 1–8.
Yulia, M., Asnaning, A. R., & Suhandy, D. (2018). ‘The
Influence of Particle Size of Ground Roasted Coffee in
Discrimination of Decaffeinated Coffee Using
Ultraviolet-Visible Spectroscopy and PLS-DA
Method’. Journal of Applied Agricultural Research.
18(1), 46–51.
Biochemical Characteristics of Ground Robusta Coffee under Various Postharvest Technologies and Processing Parameters
343
