Measuring Ease of Use Aspects of Shopee Usage Behavior during
Pandemic using PLS-SEM Approach
Michael Christian
a
, Lasmery R. M. Girsang
b
and Henilia Yulita
c
Faculty of Social and Humanities, Universitas Bunda Mulia, Jl. Lodan Raya No. 2 Ancol, Jakarta, Indonesia
Keywords: Attitude, Ease of Use, e-Commerce.
Abstract: The emergence of various types and brands of e-commerce which is also followed by intense competition has
made Indonesia one of the countries with the most attractive e-commerce market globally. To become a
market leader like Shopee needs skills to analyse the complexity and unpredictability of young users' behavior.
Studies have revealed that the ease of e-commerce platforms provides user satisfaction, although some explain
the opposite since users are increasingly technology literate. This study aims to explain the behavior of e-
commerce users (Attitude towards using and Actual system usage) as measured by the Perceived ease of use.
The fussiness of young users especially in big cities like Jakarta underlies the sample of this study. Since the
population size is unknown, this study uses 100 samples by multiplying the number of indicators which are
then collected randomly. The PLS-SEM approach was used as an analytical tool. This study reveals that the
ease-of-use factor significantly still affects usage behavior which then affects further decision-making. The
tastes of young consumers that tend to change rapidly, supported by technological developments and the
online community determine purchase intentions. Therefore, this factor is worthy enough to be a suggestion
for further research.
1 INTRODUCTION
The competitive map of e-commerce in recent years
shows an interesting position. Based on research data
published by iPrice, e-commerce competition in the
first two quarters of this year compared to last year's
period as in table 1 shows an interesting change in
position from various aspects such as web visitors,
ranking on the AppStore, Play Store, and the number
of followers in the media. social. In the first and
second quarter of last year, Tokopedia was in the top
position compared to its competitors Shopee. Over
time with the strategies implemented by each e-
commerce, Shopee managed to shift Tokopedia's
"strength" to the top during the first two quarters of
this year.
The data in the table above shows that Shopee has
a strong strategy to form communities on several
social media while simultaneously increasing and
maintaining the number of app downloads, although
from the aspect of web visitors it is still not as high as
a
https://orcid.org/0000-0001-8892-5400
b
https://orcid.org/0000-0003-4149-4409
c
https://orcid.org/0000-0002-3782-2273
Tokopedia's achievement in the same period. As a
new player in the world of e-commerce, Shopee based
on these data also shows the importance of rapid
awareness of Shopee's presence for the public and an
online value proposition with strong differentiation
compared to its competitors. In addition, it can also
be explained that Shopee emphasizes the strategy of
using applications rather than the web. Shopee views
the mobility and users of the technology-literate young
generation as important. Socialization strategies, for
example in the form of advertisements, can create
awareness for users (Indriyarti & Christian, 2020).
Several studies have explained that there is a
connection between existing system experiences
(actual system usage). Actual use can be
characterized by an individual's readiness to use a
system (Rauniar, Rawski, Yang, & Johnson, 2014).
The actual use that is part of the Technology
Acceptance Model (TAM) is determined by the
factors of benefit and ease of use (Jongchul & Sung-
Joon, 2014).
192
Christian, M., Girsang, L. and Yulita, H.
Measuring Ease of Use Aspects of Shopee Usage Behavior during Pandemic using PLS-SEM Approach.
DOI: 10.5220/0010750000003112
In Proceedings of the 1st International Conference on Emerging Issues in Humanity Studies and Social Sciences (ICE-HUMS 2021), pages 192-197
ISBN: 978-989-758-604-0
Copyright
c
2022 by SCITEPRESS – Science and Technology Publications, Lda. All rights reserved
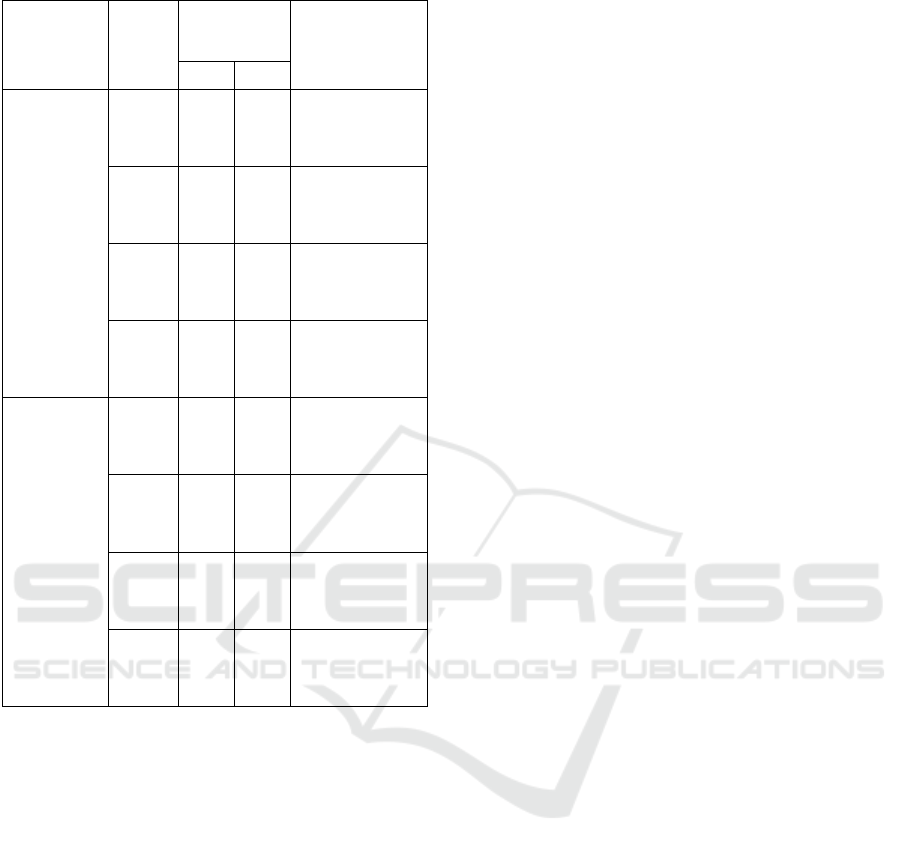
Table 1: e-Commerce Competition in Indonesia.
e-Commerce Period
Position on
the App Store
Number of
Followers on
social media
iOS PS
Tokopedia
Q1
2019
2 2
TW=192.100
IG=1.148.500
FB=6.049.900
Q1
2020
2 3
TW=387.800
IG=1.672.100
FB=6.378.200
Q2
2019
2 2
TW=205.070
IG=1.263.800
FB=6.135.250
Q2
2020
2 3
TW=445.100
IG=1.780.500
FB=6.377.800
Shopee
Q1
2019
1 1
TW=69.300
IG=2.164.100
FB=14.409.600
Q1
2020
1 1
TW=210.300
IG=4.215.000
FB=16.793.400
Q2
2019
1 1
TW=85.440
IG=2.616.800
FB=14.804.290
Q2
2020
1 1
TW=320.800
IG=4.851.200
FB=17.841.400
TW=Twitter; IG=Instagram; FB=Facebook; Q=Quarter; PS=Play Store
The TAM concept itself has been widely used in
various aspects of technology adoption, including one
in the culinary business (Christian, 2019a). This is
because this concept is useful for organizations to
understand the adoption of a technology (Jokonya,
2015).
Behavior in use is affected by the ease of using an
existing technology (Mustafa, Harun, & Endin,
2014). Likewise with research conducted by Teo &
Noyes (2011) explained that in the field of education,
the behavior of teachers in using technology if the
factor of ease of using the technology is formed.
Learning systems that tend to use technology often
emphasize that the ease of use factor affects student
behavior at the National Taiwan University of
Science (NTUST) in using the Blackboard Learning
System (Lin, Persada, & Nadlifatin, 2014). The same
thing is in the case of the International Education
College campus management information system
emphasizing that the attitude to use is formed from
the ease of using a system called the Campus
Management System (Shaffiei, Mokhsin, Hamidi, &
Yusof, 2011).
Various aspects can form a factor of ease of use
that allows individuals to continue to use the
technology. This explains that one can determine
behavior by the ease-of-use factor. This is in line with
research on student behavior in Southern Thailand in
using Facebook which is affected by the ease of use
as social media (Teo & Jarupunphol, 2015). In other
matters, such as the use of internet banking, it also
explains that the desire to use internet banking for
users in Curitiba, South Brazil is affected by the ease
of use factor (Pires, Costa Filho, & Cunha, 2011).
Other fields such as food, convenience factor also
affect the behavior of using QR Codes in a food
tracking system (Kim & Woo, 2016). Even in a larger
scope, the ease of use factor has a significant effect
on the use of e-government services for the public in
Abu Dhabi (Dahi & Ezziane, 2015). Things like user-
friendly design and use can make up the convenience
factor (Huang, Ho, Liu, & Lin, 2015). The same thing
is also explained that online purchases using e-
commerce are affected by this factor (Hajiha,
Shahriari, & Vakilian, 2014).
The factor of ease of use of technology can affect
individual satisfaction in using this technology (Xu &
Gan, 2010), although these results are still
contradictory to other studies. Using an e-learning
system with a blackboard system, student satisfaction
in the United Arab Emirates (UAE) is not determined
by the ease of use factor (Al-hawari & Mouakket,
2010). This allows the must factor using the system
in learning. This result is also directly proportional to
research in the hospitality aspect where the desire to
book hotels online for business travelers is not
affected by comments that are easily searched for as
reviews (Memarzadeh, Blum, & Adams, 2016).
However, there are still several studies that state that
the use of a form of technology is not affected by the
ease of use (Yadav, Sharma, & Tarhini, 2016);
Chong, 2013; Lee, Park, Chung, & Blakeney, 2011).
Based on the explanation presented, the hypothesis in
this study is as follows:
Hypothesis 1: Ease of Use Factors Affect User Behavior
The usage attitude factor affects the desire to make
online purchases using e-commerce (Hajiha et al.,
2014). The results of this study are inversely
proportional to research conducted by Teo &
Jarupunphol, (2015) which explains that in the use of
social media such as Facebook, actual use is not
affected by student behavior as users. This can
Measuring Ease of Use Aspects of Shopee Usage Behavior during Pandemic using PLS-SEM Approach
193

explain that social media factors that are commonly
used or that have been widely used do not
significantly affect their actual use. This also means
that new technologies that have not been wide will
provide a certain level of difficulty in their use. The
contradictory results are also explained by Tyas &
Darma, (2017) where technology adoption is not
affected by the attitude of its use. Behavior in use can
provide good or not assessment results (Huang et al.,
2015; Kanchanatanee, Suwanno, & Jarernvongrayab,
2014). Based on these explanations, the hypothesis in
this study is as follows:
Hypothesis 2: Usage Behavior Factors Affect Actual Use
The originality of this research lies in the use of two
variables of consumer behavior, namely the behavior
in shaping the desire for decision making and the
actual behavior that is taken in the decision. This is
important in analysing actions of desire and actions
of use, especially in using Shopee as one of the e-
commerce media in Indonesia. Online purchasing is
an interesting thing to study in line with the fast-
changing consumer tastes and the dynamic
competition in this sector. In addition, conditions
such as during the Covid-19 pandemic will allow it to
provide a different picture of consumer behavior
compared to conditions before the pandemic.
2 METHODS AND MATERIALS
This quantitative research uses Structural Equation
Modeling (SEM) - Partial Least Square (PLS) using
SMART PLS 3.0. PLS-SEM can explain the analysis
of structural models that are causal effects (Al Idrus,
Ahmar, & Abdussakir, 2018; Christian et al., 2021)
with a relatively small number of samples (Wong,
2013). Based on data from iPrice Insight (iPrice,
2021), the number of Shopee web visitors in
Indonesia until 2020 was 129,320,800 visitors.
However, there is no valid and specific publication
about the number of young Shopee users in Jakarta.
Since the population in this study (the number of
young Shopee users in Jakarta) is unknown, this study
uses the approach popularized by Hair, Black, Babin,
& Anderson, (2014) where the number of samples
from an unknown population can be determined by
multiplying the number of indicators (14 items) by 5
to 10. Based on this, the sample of this study is 100
Shopee users (who purchased in the last 1 year) in
Jakarta as research samples were collected randomly.
This study used a questionnaire instrument with a
range of 5 Likert scales (1=very disagree to 5=very
agree) with several tests, namely validity, reliability,
determination, and hypothesis testing for data
analysis.
The indicators in this study adapt the
measurements made by Kim & Woo (2016), Teo &
Jarupunphol (2015), Yadav et al., (2016), and Chong,
(2013). Indicators on the Actual System Usage
variable make purchases in this marketplace, buy in
the marketplace even though it is not a priority, open
this marketplace website/application every day and at
leisure, give satisfaction in making purchases.
Furthermore, the indicators on Attitude Towards
Using consist of being happy with this marketplace,
providing comfort when buying in this marketplace,
providing value for the products provided. The
Perceived Ease of Use variable consists of indicators
of easy access, ease of purchase, a layout that is easy
to understand, ease of features available, can solve
user problems in searching for products, ease of
customer service.
3 RESULTS AND DISCUSSION
Respondents in this study consisted of 57 men (57%)
and 43 women (43%). These results explain that the
respondents in this study were dominated by male
respondents. The initial testing process generates
numbers to determine whether the existing construct
is valid or not. In the Perceived Ease of Use variable,
of the four items, there are two items (PU5=0,197 and
PU6 = 0,110) that have a number below 0,7 which
means they do not meet the requirements (>0,70) so
these two items must be eliminated. Furthermore, in
the Actual System Usage variable of five items, there
is one item (ACT2=0,676) which is below 0,7, so this
item must also be eliminated because it does not meet
the specified conditions. After the elimination
process on items that do not meet the requirements, a
retest process is carried out to determine validity and
reliability. Based on the results in Figure 1 which
shows the discriminant validity test, where the
numbers on all items are above 0,70, which means
that all items are valid (valid). In the Perceived Ease
of Use variable, there are four items with all numbers
above 0,70, namely PU1=0,811; PU2=0,792;
PU3=0,799 and PU4=0,804. The next variable,
namely Attitude Towards Using, consists of three
items whose scores are also above 0,70
(ATT1=0,907; ATT2=0,908; ATT3=0,885). The last
variable, namely Actual System Usage, consists of
four items (ACT1=0,808; ACT3=0,829;
ACT4=0,870; ACT5=0,879), all of which are above
0,70.
ICE-HUMS 2021 - International Conference on Emerging Issues in Humanity Studies and Social Sciences
194
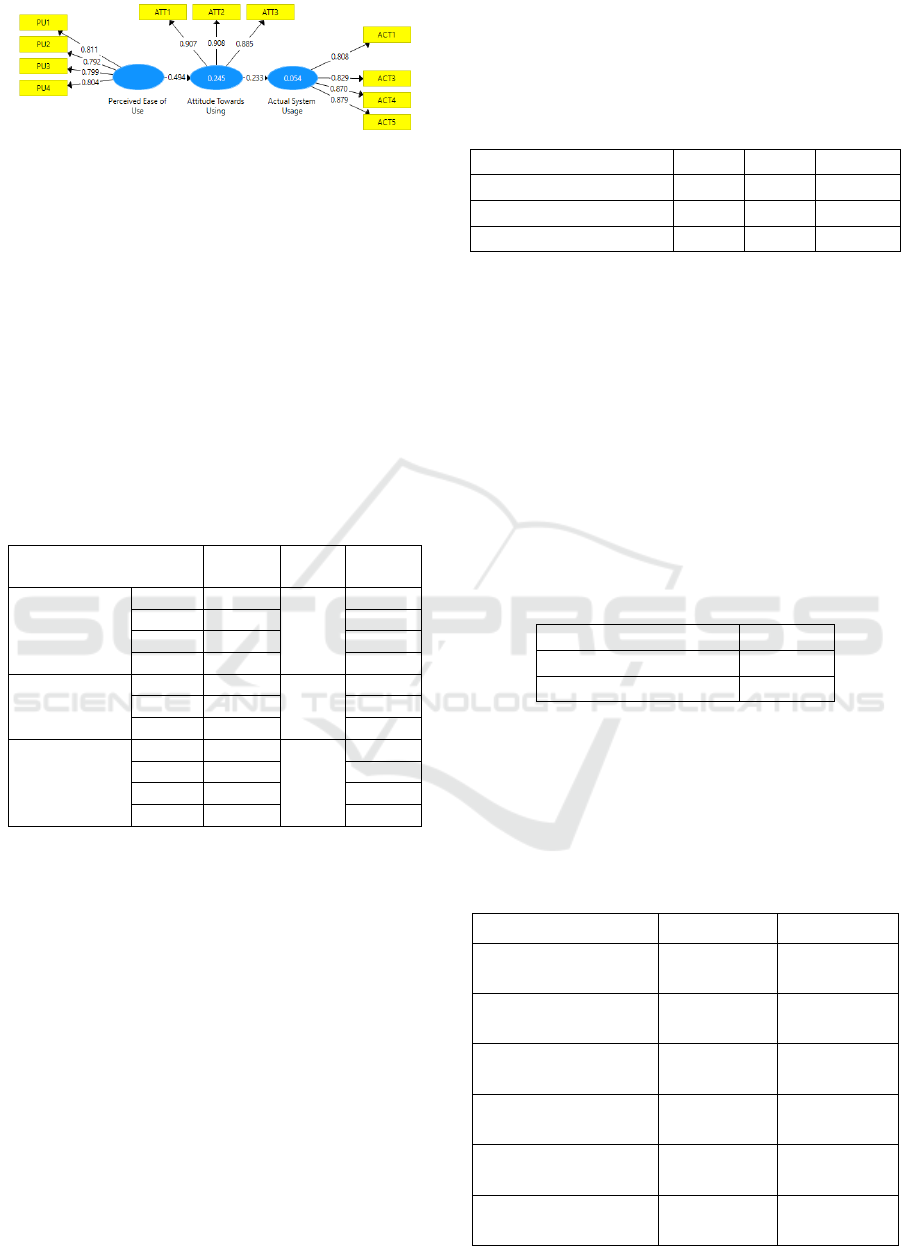
Figure 1: Outer Loading.
Average Extracted Variance (AVE) in table 2
explains the convergent validity where the numbers
on all items are above 0,5 so that from these results it
can be explained that the average value of the
extracted variance on the indicators can represent the
variables used. In the Perceived Ease of Use, the
number on the AVE is 0,642 or above 0,5 so it can be
said that the Perceived Ease of Use variable is valid.
The next variable is Attitude Towards Using, where
the number on the AVE shows 0,810 which means
that this variable is valid. The next variable, namely
Actual System Usage, shows 0,718 or is above 0,5
and explains that this variable is valid.
Table 2: Validity Test.
Variable/Item Outer
loading
AVE Results
Perceived
Ease of Use
PU1 0,811
0,642
valid
PU2 0,792 valid
PU3 0,799 valid
PU4 0,804 valid
Attitude
Towards Using
ATT1 0,907
0,810
valid
ATT2 0,908 valid
ATT3 0,885 valid
Actual System
Usage
ACT1 0,808
0,718
valid
ACT3 0,829 valid
ACT4 0,870 valid
ACT5 0,879 valid
The reliability test can be seen in table 3 which
consists of the results of Composite Reliability (CR)
and Cronbach's alpha (CA). The variable Perceived
Ease of Use shows 0,878 which is above 0,7 which is
the number of reliability requirements on CR. Based
on these results it can be explained that this variable
is reliable. The next variable, namely Attitude
Towards Using, also shows a number above 0,7
which is 0,928. These results explain that this variable
is reliable. The last variable, namely Actual System
Usage, has a result of 0,910 which is above 0,7 which
explains that this variable is reliable. In the results
section of Cronbach's Alpha, the Perceived Ease of
Use variable shows 0,836 or above 0,7 so it can be
explained that this variable is also variable. In the
Attitude Towards Using variable, the results show
0,883 (>0,7) which explains that this variable is
reliable. The third variable, namely Actual System
Usage, shows the number on CA of 0,872 (> 0,7) also
explains that this variable is reliable. Based on all the
results that have been presented, it can be explained
that all variables in this study are reliable.
Table 3: Reliability Test.
Variable CR CA Results
Perceived Ease of Use 0,878 0,836 reliable
Attitude Towards Using 0,928 0,883 reliable
Actual System Usage 0,910 0,872 reliable
The R-Square results in table 4 explain the
evaluation of the structural model in this study. Based
on the results on the R-Square, it can be explained that
the number in the Attitude Towards Using variable
which is 0,054 means that this variable is affected by
the independent variable, namely Perceived Ease of
Use of 5,4% so that other independent variables can
affect by 94,6%. The next variable, namely Actual
System Usage, shows an R-Square number of 0,245
which means that this variable is affected by the
Attitude Towards Using variable of 24,5% where
there are 75,5% of other independent variables that
are not used in this study.
Table 4: R-square.
Variable R-square
Attitude Towards Using 0,054
Actual System Usage 0,245
The Total Effect results in table 5 show the t-
statistic number of Perceived Ease of Use to Attitude
Towards Using of 7,685 or greater than 1,96 with the
original sample result of 0,494. In the results of the p-
value, the number on Perceived Ease of Use to
Attitude Towards Using is 0,000 or less than 0,05.
Table 5: Total Effect.
Path Total effect Results
Perceived ease of use -
Attitude Towards Using
Original
sample= 0,494
(+)
Attitude Towards Using
- Actual System Usage
Original
sample= 0,233
(+)
Perceived ease of use -
Attitude Towards Using
t-statistic =
7,685
>1,96 (accept
hypothesis 1)
Attitude Towards Using
- Actual System Usage
t-statistic =
2,538
>1,96 (accept
hypothesis 2)
Perceived ease of use -
Attitude Towards Using
p-value =
0,000
<0,005 (accept
hypothesis 1)
Attitude Towards Using
- Actual System Usage
p-value =
0,001
<0,005 (accept
hypothesis 2)
Measuring Ease of Use Aspects of Shopee Usage Behavior during Pandemic using PLS-SEM Approach
195

Based on these results, it can be explained that
Attitude Towards Using is affected by Perceived
Ease of Use so that it is also explained that
Hypothesis 1 is accepted. The many features and
product variants available at Shopee should be
followed by ease of use. This also means that the
functional factors in the embedded technology must
also support the aspects of effectiveness and
efficiency (Christian, 2018). The variety and
complexity of the arrangement of features/products
on Shopee's display must be considered so as not to
cause confusion or dislike of their use. New users or
users who are not accustomed to using Shopee must
also be considered from the complexity and
complexity of using existing features so as not to
cause stress when using it as a form of technology
(Christian, Purwanto, & Wibowo, 2020). The results
on Hypothesis 1 also support research conducted by
Kim & Woo, (2016), Teo & Jarupunphol (2015),
and Huang et al. (2015). However, these results are
not in line with research conducted by Yadav,
Sharma, & Tarhini (2016), Chong (2013), and Lee,
Park, Chung, & Blakeney (2011).
The t-statistic Attitude Towards Using to Actual
System Usage is 2,538 or greater than 1,96 with the
Original Sample result of 0,233. In the results of the
p-value, the number on Attitude Towards Using to
Actual System Usage is 0,011 or less than 0,05.
Based on these results, it can be explained that
Actual System Usage is affected by Attitude
Towards Using so that it is also explained that
Hypothesis 2 is accepted. Aspects such as comfort,
the feeling of pleasure when buying, and the value
that Shopee users get are very decisive in purchasing
decisions even those that are impulsive, or purchases
made with planning. The advertisements on Shopee
also need to be regulated and designed in such a way
that they are not disturbing and are still informative
so that they can form the intention to take the next
action (Christian, 2017). The inconvenience of
making a purchase will make users leave Shopee and
reluctant to make a purchase. The design and display
arrangement that is not cluttered can be one of the
factors that determine the pleasure and comfort of
looking to make a purchase (Christian, 2019b). The
results on Hypothesis 2 are in line with the results of
research conducted (Huang et al., 2015;
Kanchanatanee, Suwanno, & Jarernvongrayab,
2014). However, these results are inversely
proportional to the results of research conducted by
Tyas & Darma, (2017).
4 CONCLUSIONS
Based on the results and discussion described above, it
can be explained that the Attitude Towards Using
factor in the use of Shopee is affected by the Perceived
Ease of Use factor that is felt by users in this study.
Furthermore, the Actual System Usage factor in
Shopee according to the user experience is affected by
the Attitude Towards Using factor that is felt by the
user himself. Based on the conclusions and discussion
above, this study suggests that efforts or strategies are
still needed to increase awareness of Shopee's presence
for the public, both as users and for those who have not
used it. Socialization strategies such as advertisements
in various forms and both on-page and off-page media
can be a supporting factor in increasing the number of
followers, especially on Twitter and increasing the
number of visits on the Shopee web.
REFERENCES
Al-hawari, M. A., & Mouakket, S. (2010). The influence of
Technology Acceptance Model (TAM) factors on
students’ e-satisfaction and e-retention within the
context of UAE e-learning. Education, Business and
Society: Contemporary Middle Eastern Issues, 3(4),
299–314. https://doi.org/10.1108/17537981011089596
Al Idrus, S., Ahmar, A. S., & Abdussakir, A. (2018). The
effect of organizational learning on market orientation
moderated by job satisfaction. Cogent Business &
Management, 5(1475048), 1–12. https://doi.org/10.10
80/23311975.2018.1475048
Chong, A. Y., (2013). Predicting m-commerce adoption
determinants: a neural network approach. Expert
Systems with Applications, 40(2), 523–530.
Christian, M. (2017). Pengaruh Unsur-Unsur Iklan Pajak:
Hiburan, Informatif Dan Nilai Iklan. Bricolage: Jurnal
Magister Ilmu Komunikasi, 3(02), 156–164.
https://doi.org/10.30813/bricolage.v3i02.936
Christian, M. (2018). Determinan Niatan Beralih Gunakan
Antar Transportasi Daring. Journal Of Business &
Applied Management, 11(2).
Christian, M. (2019a). Dampak Penggunaan Teknologi
Berbasis Aplikasi Pada Usaha Restoran Berskala Mikro
& Kecil. Journal of Business and Applied Management,
12(2), 131–140. Retrieved from https://journal.ubm.
ac.id/index.php/business-applied-
management/article/view/1822/1516
Christian, M. (2019b). Telaah Keniscayaan Iklan Di Kanal
Youtube Sebagai Perilaku Khalayak Di Kalangan
Milenial (Study The Inevatibility of Advertisements on
Youtube Channels as Audience Behavior among
Milennials). Bricolage : Jurnal Magister Ilmu
Komunikasi, 5(2), 141–158.
Christian, M., Dewi, D., Rembulan, G. D., Indriyarti, E. R.,
Wibowo, S., & Yuniarto, Y. (2021). Business
ICE-HUMS 2021 - International Conference on Emerging Issues in Humanity Studies and Social Sciences
196

Performance Determinants of Salted Fish Distribution
in Kapuk During the COVID-19. Journal of
Distribution Science, 19(6), 29–39.
https://doi.org/10.15722/jds.19.6.202106.29
Christian, M., Purwanto, E., & Wibowo, S. (2020).
Technostress Creators on Teaching Performance of
Private Universities in Jakarta During Covid-19
Pandemic. Technology Reports of Kansai University,
62(6), 2799–2809.
Dahi, M., & Ezziane, Z. (2015). Measuring e-government
adoption in Abu Dhabi with technology acceptance
model (TAM). International Journal of Electronic
Governance, 7(3), 206–231.
Hair, J. F., Black, W. C., Babin, B. J., & Anderson, R. E.
(2014). Multivariate Data Analysis (7th ed.). Essex:
Pearson Education Limited.
Hajiha, A., Shahriari, M., & Vakilian, N. (2014). The Role
of Perceived Value on Customer E-Shopping Intention
Using Technology Acceptance Model (TAM).
International Conference on Industrial Engineering
and Engineering Management (IEEM), 1136–1140.
Selangor: IEEE.
Huang, J.-M., Ho, T.-K., Liu, Y.-C., & Lin, Y.-H. (2015).
A discussion on the user intention of golfers toward golf
GPS navigation. Journal of Hospitality and Tourism
Technology, 6(1), 26–39.
Indriyarti, E. R., & Christian, M. (2020). The Impact Of
Internal And External Factors On Taxpayer
Compliance. Journal of Business & Applied
Management, 13(1), 33–48.
iPrice. (2021). The Map of E-commerce in Indonesia.
Retrieved June 6, 2021, from iPriceInsights website:
https://iprice.co.id/insights/mapofecommerce/en/
Jokonya, O. (2015). Validating Technology Acceptance
Model (TAM) during IT Adoption in Organizations.
7th International Conference on Cloud Computing
Technology and Science (CloudCom), 509–516.
https://doi.org/10.1109/cloudcom.2015.56
Jongchul, O., & Sung-Joon, Y. (2014). Validation of Haptic
Enabling Technology Acceptance Model (HE-TAM):
Integration of IDT and TAM. Telematics and
Informatics, (31), 585–596. https://doi.org/10.1016/
.tele.2014.01.002
Kanchanatanee, K., Suwanno, N., & Jarernvongrayab, A.
(2014). Effects Of Attitude Toward Using, Perceived
Usefulness, Perceived Ease Of Use And Perceived
Compatibility On Intention To Use E-Marketing.
Journal of Management Research.
Kim, Y. ., & Woo, E. (2016). Consumer acceptance of a
quick response (QR) code for the food traceability
system: Application of an extended technology
acceptance model (TAM). Food Research Internation,
1–32. https://doi.org/10.1016/j.foodres.2016.05.002
Lee, Y. ., Park, J. ., Chung, N., & Blakeney, A. (2011). A
unified perspective on the factors influencing usage
intention towards mobile financial services. Journal of
Business Research, 65(11), 1590–1599.
Lin, S.-C., Persada, S. F., & Nadlifatin, R. (2014). A Study
of Student Behavior in Accepting the Blackboard
Learning System: a Technology Acceptance Model
(TAM) Approach. Proceedings of the 2014 IEEE 18th
International Conference on Computer Supported
Cooperative Work in Design, 457–462. Hsinchu: IEEE.
Memarzadeh, F., Blum, S. C., & Adams, C. (2016).
Business Travelers’ Intention to Purchase: The
Application of Technology Acceptance Model (TAM).
Journal of Quality Assurance in Hospitality & Tourism,
1–13. https://doi.org/10.1080/1528008x.2015.1096755
Mustafa, A. B., Harun, N. H., & Endin, M. Z. (2014).
Understanding e-book acceptance through Technology
Acceptance Model (TAM Model). 2nd International
Conference on Information and Communication
Technology (ICoICT), 122–126. Bandung: IEEE.
Pires, P., Costa Filho, B., & Cunha, J. (2011). Technology
Readiness Index (TRI) Factors as Differentiating
Elements between Users and Non Users of Internet
Banking, and as Antecedents of the Technology
Acceptance Model (TAM). Communications in
Computer and Information Science, 220, 215–229.
https://doi.org/10.1007/978-3-642-24355-4_23
Rauniar, R., Rawski, G., Yang, J., & Johnson, B. (2014).
Technology acceptance model (TAM) and social media
usage: an empirical study on Facebook. Journal of
Enterprise Information Management, 27(1), 6–30.
Shaffiei, Z. A., Mokhsin, M., Hamidi, S. R., & Yusof, N.
M. (2011). A Study of User’s Acceptance and
Perception Towards Campus Management System
(CMS) using Technology Acceptance Model (TAM).
3rd International Congress on Engineering Education
(ICEED), 128–131. Kuala Lumpur: IEEE.
Teo, T., & Jarupunphol, P. (2015). Dhammic Technology
Acceptance Model (DTAM): Extending the TAM
Using a Condition of Attachment in Buddhism. Journal
of Educational Computing, 52(1), 131–151.
https://doi.org/10.1177/0735633114568859
Teo, T., & Noyes, J. (2011). An assessment of the influence
of perceived enjoyment and attitude on the intention to
use technology among pre-service teachers: A
structural equation modeling approach. Computers &
Education, (57), 1645–1653. https://doi.org/10.1016/
j.compedu.2011.03.002
Tyas, E. I., & Darma, E. S. (2017). Pengaruh Perceived
Usefulness, Perceived Ease of Use, Perceived
Enjoyment, dan Actual Usage Terhadap Penerimaan
Teknologi Informasi: Studi Empiris Pada Karyawan
Bagian Akuntansi dan Keuangan Baitul Maal Wa
Tamwil Wilayah Daerah Istimewa Yogyakarta dan Sek.
Reviu Akuntansi Dan Bisnis Indonesia, 1(1), 25–35.
Wong, K. K.-K. (2013). Partial Least Squares Structural
Equation Modeling (PLS-SEM) Techniques Using
SmartPLS. Marketing Bulletin, 24(1), 1–32.
Xu, Y., & Gan, L. (2010). Study on Influence Factors
Model of Technology Acceptance in Digital Library
Based on User Cognition and TAM. International
Conference on Management and Service Science
(MASS). Wuhan: IEEE.
Yadav, R., Sharma, S., & Tarhini, A. (2016). A multi-
analytical approach to understand and predict the
mobile commerce adoption. Journal of Enterprise
Information Management, 29(2), 222–237.
Measuring Ease of Use Aspects of Shopee Usage Behavior during Pandemic using PLS-SEM Approach
197
