Potential Relationship between Students’ Satisfaction on University
Attributes and Positive or Negative Word-of-Mouth (WOM) and Its
Correlation with Their Recommendations
Imelda Junita
a
, Fanny Kristine
b
, Sherlywati
c
and Rizki Muhammad Sidik
d
Department of Management, Maranatha Christian University, Suria Sumantri 65, Bandung, Indonesia
1852095@eco.maranatha.edu
Keyword: Attributes of Students’ Satisfaction, Positive and Negative Word-of-Mouth, Students’ Perception,
Recommendation.
Abstract: Prospective students willing to further their education are expected to gather adequate information, compare
and evaluate the benefits and disadvantages of various universities in a competitive academic atmosphere.
One of the numerous ways of gathering information is through Word-of-Mouth (WOM) from family
members, relatives and friends. Positive or negative WOM is generally formed from university students'
experiences. The purpose of this study is to investigate specific attributes likely to enhance students’
satisfaction regarding a university through Word-of-Mouth (WOM). This is a quantitative and qualitative
research with data obtained from 57 students of a private university in Bandung, Indonesia, from a
questionnaire and Focus Group Discussion (FGD). The results showed that students were most satisfied with
the campus facilities and least satisfied with financial policy. Meanwhile, the results of correlation analysis
indicated that 14 attributes had positive correlation significantly, 7 attributes had negative correlation
significantly, and another 7 were not related. Furthermore, FGD was used to extract information on students'
perceptions, opinions, attitudes towards the experiences gained at the university. The results showed a
significant positive correlation between positive WOM and recommendations by students to others, with no
negative WOM. Based on the study, implications for the university are discussed, and suggestion for future
research is provided.
1 INTRODUCTION
Nowadays, the level of competition among
universities in Indonesia, with dominance in those
owned by private organizations, is significantly
increasing. According to Digdowiseiso (2020) in
2018, Indonesia had 345 (88,24%) private
universities and 46 (11,76%) public universities.
High school graduates are now becoming more
discerning in selecting universities to further their
education due to the expenses associated with the
process. However, by gaining admission into a
university, students are able to choose an occupation
that is suitable for their skills, which in turn provides
financial stability and personal satisfaction.
a
https://orcid.org/0000-0001-7932-6932
b
https://orcid.org/0000-0002-5974-7606
c
https://orcid.org/0000-0002-6429-3549
d
https://orcid.org/0000-0001-7058-8928
Furthermore, it is one of the most important steps
toward social and economic welfare in students' lives
because it shapes their career. Therefore, universities
have to attract prospective students while ensuring the
old ones are properly retained. The universities have
to ascertain their services satisfy students'
expectations.
Generally, universities engaged in service
industry, whereby the output cannot be evaluated
before consumption. Expectations on services are not
as apparent as those of tangible products (Özdemir et
al., 2016). Students tend to gather information
regarding the services provided by universities from
their surroundings, such as family members,
relatives, friends and social media. The informal
160
Junita, I., Kristine, F., Sherlywati, . and Sidik, R.
Potential Relationship between Students’ Satisfaction on University Attributes and Positive or Negative Word-of-Mouth (WOM) and Its Correlation with Their Recommendations.
DOI: 10.5220/0010749000003112
In Proceedings of the 1st International Conference on Emerging Issues in Humanity Studies and Social Sciences (ICE-HUMS 2021), pages 160-166
ISBN: 978-989-758-604-0
Copyright
c
2022 by SCITEPRESS – Science and Technology Publications, Lda. All rights reserved

comment or impression on the services by someone
to others forms Word-of-Mouth (WOM)
communication. This is defined as a strategy used to
share opinions, feelings or experiences that influence
others’ evaluation and intentions. The messages are
either positive or negative, depending on their
individual opinions (Harahap, Hurriyati, Gaffar,
Wibowo, et al., 2018). Therefore, WOM
communication has become an important source in
the service industry that is capable of positively or
negatively impacting people’s behaviour and
decision-making effectively.
Universities usually use various promotional
instruments to fascinate prospective students.
Nevertheless, some of these instruments are unable to
convince prospective students to register to the
universities, particularly in the final decision-making
phase. WOM communication plays a significant role
in affecting students' decision-making process in
selecting a university. In the Asia Pacific, especially
in Indonesia, people mostly rely on third-party
recommendation (Khraim, 2011). WOM
communication is a powerful tool because it is
usually trusted by information recipients (Chen,
2016). Furthermore, suggestions from family
members, relatives and friends are much more
effective than advertisements and publications.
Normally, people tend to trust others’ opinion
because they feel it is proposed independently
without force or encouragement (Khraim, 2011).
During the search phase, prospective students gather
information on universities from the internet or social
media. However, in the selection phase, they prefer to
obtain a tremendous part of off-the-record
information from informal sources, such as from
family members, relatives, friends, etc.
Here, WOM
communication plays an essential role in the
prospective students' decision-making processes to
choose a university (Lehmann, 2017).
There are positive and negative impacts
associated with this means of gathering information.
Positive WOM communication influence prospective
students to select a university, while negative WOM
creates antipathetic impacts. Negative WOM
communication has the ability to destroy the
university’s reputation and discourage prospective
students from registering.
Many previous studies have discussed the effects
of WOM communication on students’ preferences
and how it influences their decision-making
behaviours.
Özdemir et al. (2016) carried out a research to
determine the effect of WOM communication on
prospective university students in Turkey, especially
on emerging needs, collecting information and
evaluating preferences. WOM communication also
influenced students' decision-making behaviours,
particularly after examining satisfaction,
disappointment and complaints.
The study carried out by Harahap et al., Hurriyati,
Gaffar, and Amanah (2018) stated that WOM
communication positively influenced students’
decision in selecting a university in Indonesia. This is
in accordance with the research carried out by
Lehman ( 2017), which stated that traditional WOM
communication had a more substantial impact on
prospective students' preferences than e-WOM. This
is because e-WOM usually has a more substantial
impact during the search phase than the selection.
Chloe (2019) found a positive relationship
between the overall satisfaction of international
students and social experiences in Malaysia through
WOM communication.
Other studies also discussed predictor variables
affecting WOM communication, such as service
quality, students’ satisfaction, reputations and brand
image of a university.
Dora (2016) stated that the service quality of
private universities is needed to provide students
satisfaction. WOM communication is the implication
of service quality mediated by students' satisfaction.
A study by Chen (2016) on students and graduates
of universities in Taiwan found that brand image,
satisfaction and loyalty of students significantly and
positively influenced the sharing of pleasant
experiences and referencing the university to others.
Ong (2017) proved that students' satisfaction had
an influence on WOM and switching behaviour
directly and significantly. This role as a mediating
variable has also indirectly increased the effect of
reputation on WOM and switching behaviour.
The other studies indicated that service quality
increases students' satisfaction and encourage them to
carry out WOM communication with others
(Mestrovic, 2018; Handayanto, 2018).
Khraim (2011) examined students' willingness to
deliver positive WOM communication in Jordan. The
research found that satisfaction, experience and
source, positively influenced WOM communication
directly. Yet, incentives provided by the universities
have not influenced the students to propagate positive
WOM significantly. When students are satisfied, they
tend to spread positive WOM and more likely to make
a recommendation.
Therefore, it is obvious that WOM is powerful,
more relevant and comprehensive because of its
independent trait. WOM communication has
distinctive credibility. In university, positive or
Potential Relationship between Students’ Satisfaction on University Attributes and Positive or Negative Word-of-Mouth (WOM) and Its
Correlation with Their Recommendations
161
negative WOM is influenced by many factors, which
positively or negatively impacts students' behaviour.
2 METHODS
The research questions are identified as follows:
● Which specific attributes of students’ satisfaction
influence positive or negative WOM
communication regarding the university?
● How are students' experiences likely to enhance
their satisfaction and their perceptions of those
experiences?
● Is there any significant relationship between
positive or negative WOM communication with
students’ recommendation on the university to
others?
The research aims to verify the potential
relationship between students' satisfaction with each
university attribute and their positive and negative
WOM communication and to verify the correlation
between positive or negative WOM communication
with students’ recommendations. This research also
aims to explore students' experiences and perceptions
in accordance with their satisfaction.
The combination of both quantitative and
qualitative research methods are used in this study to
provide a better understanding of research problems.
For quantitative analysis, an online questionnaire
with the Likert Scale was developed. In Part I,
participants were asked to rate their satisfaction levels
with 14 attributes of university experiences (1=very
dissatisfied, 7=very satisfied), such as satisfaction
with the lecturers, curriculum, academic advice, etc.
In Part II, participants were asked to rate the levels
they are likely to communicate positive or negative
WOM to others on the attributes of university
experiences (1=very unlikely, 7=very likely). In Part
III, participants were asked to rate the levels of
recommendation, such as recommending a university
to family members, relatives and friends, as the first
choice in the master program (1=very unlikely,
7=very likely). Correlation analysis was used to
analyse the relationships between levels of students'
satisfaction and positive WOM, levels of students'
satisfaction and negative WOM, positive or negative
WOM and recommendations. This online
questionnaire was administered to 57 undergraduate
students of a private university in Bandung,
Indonesia. Furthermore, qualitative analysis with
focus group discussion was conducted to complement
the quantitative analysis.
The validity test was conducted to determine the
validity of the statements and the fidelity of the
measurement. Pearson correlation analysis was used
to test the validity. Pearson correlation coefficient is
a number between -1 and +1 that indicates the level
of linear dependency between variables. Pearson
correlation coefficients of > 0.35 are interpreted as
strongly valid (Oktavia et al., 2018).
There are 14 attributes of university experiences
to be analysed:
1. Lecturers
2. Curriculum
3. Academic Advising
4. Learning Process
5. Online Learning
6. Information Technology
7. Academic Policy
8. Financial Policy
9. Administration Staffs
10. Learning Facility
11. Campus Other Facility
12. Students’ Activities
13. Social Interaction
14.
Career Prospects
Tables 1-3 show the validity tests results for
students’ satisfaction on each attribute (S1-S14),
Positive WOM on each attribute (PWOM) and
Negative WOM on each attribute (NWOM).
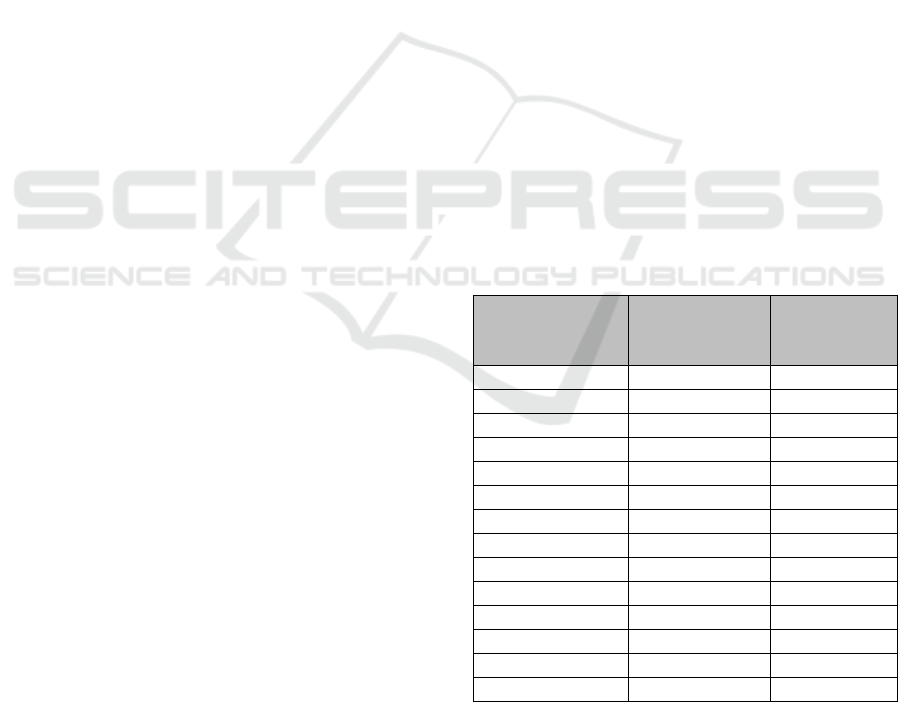
Table 1: Validity Test for Students’ Satisfaction Attributes.
Students’
Satisfaction on
Attributes
Coefficient Results
S1 0.744 vali
d
S2 0.825 vali
d
S3 0.440 vali
d
S4 0.535 vali
d
S5 0.649 vali
d
S6 0.650 vali
d
S7 0.838 vali
d
S8 0.654 vali
d
S9 0.688 vali
d
S10 0.795 vali
d
S11 0.515 vali
d
S12 0.788 vali
d
S13 0.728 vali
d
S14 0.702 vali
d
Table 1 shows the result of validity test on students’
satisfaction with each attribute. As all the Pearson
correlation coefficient >0.35, all variables of
students’ satisfaction can be interpreted as valid.
ICE-HUMS 2021 - International Conference on Emerging Issues in Humanity Studies and Social Sciences
162
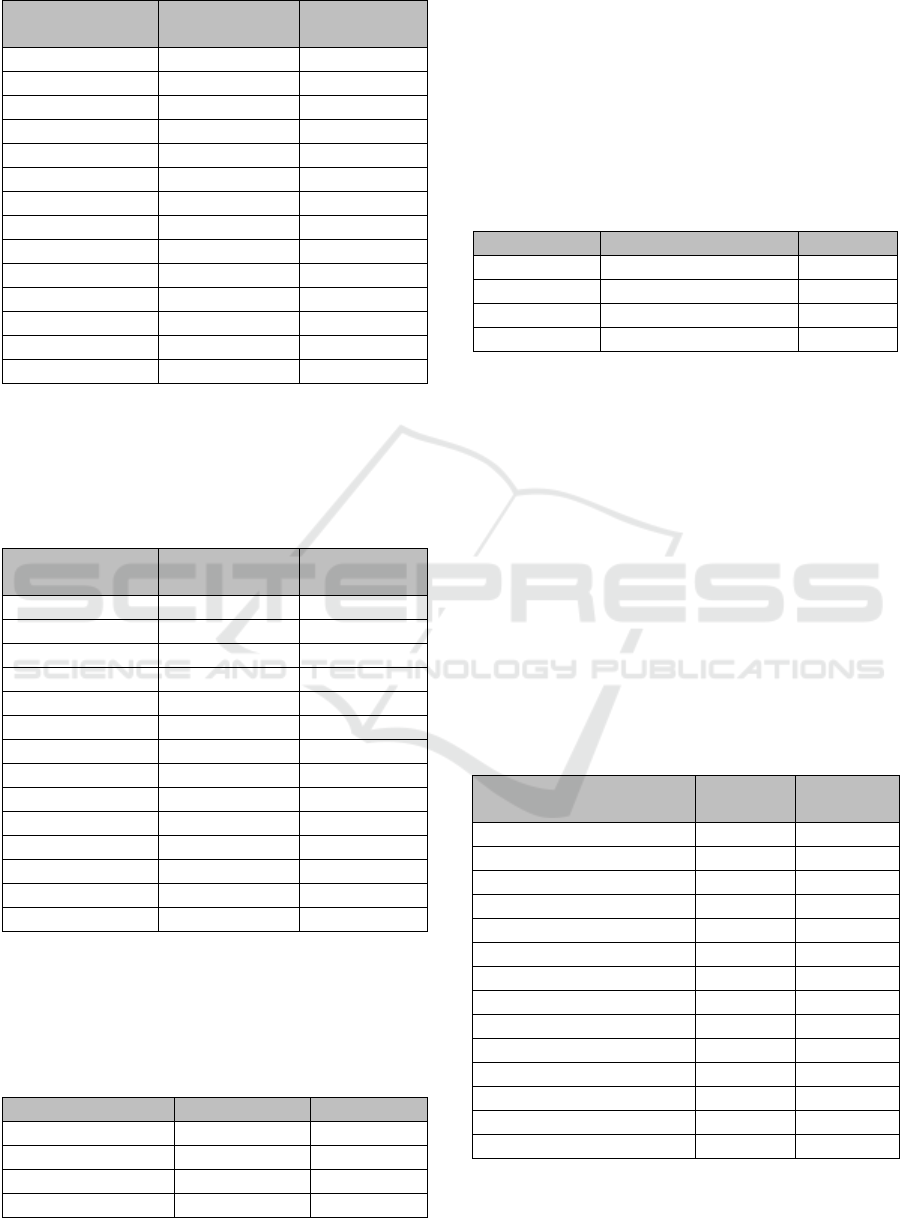
Table 2: Validity Test for Positive WOM.
Positive WOM
on Attributes
Coefficient Results
PWOM1 0.648 vali
d
PWOM2 0.825 vali
d
PWOM3 0.717 vali
d
PWOM4 0.778 vali
d
PWOM5 0.793 vali
d
PWOM6 0.823 vali
d
PWOM7 0.797 vali
d
PWOM8 0.691 vali
d
PWOM9 0.770 vali
d
PWOM10 0.806 vali
d
PWOM11 0.612 vali
d
PWOM12 0.746 vali
d
PWOM13 0.803 vali
d
PWOM14 0.867 vali
d
Table 2 shows the result of validity test on
positive WOM of each attribute. As all the Pearson
correlation coefficient >0.35, all variables of positive
WOM can be interpreted as valid.
Table 3: Validity Test for Negative WOM.
Negative WOM
on Attributes
Coefficient Results
N
WOM1 0.914 vali
d
N
WOM2 0.935 vali
d
N
WOM3 0.859 vali
d
N
WOM4 0.921 vali
d
N
WOM5 0.876 vali
d
N
WOM6 0.909 vali
d
N
WOM7 0.940 vali
d
N
WOM8 0.842 vali
d
N
WOM9 0.903 vali
d
N
WOM10 0.896 vali
d
N
WOM11 0.882 vali
d
N
WOM12 0.920 vali
d
N
WOM13 0.910 vali
d
N
WOM14 0.891 vali
d
Table 3 shows the result of validity test on
negative WOM of each attribute. As all the Pearson
correlation coefficient >0.35, all variables of negative
WOM can be interpreted as valid.
Table 4: Validity Test for Recommendation.
Recommendation Coefficient Results
R1 0.901 vali
d
R2 0.899 vali
d
R3 0.958 vali
d
R4 0.822 vali
d
Table 4 shows the result of validity test on
recommendation of each attribute. As all the Pearson
correlation coefficient >0.35, all variables of
recommendation can be interpreted as valid.
The next step is the reliability test, which indicates
the consistency of the instrument in measuring a
certain phenomenon (Ursachi et al., 2015). Cronbach’s
Alpha coefficients of the variables were calculated to
determine the reliability of the instrument.
Table 5: Reliability Test.
Variables Cronbach’s Alpha Results
S 0.909 reliable
PWOM 0.943 reliable
N
WOM 0.982 reliable
R 0.901 reliable
In Table 5., the results indicated that all
Cronbach’s Alpha values were very good and ranged
from 0.901 to 0.982. According to a commonly
accepted theorem, Cronbach’s alpha of 0.60-0.70
represents a reasonable degree of reliability, and
when it is above 0.80, it is in the very good degree
category (Ursachi et al., 2015). This means that all the
variables were consistent or relatively homogenous in
the questionnaire.
3 RESULTS AND DISCUSSION
Table 6 shows the descriptive statistics for students’
satisfaction with attributes.
Table 6: Descriptive Statistics for Students’ Satisfaction.
Students’ Satisfaction
on Attributes
Mean Standard
Deviation
Lecturers 5.81 0.97
Curriculu
m
5.70 0.96
Academic Advisin
g
6.14 1.20
Learnin
g
Process 5.91 1.01
Online Learnin
g
5.25 1.39
Information Technolo
gy
5.84 1.15
Academic Polic
y
5.65 1.19
Financial Polic
y
4.93 1.43
Administration Staffs 5.72 1.13
Learnin
g
Facilit
y
5.89 1.10
Campus Other Facilit
y
6.21 0.92
Students’ Activities 5.63 1.29
Social Interaction 5.89 1.18
Career Prospects 5.75 0.93
Table 6 shows the levels of students' satisfaction
with various attributes of university experiences
Potential Relationship between Students’ Satisfaction on University Attributes and Positive or Negative Word-of-Mouth (WOM) and Its
Correlation with Their Recommendations
163
(1=very dissatisfied to 7=very satisfied). The table
shows that students were most satisfied with campus
and other facilities and least satisfied with financial
policy.
To examine students' perception of each attribute,
they were asked to share their experiences on the
attributes that satisfied or dissatisfied them.
One of the students shared the following
experience on campus other facilities as follows
“Other campus facility, such as food court, it is very
extraordinary with lots of menu variations. Banks and
healthcare are also very helpful. For instance, I
suddenly got sick when I was studying on campus. I
immediately went to the campus health clinic and was
treated. I did not have to pay for it.” Another student
stated that the parking space is quite spacious.
Students also offered suggestions to improve other
campus facilities. For instance, they stated that
“Every classroom needs to be equipped with an air
conditioner, due to the hot weather.” and “The Wi-Fi
network needs to be extended, for students to be able
to access the internet from anywhere."
Few students share dissatisfactions with financial
policy, such as in the following excerpt:” In this
pandemic situation, many students are in financial
distress. University needs to raise tuition discount
rates because students learn from home." and
“Students have to pay the total amount of tuition fee
as stated in the Integrated Administration System
without knowing the details of financial bills.”
In correlations analysis between the levels of
students' satisfaction on attributes and positive
WOM, all the p-values are smaller than the alpha
used, which is 0.05. This means there is a significant
correlation between the students' satisfaction on
attributes and positive WOM, as shown in Table 7.
The correlation analysis results showed that the 14
attributes of satisfaction have positive relationships
with WOM. The signs of all coefficients were
positive, which means the more satisfied students
with the university attributes, the higher their
possibility to communicate positive WOM. These
attributes are lecturers, curriculum, academic
advising, learning process, online learning,
information technology, academic policy, financial
policy, administration staffs, learning facility,
campus, students’ activity, social interaction, and
career prospects.
Regarding the degree of the Pearson correlation,
values of 0 and 1 indicate no correlation and perfect
correlation, respectively. The closer the Pearson
correlation values to +1, the stronger the relationship
between the satisfaction on each attribute with
positive WOM. Meanwhile, when the Pearson
correlation value is closer to 0, it indicates that the
relationship between satisfaction on each attribute
and positive WOM is getting weaker. A correlation
value > 0.5 indicates a fairly strong relationship as a
simple guideline, while a correlation value < 0.5
indicates a weak relationship.
Students' satisfaction with strong relationship and
positive WOM are lecturers, curriculum, online
learning, information technology, academic policy,
financial policy, administration staff, learning
facility, students' activities, social interaction, and
career prospects. Meanwhile, attributes of students'
satisfaction that have a weak relationship with
positive WOM are academic advising, learning
process, and campus other facilities.
Table 7: Correlations between Students’ Satisfaction on
Attributes and Potential Positive WOM Communication.
Attributes r p-value
Lecturers .607 .000*
Curriculu
m
.687 .000*
Academic Advisin
g
.431 .001*
Learnin
g
Process .329 .012*
Online Learnin
g
.539 .000*
Information Technolo
gy
.545 .000*
Academic Polic
y
.709 .000*
Financial Polic
y
.605 .000*
Administration Staffs .569 .000*
Learnin
g
Facilit
y
.688 .000*
Campus Other Facilit
y
.373 .004*
Students’ Activities .641 .000*
Social Interaction .615 .000*
Career Prospects .639 .000*
The correlation analysis results also showed that
the attribute most strongly related to positive WOM
is academic policy, which is represented by the value
of 0.709. Some students expressed their opinions on
academic policy, as follows: “So far, the academic
policy is clearly informed, with adequately structured
academic activities, hence I have no problem with
academic policy.” Interestingly, students were most
satisfied with campus other facilities, however, this
attribute was related most weakly to positive WOM.
Meanwhile, the results of the correlation analysis
between the level of students’ satisfaction on
attributes and negative WOM, as shown in Table 8,
indicates that 7 of the 14 students’ satisfaction on
attributes significantly correlated with negative
WOM. These attributes include lecturers, curriculum,
learning process, academic policy, learning facility,
students’ activities and social interactions. The
correlation results are all negative; therefore,
ICE-HUMS 2021 - International Conference on Emerging Issues in Humanity Studies and Social Sciences
164
increasing students' satisfaction on attributes value
decreases their possibility of communicating negative
WOM. The closer the Pearson correlation values to -
1, the stronger the relationship between the
satisfaction on each attribute with negative WOM.
Nevertheless, these 7 attributes of satisfaction have a
weak relationship with negative WOM and
significantly correlated with positive WOM (six
attributes strongly correlated with positive WOM,
including lecturers, curriculum, academic policy,
learning facility, students’ activity and social
interaction). Therefore, students' dissatisfaction with
these 6 attributes resulted in negative WOM weakly
but students’ satisfaction with these attributes
resulted in positive WOM strongly.
The attribute that was related most strongly to
negative WOM is lecturers. Few students shared their
experiences about lecturers, such as “I have both
positive and negative impression on few lecturers.
This is because some lecturers create a pleasant
learning atmosphere. They arranged simulation and
interactive discussion in the class for students to
understand the learning course properly.
Furthermore, students’ efforts were also appreciated.
However, some lecturers did not deliver the learning
course properly.”
On the contrary, students' satisfaction on
attributes including academic advising, online
learning, information technology, financial policy,
administration staffs, campus other facilities, and
career prospects were only related to positive WOM.
Hence, students' satisfaction with these attributes
generated positive WOM but students’ dissatisfaction
with these attributes would not generate negative
WOM.
Table 8: Correlations between Students’ Satisfaction on
Attributes and Potential Negative WOM Communication.
Attributes r p-value
Lecturers -.405 .002*
Curriculu
m
-.397 .002*
Academic Advisin
g
-.081 .549
Learnin
g
Process -.292 .027*
Online Learnin
g
-.130 .336
Information Technolo
gy
-.243 .068
Academic Polic
y
-.383 .003*
Financial Polic
y
-.230 .086
Administration Staffs -.194 .147
Learnin
g
Facilit
y
-.351 .007*
Campus Other Facilit
y
-.210 .117
Students’ Activities -.374 .004*
Social Interaction -.342 .009*
Career Prospects -.149 .267
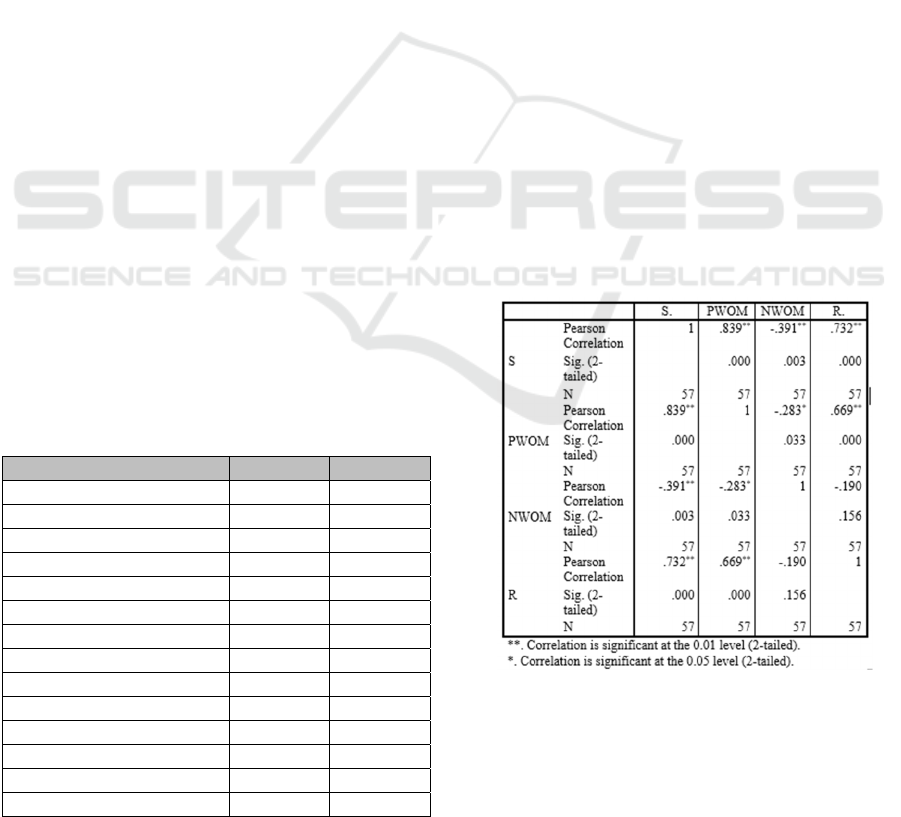
Table 9 shows the correlation between students’
satisfaction on attributes and positive WOM with a
sig-value of 0.000, which is smaller than the alpha
used of 0.05. This means that there is a significant
correlation between students’ satisfaction on
attributes and positive WOM. The relationship
between students’ satisfaction on attributes and
positive WOM is also positive because the Pearson
correlation value is 0.839. This means that the higher
the levels of students’ satisfaction on attributes, the
greater the levels of possibility of positive WOM.
Meanwhile, the sig value between students’
satisfaction on attribute and negative WOM generally
shows a sig-value of 0.003, which means there was a
significant and negative correlation (Pearson
correlation value of -0.391). Therefore, an increase in
the level of students' satisfaction on attribute leads to
a decrease in negative WOM from the students.
The correlation results between positive WOM
and recommendation shows the sig-value of 0.000,
smaller than alpha 0.05. This indicates a positive
Pearson correlation value of 0.669, which means the
higher the positive WOM, the greater the possibility
of recommendations delivered by students to others.
The correlation result between the negative WOM
with recommendations shows the sig-value of 0.156,
which is greater than alpha 0.05, which means that it
does not show a significant correlation (Pearson
correlation value of -0.190).
Table 9: Correlations between Variables.
4 CONCLUSIONS
In conclusion, this study showed a significant positive
and negative correlation between students'
Potential Relationship between Students’ Satisfaction on University Attributes and Positive or Negative Word-of-Mouth (WOM) and Its
Correlation with Their Recommendations
165

satisfaction on university attributes with WOM. It
means the more satisfied students with the university
attributes, the higher their possibility to communicate
positive WOM. The correlation analysis results
showed that the 14 attributes of satisfaction have
positive relationships with WOM. Furthermore, 11 of
these attributes, namely lecturers, curriculum, online
learning, information technology, academic policy,
financial policy, administration staffs, learning
facility, students’ activities, social interaction, and
career prospect, have strong relationships with
positive WOM. Meanwhile, 3 attributes, namely
academic advising, learning process, and campus
other facilities, have weak relationships with positive
WOM. Seven attributes of satisfaction, including
lecturers, curriculum, learning process, academic
policy, learning facility, student activities and social
interactions, also have a weak relationship with
negative WOM. These results are in accordance with
the research carried out by Palmer (2011), which
stated that some university attributes were associated
significantly with positive WOM but were not
associated significantly with negative WOM, while
some university attributes were associated
significantly with positive and negative WOM.
The policymaker of the university does not have
to improve other facilities because students are most
satisfied with this attribute. However, the university
needs to make a reasonable academic policy because
it was most strongly related to positive WOM. The
policymaker also needs to enhance the attribute of the
lecturer and make sure to improve performance on
this attribute because it tends to reduce negative
WOM.
Future studies need to be carried out on additional
attributes, such as campus scholarship, implementa-
tion of government policy on higher education, or
WOM communication implications on brand image,
reputation, etc.
REFERENCES
Chen, C.-T. (2016). The Investigation on Brand Image of
University Education and Students’ Word-of-Mouth
Behavior. Higher Education Studies, 6(4), 23.
https://doi.org/10.5539/hes.v6n4p23
Chloe, T. W. S. (2019). Investigating Key Factors
Influencing International Students ’ Choice of Private
Higher Education Institutions ( HEIs ) in Malaysia.
January, 1–304.
Digdowiseiso, K. (2020). The development of higher
education in Indonesia. International Journal of
Scientific and Technology Research, 9(2), 1381–1385.
Dora, Y. M. (2016). Word of Mouth Implications of Service
Quality Mediated Student Satisfaction. 8th Widyatama
International Seminar on Sustainability WORD, 6.
Handayanto, E. (2018). Mediating Role of Satisfaction on
Relationship between Service Quality and Word of
Mouth in Islamic Private Universities in Indonesia.
231(Amca), 530–534. https://doi.org/10.2991/amca-
18.2018.147
Harahap, D. A., Hurriyati, R., Gaffar, V., & Amanah, D.
(2018). The impact of word of mouth and university
reputation on student decision to study at university.
Management Science Letters, 8(6), 649–658.
https://doi.org/10.5267/j.msl.2018.4.027
Harahap, D. A., Hurriyati, R., Gaffar, V., Wibowo, L. A.,
& Amanah, D. (2018). Effect of Word of Mouth on
Students Decision to Choose Studies in College. 1
st
International Conference on Islamic Economics,
Business and Philanthropy, 793–797. https://doi.org/
10.5220/0007090007930797
Khraim, H. S. (2011). The willingness to generate positive
word of mouth marketing: The case of students in
private universities in Jordan. Pertanika Journal of
Social Science and Humanities, 19(2), 273–289.
Lehmann, W. (2017). The Influence of Electronic Word-of-
Mouth on College Search and Choice. College and
University, 92(4), 2–11. http://ezproxy.lib.uconn.edu/
login?url=https://search.ebscohost.com/login.aspx?dir
ect=true&db=eric&AN=EJ1162189&site=ehost-
live%0Ahttp://www.aacrao.org/resources/publications
/college-university-journal-(c-u)
Mestrovic, D. (2018). The Impact of Service Quality on
Students’ Satisfaction and the Word-of-Mouth: The
Case of the University of Rijeka Departments. SSRN
Electronic Journal, September, 440–445.
https://doi.org/10.2139/ssrn.3282466
Oktavia, R., Irwandi, I., Rajibussalim, T., Mentari, M., &
Mulia, I. S. (2018). Assessing the validity and
reliability of questionnaires on the implementation of
Indonesian curriculum K-13 in STEM education.
Journal of Physics: Conference Series, 1088.
https://doi.org/10.1088/1742-6596/1088/1/012014
Ong, L. (2017). Effects of Reputations and Satisfactions on
Positive Word of Mouth Intentions and Switching
Behaviors. International Journal of Business Studies,
1(1). https://doi.org/10.32924/ijbs.v1i1.8
Özdemir, A., Tozlu, E., Şen, E., & Ateşoğlu, H. (2016).
Analyses of Word-of-mouth Communication and its
Effect on Students’ University Preferences. Procedia -
Social and Behavioral Sciences, 235(October), 22–35.
https://doi.org/10.1016/j.sbspro.2016.11.022
Palmer, J. (2011). Predictors of Positive and Negative
Word of Mouth of University Students: Strategic
Implications for Institutions of Higher Education Level
of student satisfaction with various attricutes ( IV )
students Positive and negative WOM effects.
International Journal of Business and Social Science,
2(7), 59–63.
Ursachi, G., Horodnic, I. A., & Zait, A. (2015). How
Reliable are Measurement Scales? External Factors
with Indirect Influence on Reliability Estimators.
Procedia Economics and Finance, 20(15), 679–686.
https://doi.org/10.1016/s2212-5671(15)00123-9
ICE-HUMS 2021 - International Conference on Emerging Issues in Humanity Studies and Social Sciences
166
