
Identification of Risk Factors for Delayed Time Schedule in
Summarecon Serpong Playfield Preschool Project
Deni Setiawan
1a
and Stefanny Abigail
2b
1
Department of Civil Engineering, Faculty of Engineering, Maranatha Christian University, Jl. Surya Sumantri 65,
Bandung, West Java, Indonesia
2
Bachelor Degree Student of Civil Engineering, Faculty of Engineering, Maranatha Christian University,
Jl. Surya, Sumantri 65, Bandung, West Java, Indonesia
Keywords: Delay, Risk Factors, Risk Identification, Project, Construction.
Abstract: Construction tasks are generally carried out beneath surroundings characterised with the aid of using various
diploma of hazard and uncertainties, which could end result from ‘acknowledged’, ‘acknowledged-
unknown’, and ‘unknown-unknown’ situations (Smith, 1999). Delays withinside the mission that may be as
a result of numerous elements, each inner and outside elements. However, it can't be denied that during
Indonesia stage of mission put off is pretty excessive and may be as a result of numerous elements, each
inner and outside elements. The motive of this take a look at is to investigate the elements of put off
withinside the implementation of the Playfield Preschool Summarecon Serpong mission. Final effects of the
take a look at there are variations of opinion concerning the elements inflicting mission delays among
mission people and teachers who're specialists withinside the area of production control. Based at the
descriptive take a look at effects of the 6 classes of put off, it changed into discovered that the thing
inflicting the best put off changed into the monetary class. More certain studies is wanted which may be
analyzed greater deeply into the elements inflicting mission delays aside from the monetary class.
a
https://orcid.org/0000-0002-0335-2111
b
https://orcid.org/0000-0003-3776-8657
1
INTRODUCTION
In Indonesia, the extent of mission delays is pretty
excessive, primarily based totally on studies carried
out with the aid of using 168 respondents who're
contractors, one hundred fifteen of whom stated that
delays in tasks frequently arise. The percent of put
off withinside the mission, it changed into
discovered that withinside the first role eighty two
respondents had a percent of delays beneathneath
1%, then withinside the 2nd role sixty one
respondents had a put off percent of 1-five% as
reported in Widhiawati (2012).
Delays withinside the mission that may be as a
result of numerous elements, each inner and outside
elements. Apart from inner and outside elements, in
general, a mission has a production control
representative in order that a mission can run in step
with the deliberate time, however in center to
decrease tasks that is frequently neglected. Playfield
Preschool is one in every of the faculties positioned
in a constructing that has been finished to be
particular withinside the Summarecon Digital Center
mall, Gading Serpong, Tangerang. This is because
of the growing want for the network withinside the
area of schooling which isn't matched with the aid of
using the provision of vacant land. To get round this,
many colleges were set up in purchasing
centers/mall or different transformed homes.
The Summarecon Serpong Playfield Preschool
improvement mission includes 2 mission elements,
specifically the development of a swimming pool and
the development of a faculty section. In the absence
of a production control representative at the mission,
maximum contractors aren't privy to the elements that
may reason delays withinside the mission. Where if a
production mission stories a put off, the time for the
finishing touch of the mission that has been said
withinside the agreement record wishes to be
increased. In addition to permitting extra prices and
190
Setiawan, D. and Abigail, S.
Identification of Risk Factors for Delayed Time Schedule in Summarecon Serpong Playfield Preschool Project.
DOI: 10.5220/0010747900003113
In Proceedings of the 1st International Conference on Emerging Issues in Technology, Engineering and Science (ICE-TES 2021), pages 190-199
ISBN: 978-989-758-601-9
Copyright
c
2022 by SCITEPRESS – Science and Technology Publications, Lda. All rights reserved
others to arise, it's far important to become aware of
and examine the hazard elements that reason the
mission put off. The motive of this take a look at is to
investigate the elements of put off withinside the
implementation of the Playfield Preschool.
2
LITERATURE REVIEW
2.1 Overview of Delay in Construction
Delay is partial unusable implementation time in
step with plan, consequently inflicting a number of
the sports that accompanied have become behind
schedule or cant be finished on time table deliberate
Ervianto (2005). In every other words, put off may
be appeared because the end result of now no longer
being fulfilled time table plans which have been
made, because of situations fact isn't the equal/in
step with the modern situations the time table is
made. Delay can as a result of the proprietor,
contractor or brought on herbal situations and
surroundings past the cap potential human or known
as pressure majeure.
The production commercial enterprise is a
commercial enterprise with excessive dangers,
dangers including monetary, political, safety and
hazard dangers at some stage in the implementation
itself ought to be controlled and treated well with the
aid of using the contractor. Meanwhile, at the part of
the mission proprietor, from the selection making
withinside the layout level to the level in which the
constructing is bodily operated, the mission
proprietor is confronted with unsure situations
concerning the very last final results of the mission.
On time, on price and as predicted are the 3 hazard
occasions that exist in every mission and of route
have an effect at the conduct of the mission
proprietor. Risk is taken into consideration an
occasion that isn't positive to arise, however if the
occasion takes place it's going to reason price
overruns Wang (2013).
2.2 Delay Risk Factors in Construction
Project delays may be as a result of numerous
elements, each herbal and human elements, in order
that the same old agreement files issued with the aid
of using the AIA (American Institute of Architects)
vary withinside the form of the mission into 3
classes, specifically: Compensable Delay,
Excusable/Non Compensable Delay, and Non-
Excusable Delay. Research carried out with the aid
of using Pinori et al. (2015) to decide the elements
that reason delays withinside the mission, there are
22 elements that reason delays withinside the class
of Reasonable Delay that merits Compensable Delay
(CD), 18 elements inflicting delays withinside the
class of Unreasonable Delay /Non Excusable Delay
(NED), and five elements that reason put off
withinside the Reasonable Delay class however do
now no longer get compensation / excusable put off
(ED). After the forty five elements are grouped into
three classes, then those elements are categorized
primarily based totally at the control components
reviewed as in Table 1. In a take a look at carried out
with the aid of using Pinori et al. (2015).
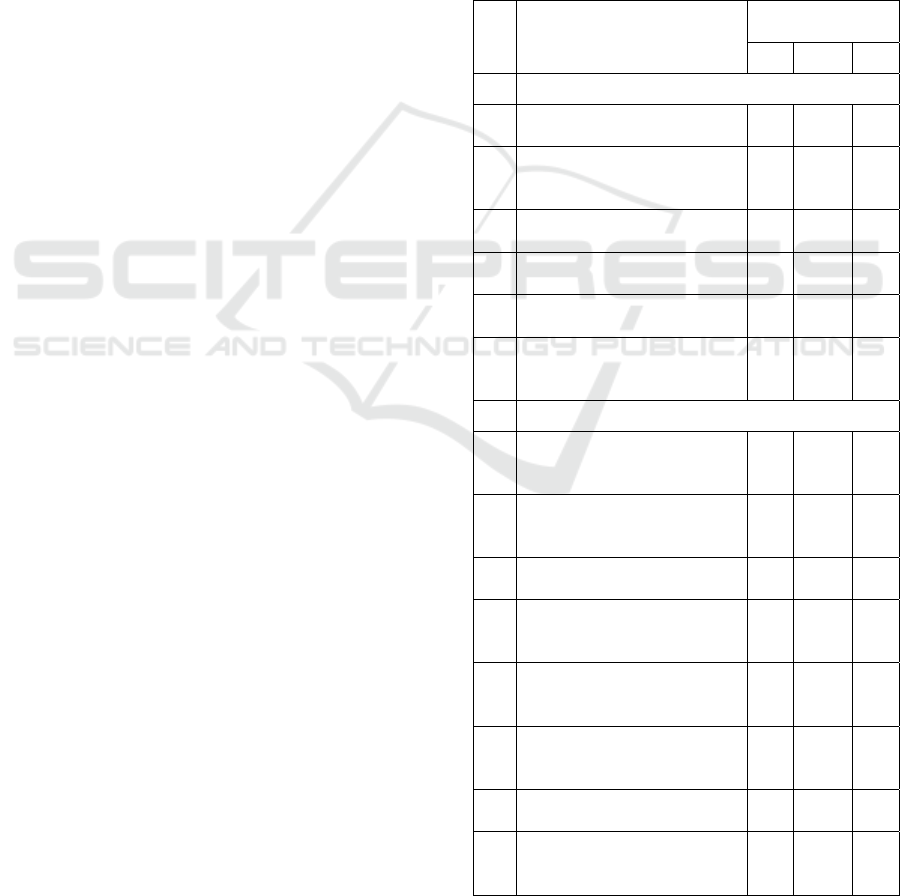
Table 1: Delay risk factors.
No Delay Risk Factors
Delay Type
Category
CD NED ED
A
Planning and Scheduling Aspects
1
Very strict project schedule
setting by owner
●
2
Incomplete identification of
the type of work that must
exist
●
3
Poorly structured / integrated
work sequence plan
●
4
Inaccurate determination of
time duration
●
5
The owner's work plan
changes frequently
●
6
The wrong method of
construction / work
execution
●
B
Scope Aspects and Work Documents (Contracts)
1
Planning (drawings /
specifications) is wrong /
incomplete
●
2
Changes in design / work
details at the time of
execution
●
3
Change in scope of work at
the time of implementation
●
4
The process of making a
working drawing by a
contractor
●
5
Process of requesting and
approving working drawings
by owners
●
6
Disagreement with the rules
for creating working
drawings
●
7
There is a lot (often) of extra
work
●
8
There is a request for
changes to work that has
been completed
●
Identification of Risk Factors for Delayed Time Schedule in Summarecon Serpong Playfield Preschool Project
191
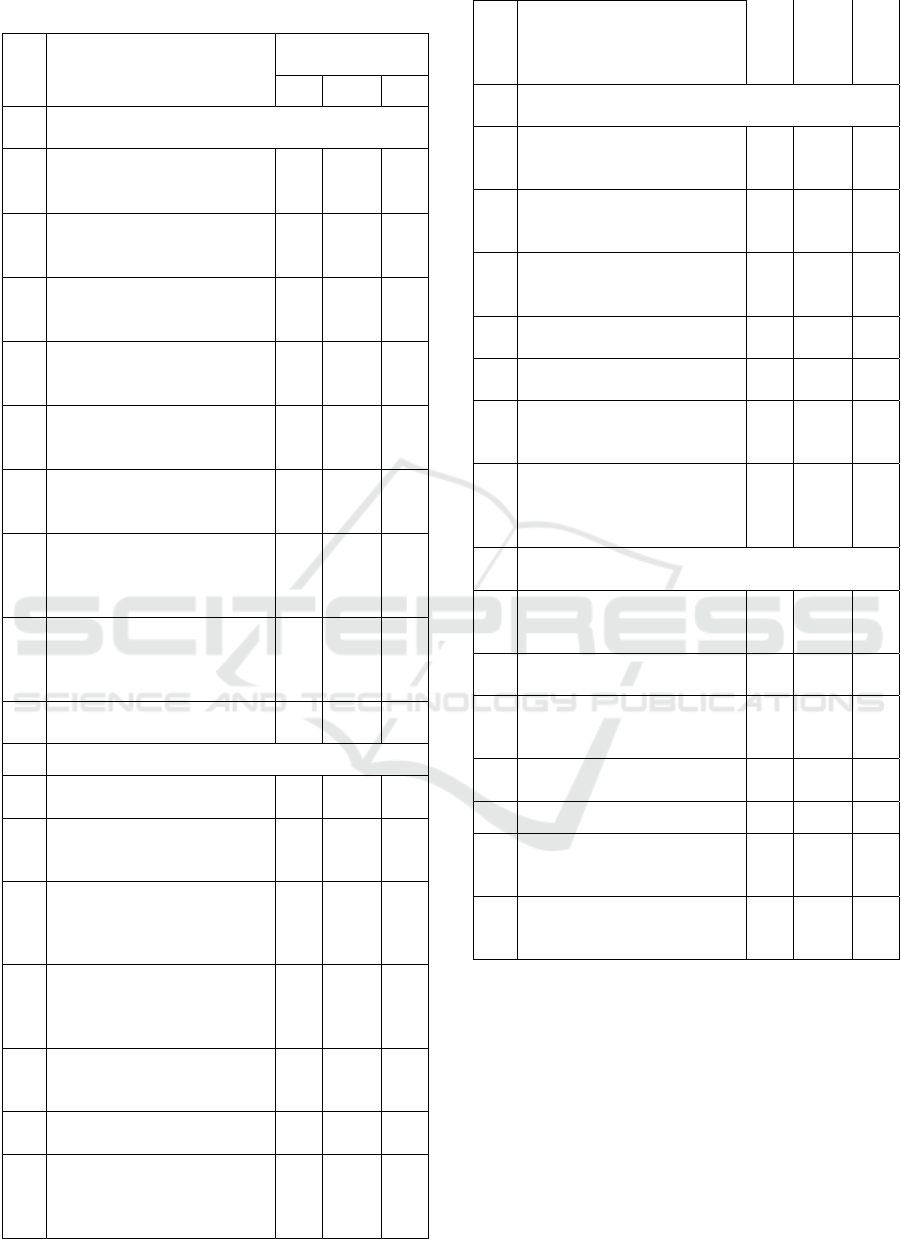
Table 1: Delay risk factors (cont.).
No Delay Risk Factors
Delay Type
Category
CD NED ED
C
Aspects of Organizational, Coordination and
Communication Systems
1
Limited authority of owner
personnel in decision
making
●
2
Qualifications of personnel /
owners who are not
professional in their fields
●
3
The owner's biocratic way
of inspection and control of
work
●
4
Failure of the owner to
coordinate the work of many
contractors / sub-tractors
●
5
The failure of the owner to
coordinate the transfer / use
of land
●
6
Delay in providing tools /
materials provided by the
owner
●
7
Poor technical and
managerial qualifications of
personnel in the contracting
work organization
●
8
Poor coordination and
communication between
parts of the contractor's
work organization
●
9
Occurrence of work
accidents
●
D Aspects of Readiness / Resource Preparation
1
low mobilization of resources
(materials, tools, labor)
●
2
Lack of skills and skills as
well as work motivation for
field workers
●
3
The number of workers who
are inadequate / in
accordance with existing
work activities
●
4
The unavailability of
sufficiently definite /
appropriate materials as
needed
●
5
Unavailability of work tools /
equipment which are
adequate or as needed
●
6
Negligence / tardiness by
work subcontractors
●
7
Funding of project activities
that are not well planned
(funding difficulties in
contractors)
●
8
Contractor is not paid
properly according to his
rights (funding difficulties
by the owner)
●
E
f
the Inspection, Control and Job Evaluation Syste
m
1
Unscheduled submission of
sample materials by
contractors
●
2
The process of requesting
and approving samples of
materials by the old owner
●
3
The process of testing and
evaluating the material test
of the owner is not relevant
●
4
The work permit approval
process is lengthy
●
5
Failure of the contractor to
carry out the work
●
6
Many work results have to
be repaired / redone because
of defects / incorrect
●
7
The process and procedures
for evaluating the progress
of the work took a long time
and through an agreed time
●
F
Other Aspects (Aspects beyond the capabilities of
the owner and contractor)
1
The physical condition of
the project work field turned
out to be not as expected
●
2
Transportation to project
sites is difficult
●
3
Unforeseen things happen
such as fire, flood,
earthquake, landslide
●
4
There was riot / damage,
war
●
5 There was a labor strike ●
6
The occurrence of damage /
damage due to negligence or
actions of third parties
●
7
Changes in the government's
political / economic
situation or policies
●
2.3 Analytical Hierarchy Process
(AHP)
Thomas L. Saaty stated: “Analytical Hierarchy
Process is a way that may produce a framework for
overcoming troubles in a selection without making
assumptions that are regarding independence among
better and weaker stages of factors”. The definition
of the hierarchy is a illustration of a complicated
hassle in a multi-stage shape in which the primary
stage is the aim with the stages of elements, criteria,
ICE-TES 2021 - International Conference on Emerging Issues in Technology, Engineering, and Science
192
and sub- criteria. Hierarchy will remedy the
complicated hassle with interpreting it into a few
organizations that are organized right into a
hierarchical shape. Then, the ones troubles will seem
greater established and systematic. Risk thing fee is
then performed, which may be calculated with the
subsequent in equation 1.
= + − ( )
(1)
Where:
FR = Risk Factor, scale 0
-1 L = Risk Probability
I = Risk Impact
3 RESEARCH METHOD
3.1 Research Framework
This study uses a survey method in the form of a
questionnaire which is conducted by analyzing
research and final assignments that have been
carried out in the field of project management,
especially building construction projects. Then the
next step is to find factual information about the
conditions that occur in the Playfield Preschool
project with a survey method in the form of an
interview.
The purpose of this study is to identify risk
factors of delays that occur in the implementation of
the Summarecon Serpong Playfield Preschool
project. So that from this research, it is obtained the
order of the levels of delay factors that affect all
project performance.
The survey method in this study was conducted
to determine the dominant factors that occurred. The
survey was conducted with two types, in the first
type the distribution targets were people who
worked on the Playfield Preschool project
(contractors, consultants and site managers) and for
the second type were academics who had skills in
the field of project management. Furthermore, from
the results of the questionnaire will be compared and
found the factors that cause delays that most affect
project implementation. The questionnaire process
will explain the type of this research, the research
stages will be described as follows:
1.
Formulating problems based on previous
research studies. Then determine the concepts
and research hypotheses on which to base. The
questionnaires collected previously were
grouped into several main areas:
a.
Labor;
b.
Materials and equipment;
c.
Characteristics of the place;
d.
Managerial;
e.
Finance;
f.
Other factors.
2.
Distributing questionnaires to people who
have capabilities in the field of construction
management and Playfield Preschool project
workers (contractors, consultants and site
managers). Then compare the results of the
two questionnaires.
3.
The final stage is to determine priority risk
factors with descriptive analysis conducted by
interviewing Playfield Preschool project
workers (contractors and site managers).
3.2 Research Variables
The dependent variable in this study is the time
delay that may occur in the project as shown at
Table 2.
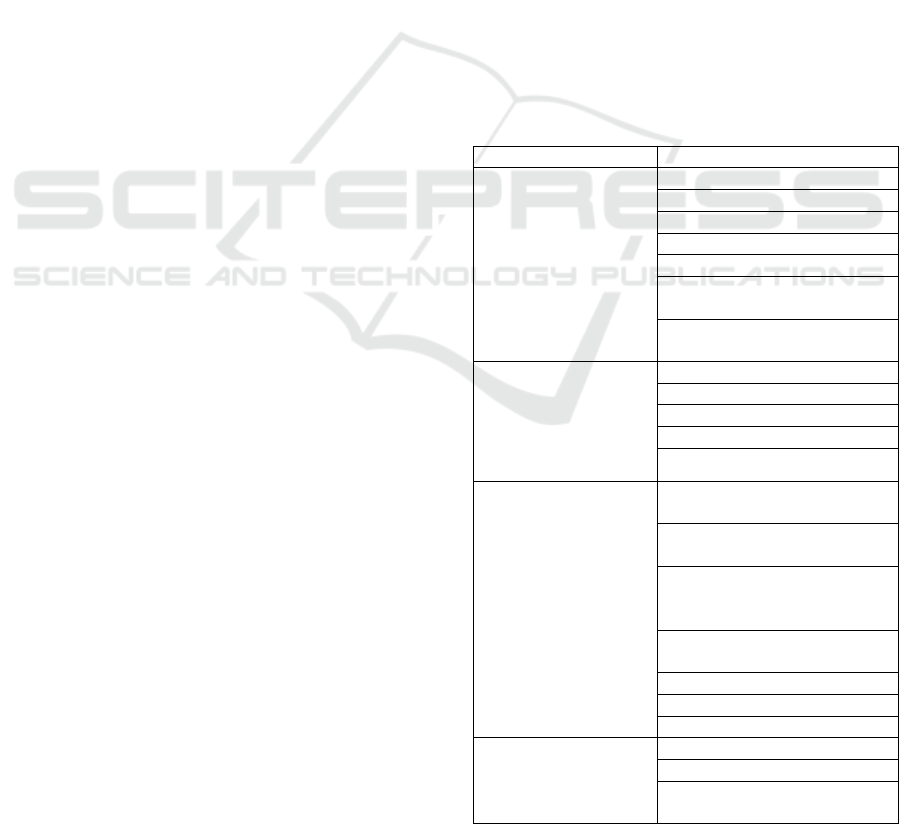
Table 2: Delay risk factors variables.
Category Sub Variable
1. Labors
1.1 Workforce expertise
1.2 Labor discipline
1.3 Work motivation
1.4 Absence rate
1.5 Availability of labor
1.6 Replacement of a new
workforce
1.7 Communication between
workforce and advisory bodi
2. Materials and
equipment
2.1 Delivery of materials
2.2 Availability of materials
2.3 Quality of ingredients
2.4 Availability of equipment
2.5 Quality of equipment
3. Characteristics of
the site
3.1 Surface and below ground
conditions
3.2 Visions or responses to
the surrounding environment
3.3 Physical characteristics of
buildings around the project
site
3.4 Storage of materials /
materials
3.5 Access to the project site
3.6 Workspace requirements
3.7 Project location
4. Managerial
4.1 Project supervision
4.2 Quality of job control
4.3 Experience of field
managers
Identification of Risk Factors for Delayed Time Schedule in Summarecon Serpong Playfield Preschool Project
193

Table 2: Delay risk factors variables (cont.).
Category Sub Variable
4. Managerial
4.4 Calculation of material
requirements
4.5 Design changes
4.6 Communication between
consultants and contractors
4.7 Communication between
contractor and owner
4.8 Schedule for delivery of
materials and equipment
4.9 Schedule of work to be
completed
4.10 Preparation /
determination of site design
5. Finance 5.1 Payments by owner
5.2 Material prices
6. Other factors 6.1 Rainfall intensity
6.2 Economic conditions
6.3 Work accidents
6.4 Pandemic
3.3 Research Instruments
The measurement instrument of this study is about
the level of respondents' perceptions of the
probability and impact of the delay factors given in
the questionnaire on the development process of the
Playfield Preschool Summarecon Serpong. The data
collection tools or instruments in this study used an
ordinal scale from 1 to 5 as shown in Table 3. Then
for the independent variables used on the probability
and impact of respondents can be seen in Table 4
and Table 5.
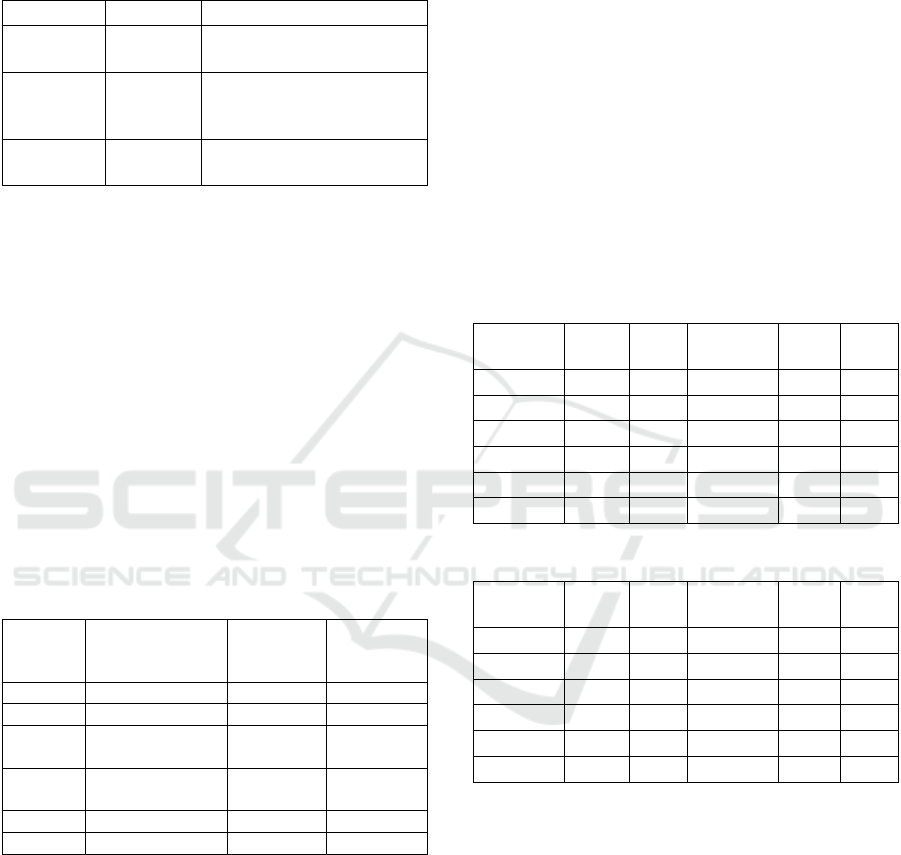
Table 4: Probability scale variable.
Scale Rating Information
1
Very small
It will be very unlikely to
happen
2
Small
It is unlikely that this will
happen
3 Moderate
It is equally likely that it
happened or did not happen
4 Big Most likely it could happen
5 Very large
It is certain that it will be
possible
Table 5: Variables of impact scale.
Scale Rating Information
1 Very small
Impossible so it doesn't affect time
(no delay)
2 Small
There was a delay of 2 days in a
period of 4 weeks
3 Moderate
There was a delay of 3-4 days in a
period of 4 weeks
4 Big
There was a delay of 4 - 5 days in a
period of 4 weeks
5 Very large
There was a delay of 6 - 7 days in a
period of 4 weeks
3.4 Analytical Hierarchy Process (AHP)
Analytical Hierarchy Process (AHP) will be
considered in this research. This method is used to
determine the quality or value of risk factors that may
affect the project from the most influential or domi-
nant to the small one. Quantitative data were obtained
from tabulations. This will be analyzed to determine
which factors have the most influence on project
delays depending on the respondent's experience in
working on the project. Table 6 shows the numerical
ratings that will be used in the AHP method.
Table 3: Instrument Scale.
Probability Impact
1 2 3 4 5 1 2 3 4 5
Table 4 displays a scale for the respondents to
provide an opinion on the probability that can occur if
the delay factor occurs in the project. In Table 5 a
scale is displayed for respondents who can give their
opinion on the impact of the time delay that occurs if
the delay factor occurs in the project. Linkert's five-
point scale is used because it can align conflicting
goals and offer sufficient choice because there are two
or three choices that measure the strength of an
opinion. In addition, some previous studies have
recommended the use of this scale. Dillman et al.
(2009).
Table 6: Numerical rating (Source: Saaty's Scale of
Relative Importance (2005)).
Scale Numerical Rating Reciprocal
Extremely Preferred 9 1/9
Very Strong Extremely 8 1/8
Very Strongly Preferred 7 1/7
Strongly to Very Strongly 6 1/6
Strongly Preferred 5 1/5
Moderately to Strongly 4 1/4
Moderately Preferred 3 1/3
Equally to Moderately 2 1/2
Equally Preferred 1 1
ICE-TES 2021 - International Conference on Emerging Issues in Technology, Engineering, and Science
194
Risk Category is a method to determine risk into
groups based on the level of risk and to determine
the category of these variables by using Table 7.
Table 7: Risk category (Source: RSNI (2006)).
FR Value Category Handling Steps
>0.7 High Risk
Risk reduction must be
carried out to a lower level
0.4 – 0.7
Average
Risk
Improvement steps are
needed within a certain
period
<0.4 Low Risk
Corrective steps are taken
whenever possible
4 ANALYSIS
Based on the objectives of the descriptive analysis,
each category was separated into its own level. Then
each table from the tabulation results of the
questionnaire data will be corrected for some
differences. The comparison between type I and type
II questionnaires depends on the highest mean value
of each category for both types of questionnaires. In
Table 8 the results of tabulation of data from each
type of questionnaire which are sorted by the largest
mean value to the smallest mean value, so that the
ranking of each type of questionnaire is obtained.
Table 8: Results of type I dan type II questionnaire data
tabulation.
Ranking Category
Mean Value
Type 1
Mean Value
Type 2
1 Finance 9.8 12.514
2 Labor 8.286 11.4
3
Site
Characteristics
8.286 10.8
4
Materials and
Equipment
7.8 10
5 Other Factors 7.25 9.62
6 Managerial 6.54 8.971
As seen in Table 8, the project delay category
ranking on the two types of questionnaires is
different, where in the type I questionnaire the
financial category has the highest mean value while
in the type 2 questionnaire it is the labor category
that has the highest mean value. This difference is
due to the type II questionnaire obtained from
academics with various experiences in project
management, had an effect on the project was the
financial category and the labor category. After
interviewing Playfield Preschool project workers,
according to them the factor category that most often
became a factor for delays in project implementation
was the financial category.
Differences of opinions can arise due to
differences in place, equipment and workers due to
the timing of the project. Thus, from the results of
these comparisons, the focus of testing the
Analitycal Hierarchy Process (AHP) is the financial
category.
4.1 AHP Analysis Result
The paired matrix will analyze the probability and
impact, so that the paired comparison matrix is
obtained. Then, the form will get 5 (five) element
values to be compared. Table 9 and Table 10 show
the paired matrix
Table 9: Impact pairwise comparison matrix.
Very
High
High Moderate Low
Very
low
Very high 1 3 5 7 9
High 0.33 1 3 5 7
Moderate 0.2 0.33 1 3 5
Low 0.14 0.2 0.33 1 3
Very low 0.11 0.14 0.2 0.33 1
Amount 1.78 4.67 9.53 16.33 25
Table 10: Probability pairwise comparison matrix.
Very
High
High Moderate Low
Very
low
Very high 1 3 5 7 9
High 0.33 1 3 5 7
Moderate 0.2 0.33 1 3 5
Low 0.14 0.2 0.33 1 3
Very low 0.11 0.14 0.2 0.33 1
Amount 1.78 4.67 9.53 16.33 25
4.1.1 Element Quality
Calculation of the quality of the elements in each
element of the matrix, both the quality of the
elements on the impact and the quality of the
elements on the infrastructure and project field
conditions encountered.
The results obtained from questionnaire II data
for the category of the highest tardiness factor were
the labor category then the material and equipment
category, while the Playfield Preschool project
workers argued that the category of late factors that
probability. The results of the calculation of the
impact element quality are shown in Table 11.
Identification of Risk Factors for Delayed Time Schedule in Summarecon Serpong Playfield Preschool Project
195
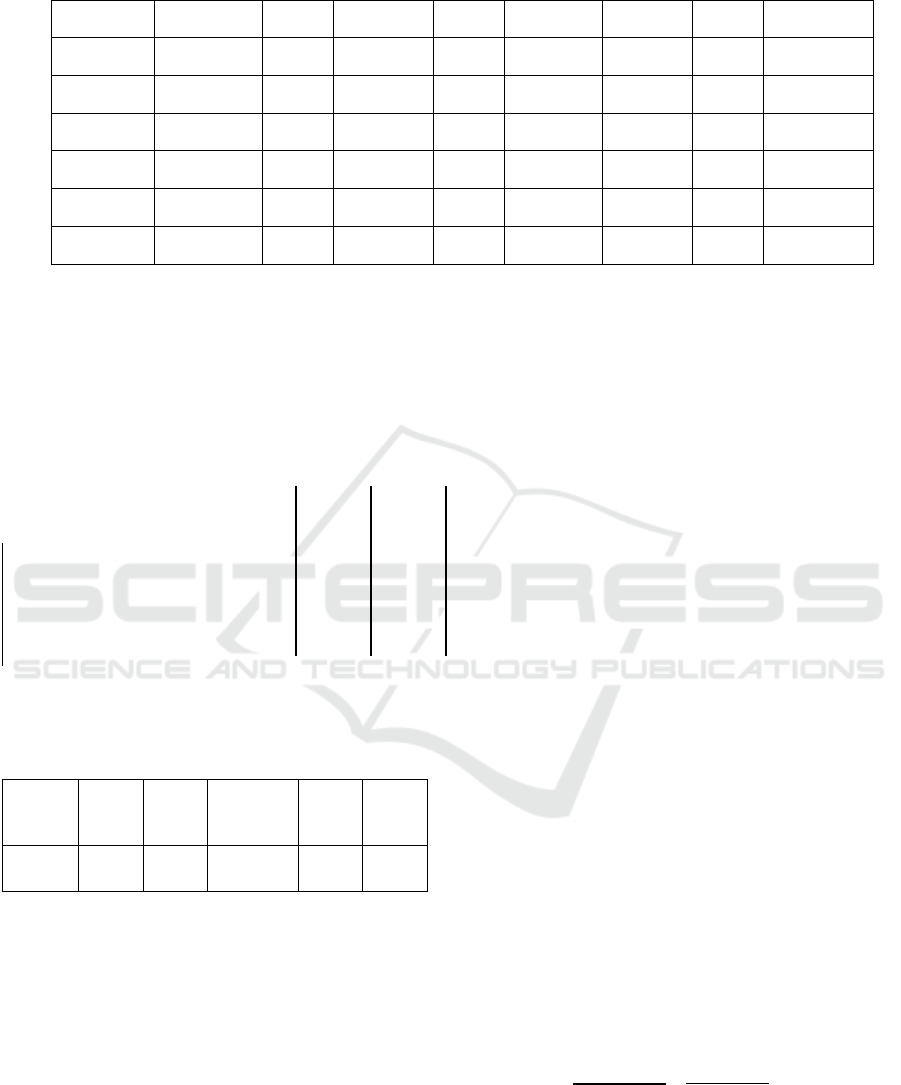
Table 11: Calculation quality element of impact and probability.
Very High High Moderate Low Very low Amount Mean Percentage
Very high 0.562 0.642 0.525 0.429 0.360 2.518 0.504 100.00
High 0.185 0.214 0.315 0.306 0.280 1.301 0.260 51.66
Moderate 0.112 0.071 0.105 0.184 0.200 0.672 0.134 26.68
Low 0.079 0.043 0.035 0.061 0.120 0.337 0.067 13.40
Very low 0.062 0.030 0.021 0.020 0.040 0.173 0.035 6.87
Amount 1.000 1.000 1.000 1.000 1.000 5.000 - -
0.562 0.642 0.525 0.429 0,360
0.185 0.214 0.315 0.306 0,280
0.112 0.071 0.105 0.184 0,200
0.079 0.043 0.035 0.061 0,120
0.062 0.030 0.021 0.020 0,040
1 3 5 7
0,504
2,739 0,504 = 5,440
0,33 1 3 5
0,260
1,409 0,260 = 5,416
0,2 0,33 1 3 x 0,134 = 0,696 : 0,134 = 5,183
0,14 0,2 0,33 1
0,067
0,338 0,067 = 5,011
0,11 0,14 0,2 0,33
0,035
0,176 0,035 = 5,074
Ammount 26,124
Figure 1: Matrix Consistency and Hierarchy Test.
Table 12: Quality elements of impact and probability.
Very
low
Low Moderate High Very
High
Quality 0.069 0.134 0.267 0.504 1.000
The calculation of element quality in the
probability element matrix is carried out in the same
way as the impact element matrix shown in Table 13
and Table 14.
4.1.2 Consistency and Hierarchy Test
The results in Table 12 must have the same diagonal
and consistent values. In finding a consistent value,
the maximum eigenvalues (λ
max
) must be close to
the
number of elements (n) and the eigenvalues
remain zero.
The figures for each row is 0.504; 0.260; 0.134;
0.067; and 0.035. The vector of the column will be
multiplied by the original matrix, giving the value of
each row. Then, each value will be divided by the
value of the vector concerned. Therefore, it is
necessary to calculate the consistency ratio based on
Table 13.
a.
Consistency Index (CI)
Based on Table 13 the value of n (Criteria total /
Order matrix) = 5,. Thus, the RI value for n = 5 is
1.12.
CI =
(λmaks – n)
=
(5,225 – 5)
= 0.056
(−1) (5−1)
ICE-TES 2021 - International Conference on Emerging Issues in Technology, Engineering, and Science
196
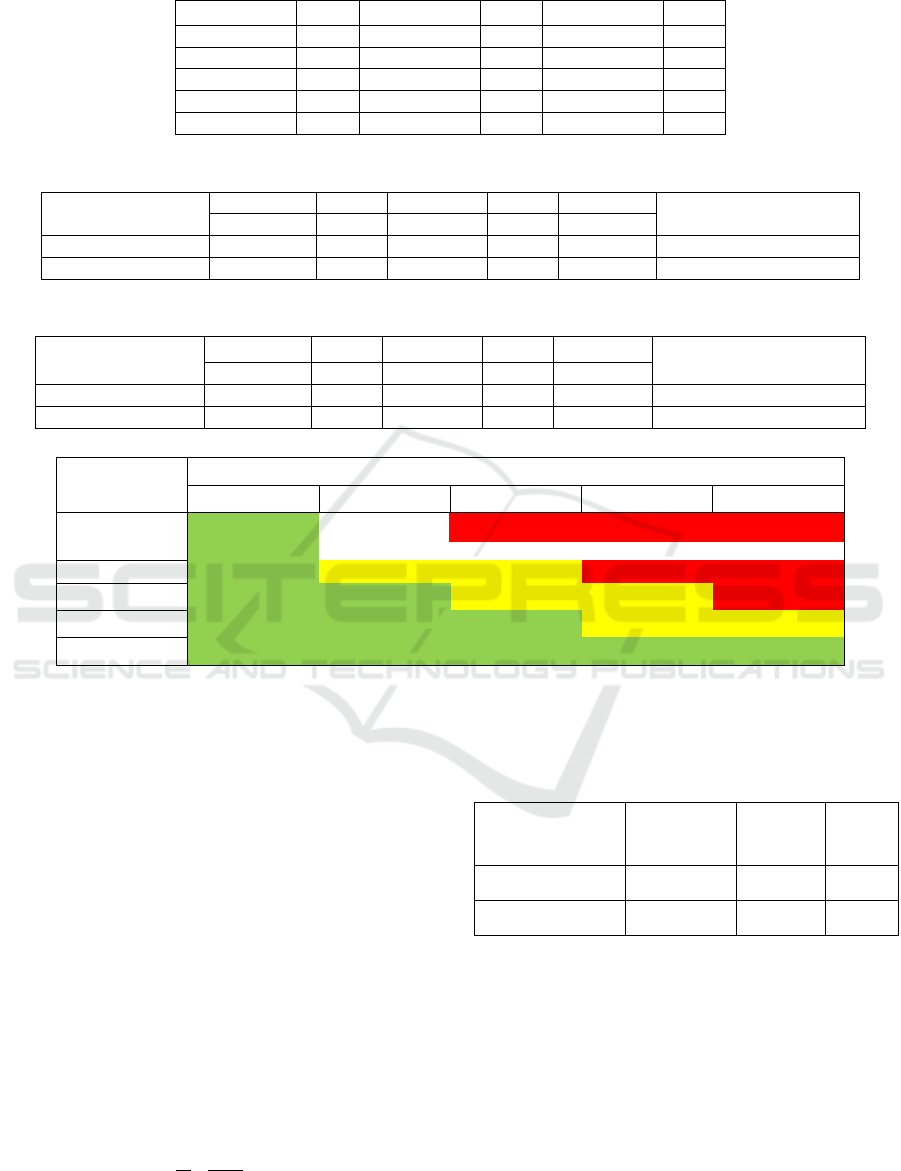
Table 13: Consistency random index value (CRI).
Ordo Matrix RI Ordo Matrix RI Ordo Matrix RI
1 0 6 1.24 11 1.51
2 0 7 1.32 12 1.48
3 0.58 8 1.41 13 1.56
4 0.9 9 1.45 14 1.57
5 1.12 10 1.49 15 1.59
Table 14: Probability mean value.
Financial Category
Very High High Moderate Low Very low
Probability Mean Value
1.000 0.518 0.267 0.135 0.069
Payment by owner 0 2 2 1 0 0.431
Material prices 0 0 1 3 1 0.148
Table 15: Average value of impact.
Financial Category
Very High High Moderate Low Very low
Average Value of Impact
1.000 0.518 0.267 0.135 0.069
Payment by owner 3 1 0 1 0 0.731
Material prices 0 0 3 2 0 0.214
Probability
Impact
Very Low Low Moderate High Very High
Very
High
High
Moderate
F 5.1
Low F 5.2
Very Low
Figure 2: Qualitative risk analysis. Factor (F) Description: F 5.1 Payment by owner, F 5.2 Prices for materials.
4.2 Risk Factor Value Analysis
After obtaining the average value of the impact and
probability, the next step is to calculate the risk
factor by using equation 2.
= + − ( )
(2)
The result of the calculation of the consistency index
(CI) is 0.056 which indicates that the calculation is
consistent because <0.1 where 0.1 is the critical limit
of consistency.
b.
Consistency Ratio (CR)
The calculation of the consistency ratio is carried out
to ensure that (CR) is less than 10%. If the CR value
is greater than 10%, the comparison matrix needs to
be improved.
CR =
CI
=
0,056
= 0.05
RI 1,12
Table 16 shows the recapitulation of the value
results of the aggregate variables/risk events.
Table 16: Value of risk factors.
Financial Category
Probability
Mean Value
Average
Value of
Impact
Risk
Factor
(RF)
Payment by owner 0,431 0,731 0,847
Material prices 0,148 0,214 0,33
The result of the calculation of the consistency
ratio is 0.05 which when viewed in the form of a
presentation of 5%. This result is less than 10%, so
the hierarchy is consistent and the level of accuracy
is high.
c.
Average Value of Impact and Frequency
After passing the test of consistency, hierarchy and
accuracy, the next step is to determine the average
value of the impact and probability. The calculation
results are shown in Table 14 and Table 15.
Identification of Risk Factors for Delayed Time Schedule in Summarecon Serpong Playfield Preschool Project
197

After calculating the risk factor value of each
probability and impact, the rating scale uses RAM.
Then an analysis of the probability of each factor
that occurs and its impact is carried out to determine
the level of risk. Qualitative risk assessment can also
help to determine whether these factors require
special attention, so that in the future this delay
factor can be minimized. Figure 2 gives the
qualitative risk analysis matrix.
4.3 Risk Category Analysis
Risk category analysis is a way to determine risk
categories into groups based on the level of risk that
occurs. In determining it, the risk category table is
used which is shown in Table 17.
Table 17: Results of the risk category in the financial
category with AHP.
Financial Category Risk Factor Risk Level
5.1 Payments by Owner 0,847 High
5.2 Prices for Materials 0,33 Low
5 RESULTS AND DISCUSSION
Discussion of the AHP method, based on the results
of Table 17, it is known that the payment by the
owner of the financial category is a factor that
greatly influences the implementation of the
Playfield Preschool project, resulting in delays. This
is supported by interviews from Playfield Preschool
project workers where the owner is often late in
making payments so that project implementation is
hampered because as a result of the late payment the
goods / materials that are used up should be
immediately repurchased instead of being delayed
due to lack of funds to buy materials. So it is
necessary to review the applicable contract, so that it
can be seen that the delay was caused by the
contractor or from the owner.
Apart from the factor of payment by the owner,
the delay due to indiscipline of workers from the
labor category ranks the second factor that
influences the delay in this Playfield Preschool
project. According to the site manager and the field
contractor, the delay is also caused by the
indiscipline of the workers which makes the
implementation process slow down, because
workers are often found lying about the number of
attendances on one day at a project site, there are 15
workers and in the afternoon it is reduced to 12, the
following day workers reduced to 10 people. This
happens every day in this Playfield Preschool project
because the worker contract system is daily, not
wholesale. Where this hampers the implementation
of project work, because it is ineffective and
inefficient.
Then the third rank factor which affects the delay
in the Playfield Preschool project is the opinion /
response of the surrounding environment from the
place characteristics category. The location of the
Playfield Preschool project which is located in the
shopping center / mall area is one of the inhibiting
factors, because the process of transporting goods
needs to be carried out outside the operational hours
of the shopping center/mall. Opinions/responses
from the mall are very influential in the project
implementation process, where if there is damage to
the project area it is necessary to communicate
between the site manager /contractor and the mall.
Often the mall is slow in dealing with existing
project location problems, such as a leak at the
project site, it took a long time to finally be handled
by the mall.
6 CONCLUSIONS
From the analysis and discussion above, it can be
concluded that of the 6 categories of delay: Labor,
Materials and Equipment, Place Characteristics,
Managerial, Financial and Other Factors. The most
influential factor of the delay is the financial
category, especially an indicator of late payment by
owners.
There are difference of opinions on the category
of tardiness that is most influential according to the
Playfield Preschool project workers and academics.
This is because the academics are the stakeholders
on a wide range of construction projects with
varying field conditions, while the Playfield
Preschool project workers give their opinion on what
is happening on the project site.
REFERENCES
Dillman, D. A., Phelps, G., Tortora, R., Swift, K., Kohrell,
J., Berck, J., & Messer, B. L. (2009). Response Rate
and Measurement Differences in Mixed-Mode
Surveys Using Mail, Telephone. Interactive Voice
Response (IVR) and the Internet, Social Science
ICE-TES 2021 - International Conference on Emerging Issues in Technology, Engineering, and Science
198

Research 38(1). Elsevier Inc.: 1–18,
doi:10.1016/j.ssresearch.2008.03.007.
Ervianto, W. (2005). Manajemen Proyek Konstruksi.
Yogyakarta: Salemba Empat.
Pinori, Mickson, et al. (2015). Analisis Faktor
Keterlambatan Penyelesaian Proyek Konstruksi
Gedung Terhadap Mutu, Biaya Dan Waktu Di Dinas
Pekerjaan Umum Kota Manado. Jurnal Ilmiah Media
Engineering 5(2).
Wang, F. (2013). The High-Speed Railway Construction
Project Quality Risk Management Theory and
Practice. Railway Engineering Construction
Management of Exploration and Practice. Tsinghua
University Press, Beijing.
Widhiawati, I. A. R. (2012). Analisis Faktor-Faktor
Penyebab Keterlambatan Pelaksanaan Proyek
Konstruksi, Majalah Ilmiah Teknik Elektro 8(2),
doi:10.24843/10.24843/MITE.
Smith et al. (1999). Small to Medium Contractor
Contingency and Assumtion of Risk, Journal of
Consruction Engineering and Management.
ASCE.125.
Identification of Risk Factors for Delayed Time Schedule in Summarecon Serpong Playfield Preschool Project
199
