
The Experimental Study of Optimum Thickness on Riprap Layer
Design
Dea Lidya
a
, Robby Yussac Tallar
b
and Alexander Yovan Suwono
c
Civil Engineering Department, Maranatha Christian University, Jl. Surya Sumantri 65 Bandung, Jawa Barat, Indonesia
Keywords: Riprap, Riprap Layer Thickness, Scouring.
Abstract: Flow velocity in rivers may have significant effects on flow pattern and velocity distribution, especially for
horizontal flow. In river engineering, hydraulics engineering, and river restoration project, it is essential to
consider in the analysis if there is a change or modification in the waterway such as the pier of the bridge.
The existence of a bridge pier causes a change in the pattern of river flow to vertical water flow, this can
cause local scouring. Riprap is one of the protection methods concerning local scouring. Therefore, the main
purpose of this study is to determine the optimum thickness of the riprap layer within a certain diameter in
the flow under clear water conditions and under sediment-based riprap layer. The experimental study was
used to inquire the resulted optimum thickness on the riprap layer design. This study used a cylindrical-
shaped of bridge pier to study the scouring pattern, failure mechanism, and riprap stability. This study
offered several scenarios. The result indicated that the thickness of the riprap layer affected the depth of
local scouring. Further study, it is essential to investigate the relationship among variables of riprap, pier,
hydraulics characteristics. The application of the riprap design method is very useful for the long-term
protection of river structures.
a
https://orcid.org/0000-0003-2023-7788
b
https://orcid.org/0000-0001-7307-3348
c
https://orcid.org/0000-0002-2577-8519
1
INTRODUCTION
A river has consisted of water flow and flow
velocity where moves from the upper area to the
lower area, flow velocity in rivers may have a
significant effect on flow patterns, especially for
horizontal flow. River engineering can be defined as
the design and implementation of river works and
river restoration (Tallar & Suen, 2017). The
existence of a bridge pier causes a change in the
pattern of river flow to vertical water flow, this can
cause local scouring. There are two types of local
scouring, specifically, live bed scour and clear water
scour. This study used clear water scour. Scouring is
usually interpreted as a local phenomenon, it
includes degradation that can cause erosion over a
considerable length of a river, scouring on the bridge
pier occurs when the base material is carried away
by water flow (Arneson, Zevenbergen, Lagasse, &
Clopper, 2012), if this happens continuously will
cause the failure of the bridge which can endanger
the construction of the bridge.
The engineering method used to solve the
scouring problem of the pier is to place the riprap
around the foundation. Riprap is defined as a layer
of facing rock that protects from erosion. Riprap has
consisted of a well-graded mixture of rock, broken
concrete, or other material, usually dump or hand-
placed, therefore the riprap should be hard, durable,
and dense. In addition, it should be resistant to
weathering, free from overburden, spoil, shale, and
organic material. The thickness of the riprap layer
affects the depth of the scour, it has criteria depends
on the diameter of the rock is used.
The problem of analysing scouring through the
pier appears deceptively easy, perhaps because it has
been oversimplified by assuming a horizontal
channel and flow at the normal depth parallel to the
bed (Guan, Chiew, Wei, & Hsieh, 2019). In reality
the bed level will vary considerably so that the depth
becomes almost meaningless, while the flow may
not be at the normal depth (Tallar & Suen, 2015).
180
Lidya, D., Tallar, R. and Suwono, A.
The Experimental Study of Optimum Thickness on Riprap Layer Design.
DOI: 10.5220/0010747700003113
In Proceedings of the 1st International Conference on Emerging Issues in Technology, Engineering and Science (ICE-TES 2021), pages 180-183
ISBN: 978-989-758-601-9
Copyright
c
2022 by SCITEPRESS – Science and Technology Publications, Lda. All rights reserved
It is sometimes assumed that scour will be a
problem only when the bed material consists of fine
cohesionless material. This is not true: ultimately the
scour depth in cohesive or cemented soils can be just
as large, it merely takes longer for the scour hole to
develop. For example, under constant flow
conditions, scour will reach maximum depth in sand
and gravel in a matter of hours (perhaps during one
flood); in cohesive materials it will take days;
However, the biggest and most frequently
encountered scour-related problems usually concern
loose sediments that are easily eroded. Scouring is a
very serious problem. Floods that result in scour are
the principal cause of bridge failure.
2
EXPERIMENTAL SET UP AND
SCENARIO
An experimental study to specify the optimum
thickness of the riprap layer effected on the depth of
local scouring.
Figure 1: Experimental set up (top view and side view).
2.1 Sediment Sieve Analysis
The sediment factor at bridge piers includes particle
size distribution, basic sediment type, and the spatial
distribution of sediment size. The difference in basic
sediment affects scouring behavior. For example for
coarse-grain soil and fine grain soil, scouring behavior
will be different although the distribution particle. The
purpose of sediment sieve analysis is to specify the
distribution or gradation of the sediment used.
Table 1: Sediment sieve analysis result.
No. Sieve
Retained
Wei
g
ht
(g
ram
)
Soil Retained
(
%
)
No. 4 83 8.34
No. 8 144 14.47
No. 16 168 16.88
No. 50 349 35.08
No. 100 169 16.98
No. 200 37 3.72
Pan 45 4.52
∑ Restrained Weight 995
From data (Table 1) by using Soil Classification
Chart, it is classified that sediment is categorized in
Poorly Graded Sand.
2.2 Riprap Sieve Analysis
The riprap sieve analysis is to specify the dr
50
on
riprap. dr
50
is the middle value of riprap size from
the
aggregate grading curve.
Table 2: Riprap sieve analysis result.
No. Sieve
Retained
Weight (gram)
Soil Retained
(%)
19,11 mm 0 0.00%
12,7 mm 1635.2 81.87%
9,52 mm 288.5 96.32%
4,75mm
(
No. 4
)
55.2 99.08%
2,36mm
(
No. 8
)
0.2 99.09%
1,18mm(No. 16) 0.6 99.12%
0,6 mm (No.30) 2 99.22%
0,3 mm(No. 50) 1.1 99.27%
0,15mm
(
No. 100
)
4.1 99.48%
0,075mm(No. 200) 5.4 99.75%
Pan 5 100.00%
∑ Restrained Weight 1997,3
From data (Table 2) by using Aggregate
Distribution Curve, then we get dr
50
is 10,5 mm, dr
50
determines the riprap layer thickness (t), which t =
2dr
50
- 3dr
50
2.3 Riprap Layer Thickness
The riprap layer thickness depends on the size of the
aggregate, which has been calculated above dr
50
is
10,5 mm. According to Melville and Coleman
(2000), some recommendations in the placement of
riprap around bridge piers.
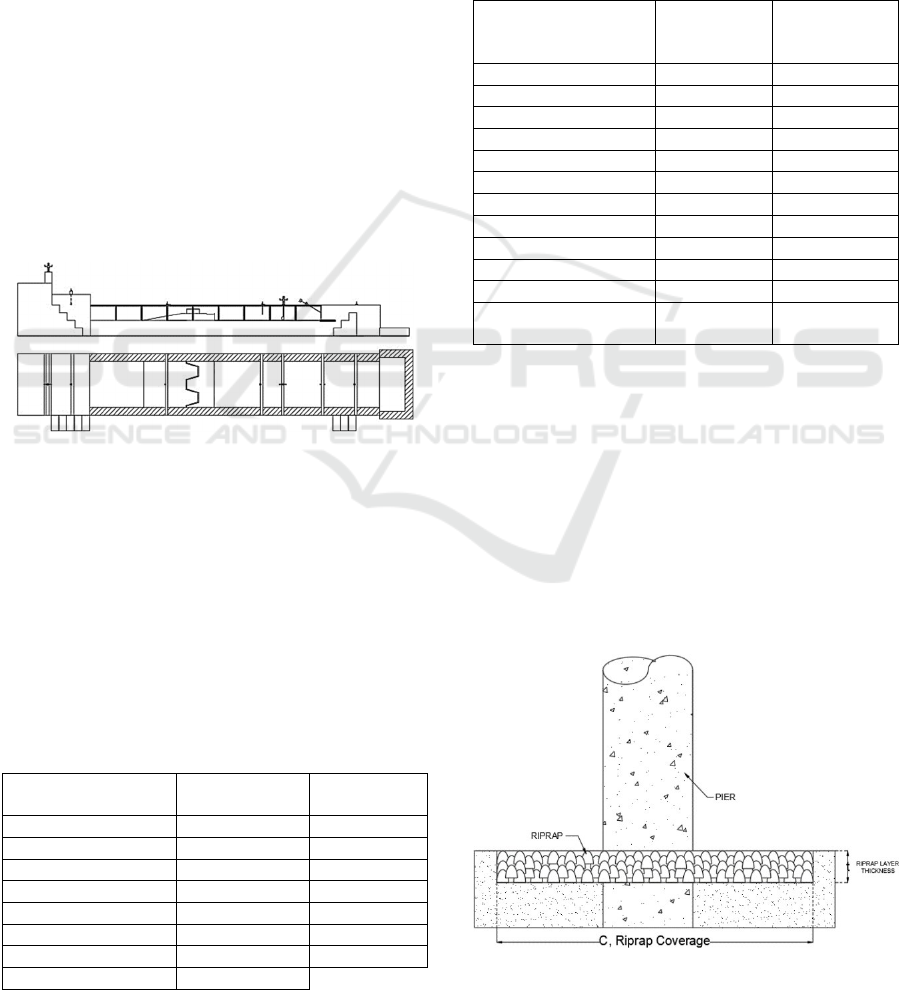
Figure 2: Detail sketch of the riprap layer.
The Experimental Study of Optimum Thickness on Riprap Layer Design
181
The riprap layer thickness (t) = 2dr
50
- 3dr
50
.
Riprap coverage (C) = 3 – 4 diameters of pier The
riprap layer thickness effects the depth of local
scouring.
In Figure 2 the diameter of pier is eight
centimeters (80 mm) and the riprap coverage (C) is twenty-
eight centimeters (280 mm) and scenario (Table 3).
Table 3: Scenarios of study.
Scenario Riprap Layer Thickness
Scenario 1 22 mm
Scenario 2 26 mm
Scenario 3 30 mm
3
RESULTS AND DISCUSSION
The result indicated that the thickness of the riprap
layer effected on the depth of local scouring. Figure
3 to 5 shows the contour pattern and Figure 6 shows
before and after the experiments.
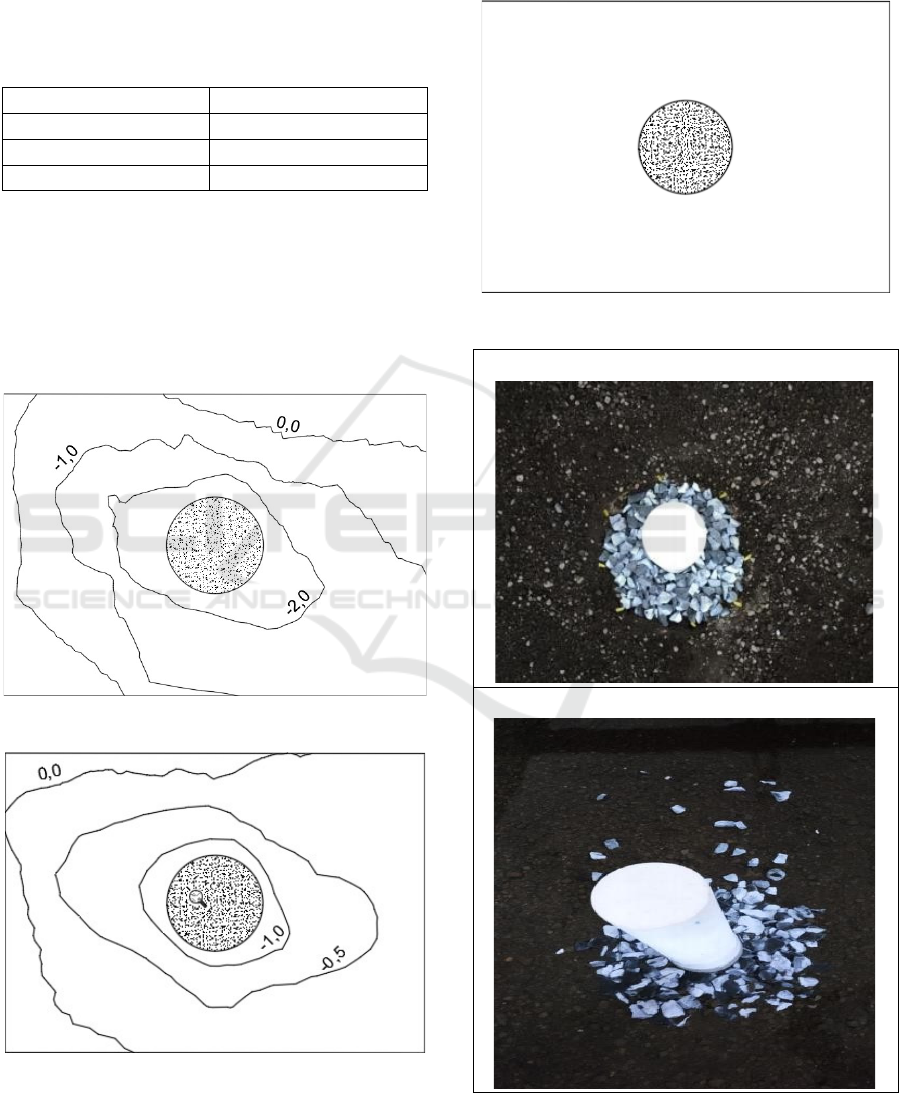
Figure 3: Grind Contour Scenario 1.
Figure 4: Grind Contour Scenario 2.
In scenario 1 there is scouring around the piers
and has a deepest point of -2 cm. In scenario 2 there
is scouring on the side of the piers and has a deepest
point -1 cm. In scenario 3 there is no scouring
around, the sediment remains unchanged at -3,0 cm
according to the planned riprap layer depth.
Figure 5: Grind Contour Scenario 3.
Before (a)
After (b)
Figure 6: Modeling in the laboratory before and after the
experiment.
ICE-TES 2021 - International Conference on Emerging Issues in Technology, Engineering, and Science
182

Table 4 gives the results of the riprap experiment
scenarios.
Table 4: Results of the riprap experiments.
Scenario d
s
Information
Scenario 1 -2
Partial failure, there is scour
around the piers and the area the
layer changes in thickness
Scenario 2 -1
There is scouring on the side of
the piers, riprap rock on the side
right and left of the pier carried
by the flow towards the
downstream of the pier
Scenario 3 0
No significant failures were seen,
the seams were thinned in some
areas but still provided full
protection to the piers
4
CONCLUSIONS
In this paper local scouring around a circular bridge
pier has been examined experimentally under clear
water scouring and under sediment-base riprap layer.
This research has looked at certain aspects of riprap
design like the size of stone, systematically
investigates flow, sediment, and pillar parameters
against scouring.
Each parameter involved in the riprap layer
performance of the pillar is identified visually.
Results of this study show that the optimum
thickness is at 30mm because there is no significant
failures were seen and increasing the riprap size has
a significant effect on depth scour.
ACKNOWLEDGEMENTS
The authors gratefully acknowledge the support for
this study provided by Civil Engineering
Department, Maranatha Christian University,
Indonesia, and with LPPM (Lembaga Penelitian dan
Pengabdian Masyarakat) Maranatha.
REFERENCES
Arneson, L. A., Zevenbergen, L. W., Lagasse, P. F., &
Clopper, P. E. (2012). Evaluating scour at bridges.
National Highway Institute (US).
Guan, D., Chiew, Y.-M., Wei, M., & Hsieh, S.-C. (2019).
Characterization of horseshoe vortex in a developing
scour hole at a cylindrical bridge pier. International
Journal of Sediment Research, 34(2), 118–124.
Tallar, R. Y., & Suen, J.-P. (2015). Identification of
waterbody status in Indonesia by using predictive
index assessment tool. International Soil and Water
Conservation Research, 3(3), 224–238.
Tallar, R. Y., & Suen, J.-P. (2017). Measuring the
aesthetic value of multifunctional lakes using an
enhanced visual quality method. Water, 9(4), 233.
The Experimental Study of Optimum Thickness on Riprap Layer Design
183
