
Experimental Study on Velocity Profiles Due to Ecological Barriers
Robby Yussac Tallar
a
and Teofilus Sawang
b
Civil Engineering Department, Maranatha Christian University, Jl. Surya Sumantri 65, Bandung, Jawa Barat, Indonesia
Keywords: Ecological Barriers, Experimental Study, Velocity Profiles.
Abstract: Streams are very complex system. In stream restoration projects, the existence of ecological structures
should be considered as an important variable in the project. A lot of previous research focused on
ecological aspects only, therefore the main purpose of this paper is to examine the velocity profile due to
ecological barriers in downstream area of weir. A laboratory study to investigate the effect of ecological
barriers in terms of velocity profile in 8 m length x 40 cm width a rectangular channel is presented. The
study consists of an extensive set of rectangular flume experiments for flows with certain The results show
that the average velocity (v=0.35 m/sec) was occurred for without ecological barriers condition. By
comparing the scenarios, this study showed that ecological barriers (dl = 25 cm) has the highest velocity (v
= 0.41m/s), meanwhile scenario 5 (v=0.36 m/s) has the nearest velocity with the scenario 1 (v=0.35 m/s). It
indicated that the existence of ecological barriers had given the higher velocities in streams. The distance
length between ecological barriers showed that the farther the distance length used the lower the formed
velocity profiles.
a
https://orcid.org/0000-0001-7307-3348
b
https://orcid.org/0000-0002-9861-8831
1
INTRODUCTION
Streams are a very complex system (Stanford,
Zavaleta, & Millard-Ball, 2018). Not only are the
hydraulic properties complex, but so are the
implications of those properties. Many experts such
as stream engineers, geomorphologists, civil
engineers and ecologists may share a similar
opinion, especially when identifying the variable and
complex stream that includes ecological aspects, can
take place over time and across stream areas
(Magilligan, Nislow, Kynard, & Hackman, 2016;
Rinaldi, Gurnell, Del Tánago, Bussettini, &
Hendriks, 2016; Tallar & Suen, 2015). In stream
restoration projects, the presence of ecological
structures should be seen as an important variable in
the project. Much earlier research has focused on
environmental issues (Chang, 2008; Rosgen &
Silvey, 1996; Tallar & Suen, 2017). Therefore, the
main aim of this paper is to study the velocity profile
due to ecological barriers in the area downstream of
the stream.
The scopes of this study consisted of the research
was conducted in open channel with steady
condition; the sediment used was classified as poorly
graded sand; the type and diameter of the material
are gravel with a diameter of 2cm and covered with
wire mesh; and permeability is neglected because
the sediment/soil condition is already saturated. The
contribution of this study is to describe the existence
of ecological structures should be considered as an
important variable in the stream restoration projects.
2
METHODS
A laboratory study is presented to investigate the
effect of ecological barriers on the velocity profile in
a rectangular channel 8 m long x 40 cm wide. The
study consists of an extensive series of experiments
with rectangular channels for currents with a certain
slope and a gravel bed.
The design of the ecological barriers can be seen
in Figure 1. The distance length (dl) of each
ecological barrier was set at 25 cm. 50 cm; 75 cm;
and 100 cm. The study used the BACI (Before After
Impact Control) method for established scenarios
(Table 1).
Tallar, R. and Sawang, T.
Experimental Study on Velocity Profiles Due to Ecological Barriers.
DOI: 10.5220/0010747400003113
In Proceedings of the 1st International Conference on Emerging Issues in Technology, Engineering and Science (ICE-TES 2021), pages 167-171
ISBN: 978-989-758-601-9
Copyright
c
2022 by SCITEPRESS – Science and Technology Publications, Lda. All rights reserved
167
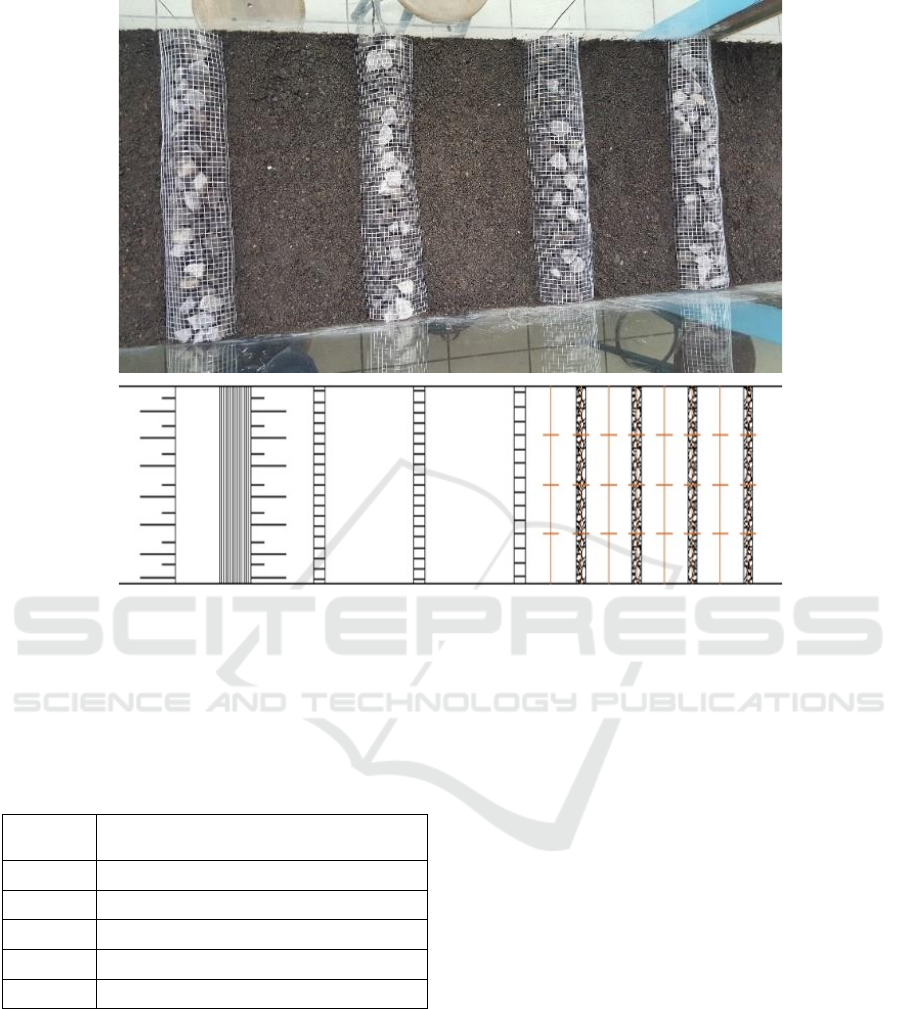
Figure 1: Design of ecological barriers.
In this study, Q = 0.02 m3 / s was used when the
constant discharge flows into the channel. Different
scenarios were also run with different limitations.
The limitations of the study consisted of the flowing
discharge and the slope of channel.
Table 1: Scenarios of the study.
Scenario Description
1 Without ecological barriers
2 Ecological barriers (d
l
= 25 cm)
3 Ecological barriers (d
l
= 50 cm)
4 Ecological barriers (d
l
= 75 cm)
5 Ecological barriers (d
l
= 100 cm)
2.1 Method for Sieve Analysis
The sieve analysis is carried out by set up the
weighed aggregate into a set of pre-arranged sieves.
Particle size determinations on large samples of
sediments are necessary to ensure that sediments
perform as intended for their specified use. A sieve
analysis or gradation test determines the distribution
of sediment particles by size within a given sample.
This information can then be used to determine
study requirements. Data can also be used to
understand the characteristics and classification of
sediment. This study used cumulative method. As
each retained fraction is added, divide the
cumulative mass by the total mass of the sample and
multiply by 100 to calculate percent retained.
Subtract the cumulative percent retained on a given
sieve from 100 to calculate percent passing.
2.2 Method for Flow Velocity Analysis
Flow velocity is simply the continual movement of
water in channels each open and closed. This flow
velocity is constricted connected with discharge,
which defined as the rate of flow or the volume of
water that passes through a channel cross section in
a specific period of time. Discharge can be reported
as total volume or as a rate such as cubic feet per
second (ft
3
/s or cfs) or cubic meters per second
(m
3
/s). The terms flow velocity and discharge are
often used interchangeably, but they will be used
only as defined here.
Discharge data are very important to estimate the
characteristics of channel such as rivers or streams.
The aim of drawing the discharge rating curve is to
ICE-TES 2021 - International Conference on Emerging Issues in Technology, Engineering, and Science
168
work out the most discharge from a channel and to get
an outlined discharge in experimental study. A rating
curve may be a graph of discharge versus stage for a
given purpose on a stream or open channel.
3
RESULTS AND DISCUSSION
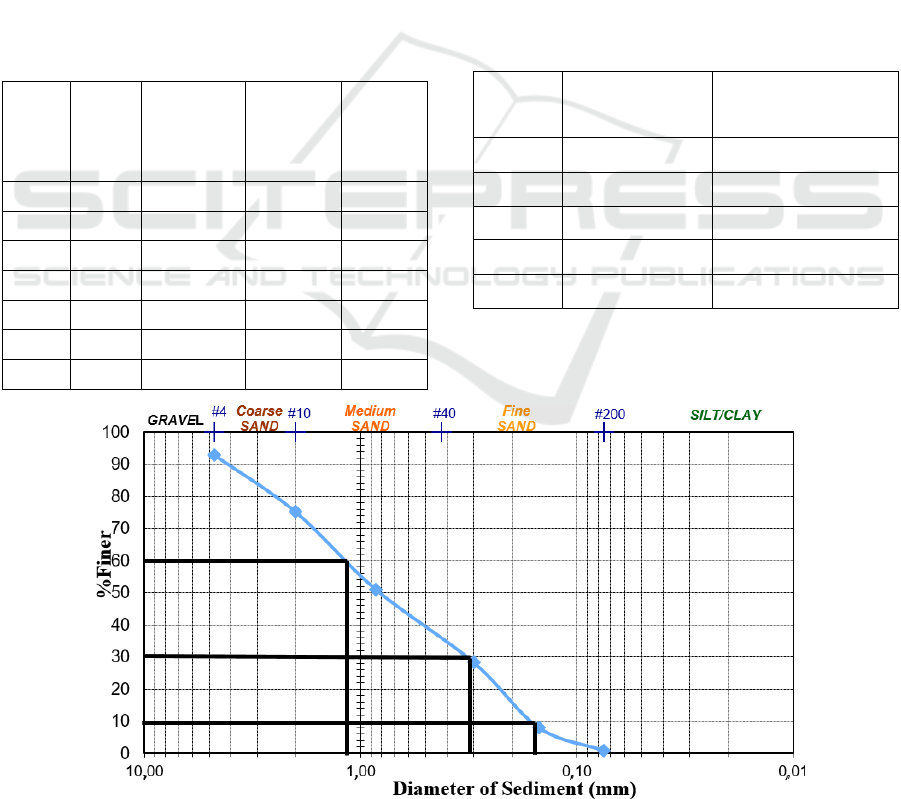
3.1 Sieve Analysis Results
The sieve analysis has been performed to determine
the grain size curve distribution of the sediment then
to obtain the uniformity coefficient (Cu) and
gradient coefficient (Cc). The first process of sieve
analysis is set up the weighed aggregate into a set of
sieve numbers inserted into the vibrating device for
10 minutes. Initial aggregate weight is 1000gr. The
results of sieve analysis can be seen on Table 2 and
Figure 2.
Table 2: Sieve analysis results.
Sieve
Number
d (mm)
Soil Retained
(%)
Cumulative
Soil
Retained
(%)
Soil
Passing
(%)
#4 4.75 7.1 7.1 92.9
#10 2.00 17.7 24.8 75.2
#20 0.85 24.2 49.0 51.0
#50 0.30 22.6 71.6 28.4
#100 0.15 20.3 91.9 8.1
#200 0.075 7.1 99.0 1.0
Pan - 0.5 99.5 0.0
The retained percentage and D
10
, D
30
, D
60
has
been
used for sediment classification. From the
graph, it shows that the relationship between grain
size and percent finer so that Cu= 6.94 and
Cc=0.484. By using Soil Classification Chart, it is
classified that sediment is categorized in Poorly
Graded Sand.
3.2 Flow Velocity Analysis Results
The completed analysis of flow rate velocity is taken
by several positions both x and y direction. Several
positions were in cross section area with the width
distance between ecological barriers. The average
flow velocity was measured by taking 3 depth
positions which represented upper, middle, and
lower area. Time duration for each point was 30
seconds. The results can be seen on Figure 3 and
Table 3.
Table 3: Average flow velocity analysis results.
Scenario
Colour line
Average flow
velocity (m/s)
1
Green 0.35
2
Purple 0.41
3
Red 0.39
4
Yellow 0.38
5 Blue 0.36
Figure 2: Sieve analysis results.
Experimental Study on Velocity Profiles Due to Ecological Barriers
169
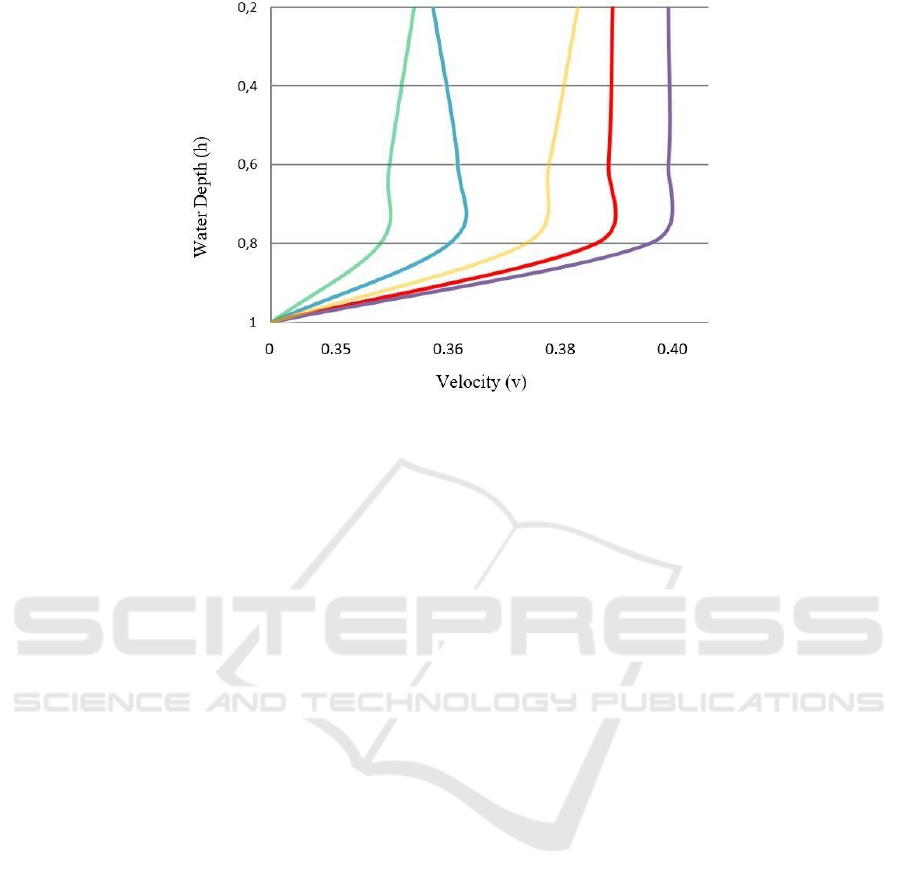
Figure 3: Velocity profiles for five scenarios (Note: Colours describe scenario 1-5).
3.3 Discussion
Basically, ecological barriers provide the necessary
environmental conditions for aquatic organisms
related to the flow velocity. The spatial and temporal
condition determine the boundary of targeted area
study. In context of velocity profile, the flow
velocity is highest near the water surface an lowest
near the channel bed. The drag forces exerted on
water near the watercourse bed usually account for
the decrease in flow velocity.
According to sieve analysis results, the used
sediment was classified by poorly graded sand. It
can be assumed that the roughness of sediment is
higher than well graded sand. Meanwhile, flow
velocity profiles outcomes are strongly associated
with the roughness of sediment. On a stable channel,
the final result of velocity will be faster but in a
channel with ecological barriers, it can cause a
decrease in flow velocity. The highest flow velocity
is in channel with ecological barriers condition with
distance length 25 cm (scenario 2) and the lowest
velocity is in the channel without ecological barriers
(scenario 1).
The influence of flow velocity profile is also
influenced by other factors such as the placement
and position of ecological barriers in a channel and
the distance between ecological barriers. Different
flow rates also will affect the flow velocity profiles.
The other related parameters considered in this study
are Froude and Reynold Number.
Froude number is the ratio of flow velocity to the
characteristic velocity of water waves in the channel,
whilst the Reynold Number deals with the
relationship between frictional and inertial force.
The higher the velocity, the higher the Reynold
Number. It can be assumed that the existence of
ecological barriers can increase the Reynold
Number.
4
CONCLUSIONS
The results show that the average velocity (v=0.35
m/sec) was occurred for without ecological barriers
condition. By comparing the scenarios, this study
showed that ecological barriers (dl = 25 cm) has the
highest velocity (v = 0.41m/s), meanwhile scenario 5
(v=0.36 m/s) has the nearest velocity with the
scenario 1 (v=0.35 m/s). It indicated that the
existence of ecological barriers had given the higher
velocities in streams. The distance length between
ecological barriers showed that the farther the
distance length used the lower the formed velocity
profiles. A conceptual framework for
implementation of ecological barriers requires an
understanding of three major aspects
(geomorphology, hydraulics, and ecology).
Moreover, it is necessary to investigate the effect of
other variables such as ecological barriers
dimension, variation of structure models and other
related variables in the further research.
ACKNOWLEDGEMENTS
The authors gratefully acknowledge the support
for this research provided by Civil Engineering
Department, Maranatha Christian University,
ICE-TES 2021 - International Conference on Emerging Issues in Technology, Engineering, and Science
170

Indonesia, and under collaboration research with
Hydraulics and Ocean Engineering Department,
National Cheng Kung University, Taiwan R.O.C.
REFERENCES
Chang, H. H. (2008). River morphology and river channel
changes. Transactions of Tianjin University, 14(4),
254–262.
Magilligan, F. J., Nislow, K. H., Kynard, B. E., &
Hackman, A. M. (2016). Immediate changes in stream
channel geomorphology, aquatic habitat, and fish
assemblages following dam removal in a small upland
catchment. Geomorphology, 252, 158–170.
Rinaldi, M., Gurnell, A. M., Del Tánago, M. G.,
Bussettini, M., & Hendriks, D. (2016). Classification
of river morphology and hydrology to support
management and restoration. Aquatic Sciences, 78(1),
17–33.
Rosgen, D. L., & Silvey, H. L. (1996). Applied river
morphology (Vol. 1481). Wildland Hydrology Pagosa
Springs, CO.
Stanford, B., Zavaleta, E., & Millard-Ball, A. (2018).
Where and why does restoration happen? Ecological
and sociopolitical influences on stream restoration in
coastal California. Biological Conservation, 221, 219–
227.
Tallar, R. Y., & Suen, J.-P. (2015). Identification of
waterbody status in Indonesia by using predictive
index assessment tool. International Soil and Water
Conservation Research, 3(3), 224–238.
https://doi.org/10.1016/j.iswcr.2015.06.009
Tallar, R. Y., & Suen, J.-P. (2017). Measuring the
aesthetic value of multifunctional lakes using an
enhanced visual quality method. Water, 9(4), 233.
Experimental Study on Velocity Profiles Due to Ecological Barriers
171
