
Experimental Design of Driving with Distractions at Urban Area
using Simulator Driving
Winda Halim
1a
, Rainisa Maini Heryanto
1b
, Santoso
1c
, Christina
1d
, Erwani Merry Sartika
2e
,
Audyati Gany
2f
, Andrew Sebastian Lehman
3g
, Anggie Ervany Haryono
1h
and Vieri Candhya Wigayha
2i
1
Bachelor Program in Industrial Engineering, Universitas Kristen Maranatha,
Jl. Prof. drg. Surya Sumantri MPH No. 65, Bandung, Indonesia
2
Bachelor Program in Electrical Engineering, Universitas Kristen Maranatha,
Jl. Prof. drg. Surya Sumantri MPH No. 65, Bandung, Indonesia
3
Bachelor Program in Computer Engineering, Universitas Kristen Maranatha,
Jl. Prof. drg. Surya Sumantri MPH No. 65, Bandung, Indonesia
christina@eng.maranatha.edu, erwani.ms@eng.maranatha.edu, audyati.gany@eng.maranatha.edu,
andrewsebastianl@gmail.com, ervanyanggie28@gmail.com, viericandhya1@gmail.com
Keywords: Traffic Accident, Driving, Distraction, Experimental Design, Simulator Driving.
Abstract: BACKGROUND: Traffic accidents can come from the drivers, vehicles and environment. Based on statistical
data, the driver’s factor influenced for almost 94% of road accidents. In Indonesia, the number of traffic
accidents that have passed in the last three years has increased by 5.63%. OBJECTIVE: This experimental
design simulation will use a simple driving simulator and game that portray the conditions of urban roads in
Indonesia. The purpose of designing this experiment is to obtain various things that affect the driver while on
the highway. METHOD: This experimental design was created by collecting various secondary data and a
literature review that examines the various factors that can cause a driver to make a mistake while driving.
RESULT: There are several factors that can influence a driver. The experimental design is made using urban
road, time, crowds, a city car, the productive age of respondents, and distraction from the cell phone for the
secondary task. CONCLUSION: The experimental design of this study is expected to describe the effects,
responses, and recommendations that driver should do while driving. The desired long-term result, of course,
is to reduce the number of accidents that occur on the road.
1 INTRODUCTION
Basically, driving is an activity to control the vehicle
by maintaining the right position, speed and distance
(Salvucci & Taatgen, 2011), so driving requires a
high level of concentration. There are many factors
that influence the driving process to run properly.
a
https://orcid.org/0000-0002-2815-3063
b
https://orcid.org/0000-0003-0808-538X
c
https://orcid.org/0000-0002-0244-4372
d
https://orcid.org/0000-0001-8033-5772
e
https://orcid.org/0000-0003-3720-3584
f
https://orcid.org/0000-0002-7389-6667
g
https://orcid.org/0000-0002-7311-1209
h
https://orcid.org/0000-0002-9483-1328
i
https://orcid.org/0000-0001-5688-8721
These factors include internal factors of the driver
himself, such as driving ability, physical condition,
motivation, concentration and others, as well as
external factors such as vehicle conditions, traffic
conditions, distraction, and others. Based on this, a
driving simulation design is carried out using a
Halim, W., Heryanto, R., Santoso, ., Christina, ., Sartika, E., Gany, A., Lehman, A., Haryono, A. and Wigayha, V.
Experimental Design of Driving with Distractions at Urban Area using Simulator Driving.
DOI: 10.5220/0010747300003113
In Proceedings of the 1st International Conference on Emerging Issues in Technology, Engineering and Science (ICE-TES 2021), pages 159-166
ISBN: 978-989-758-601-9
Copyright
c
2022 by SCITEPRESS – Science and Technology Publications, Lda. All rights reserved
159

driving simulator by applying various problems that
cause accidents.
There are 3 main factors that cause accidents,
namely drivers, vehicles, and environmental
conditions and nearly 94% of road accidents are
caused by driver. The main problem that occurs with
the driver is the occurrence of recognition errors
which includes the driver's lack of attention, internal
and external distraction, and lack of supervision.
Recognition error is the main cause with a percentage
of 41% ± 2.2 In addition, there are also problems
caused by vehicles, for example, the brakes are 22%
± 15.4%, which is the second cause after the steering
wheel, then if based on the environment you see an
obstacle, it becomes the third cause, which is 11% ±
7.2%, after the road is slippery and glare (NHTSA,
2015).
Based on the article (WHO, 2020) Some risk
factors for an accident when someone is driving are
speeding, driving while under the influence of alcohol
or drugs, not using safety equipment, such as seat
belts, distraction while driving, unsafe road
infrastructure, unsafe vehicles, lack of speed handling
after accidents and lack of law enforcement on the
road. When it comes to distraction while driving,
there are many types of distraction that can cause
problems while driving, especially those caused by
using a cell phone while driving. The use of cell
phones while driving is very dangerous because it can
cause the driver's concentration to become distracted
and not focus while driving. According to data from
KORLANTAS, 2012, quoted from (Herawati, 2014),
that the causes of traffic accidents by technology are
calling on a cellphone by 36% and receiving calls by
22%, which dominates the occurrence of traffic
accidents. Reduced concentration while driving can
result traffic accidents.
Drivers who use cell phones while driving are 4
times more likely to be involved in accidents because
they have slower reaction times, such as braking
reaction time and reaction to traffic signals. In
addition, drivers will find it more difficult to stay in
the right lane and a safe distance from other vehicles
(WHO, 2020). Based on the preliminary
questionnaire distributed to 264 respondents, it is
known that the things that cause concentration
problems when a person is driving are vehicles that
change lanes suddenly (72.3%) and the driver feels
sleepy (73.1%).
Measurement of a person's concentration can be
carried out in various ways, one of which is using the
reaction time, especially the braking reaction time. In
a case that often occurs in the real world, when
someone is driving then someone suddenly crosses
the road (Pawar, et al., 2020); (Wang, et al., 2019);
(Choudhary & Velaga, 2017) and the driver will react
and make decisions by hitting the brakes (Pawar, et
al., 2020); (Sena, et al., 2016); (Warshawsky-Livne &
Shinar, 2002). When the driver is in prime condition
and fully concentrated, the reaction time to make a
decision to take a certain action can be done very
quickly. However, it will be different if the driver is
tired, sleepy, bored, and in other cognitive conditions
that are not excellent (Sena, et al., 2016). In this study
will analyze the reaction time of a driver to the car
braking process when distraction appears.
2 METHOD
This research begins with preliminary study to find
out what kinds of things a driver does besides doing
his primary task, which is driving. Based on the
survey, many secondary tasks were apparently carried
out by a driver, starting from using a cellphone,
listening to music, chatting with traveling
companions and many more. The intensity of these
various activities varies from very often, frequently,
rarely, and even never.
2.1 Search for Influential Factors
Multitasking is an activity where a person does
several activities at once, for example, an office
worker who picks up the phone while looking for a
file from the computer and records messages sent by
callers, or people who drive while listening to music
and chatting with other passengers. Multitasking does
not always give a bad meaning, even with
multitasking, activities can be done more effectively
and efficiently (Salvucci & Taatgen, 2011). However,
there are some activities that, if done simultaneously
or multitasking, can be dangerous. In a study
conducted by GMAC, 2006, quoted from (Salvucci &
Taatgen, 2011) reported that 40% of drivers talk on
their cell phones while driving, 24% of young drivers
in the 18-25 age range send messages, and another
20% choose a song on their iPod while driving.
Based on data obtained from the Central Statistics
Agency, it was found that in the last 3 years, from
2017 to 2019 there has been an increase in the average
number of accidents by 5.63% per year in Indonesia.
Accidents that occur in urban areas which tend to be
densely populated are certainly higher than in rural
areas. The characteristics of the vehicles used and the
vehicles around them certainly have an influence too.
Driving time is also a factor that has been widely
ICE-TES 2021 - International Conference on Emerging Issues in Technology, Engineering, and Science
160

studied in terms of its effect on the number of
accidents that occur.
2.1.1 Human Factor
About more than 90% of accidents are caused by
human negligence (Hole, 2007); (Shinar, 1978);
(Ulleberg & Rundmo, 2003); (Yilmaz & Celik,
2004). As a driver, humans have factors that influence
driving, which is psychological and physiological
factors. Psychological factors can be in the form of
attitudes, mental abilities, and driver skills.
Meanwhile, physiological factors related to physical
conditions include sight, hearing, touch, fatigue,
drowsiness, and others.
In addition, individual characteristics also play an
important role, such as age, gender, driving
experience, average daily driving duration, hours of
sleep, and activities performed before driving. The
characteristics of the driver are further investigated,
one of which is to simulate a near collision condition
(Luo, et al., 2020). The influence of age is also one of
the factors considered by several studies with varying
results depending on other factors studied
(Warshawsky-Livne & Shinar, 2002); (Sena, et al.,
2016); (Wang, et al., 2019); (Yadav & Velaga, 2019).
The influence of gender has also been investigated by
many studies where one of them states that although
women have a slower reaction time, women tend to
maintain a safe distance from the vehicle in front of
them (Li, et al., 2016). The driving experience of a
new driver and an experienced driver is researched
(Divekar, 2011) which states that experienced drivers
have the ability to control the vehicle better than new
drivers, but they still have the same risk of having to
look the other way when experiencing distraction.
Based on research conducted by (AAA
Foundation for Traffic Safety, 2018) it is estimated
that 16.5% of traffic accidents are caused by drowsy
drivers. In the study that was conducted, the
researchers examined a video of the driver's face in
the three minutes leading up to the accident. The
result was that the researchers determined that 9.5%
of all significant collisions were due to drowsiness. In
addition, based on the research, it was found that 96%
of drivers saw that driving in a sleepy state was a
serious threat to their safety. According to Jake
Nelson, director of traffic safety research and
advocacy for the AAA Foundation, saying two to
three hours of sleep deprivation can quadruple the
risk of a driver having a traffic accident, which is the
equivalent of drunk while driving.
2.1.2 Environmental Factor
Another factor that also affects the driver is
environmental factors. Environmental factors that are
widely used in research are related to time factors,
road conditions, and road density factors.
The time factor is closely related to the circadian
rhythm of the driver. Several studies conducted gave
mixed results related to time which is bad for driving
activities. On research (Lenne, et al., 1997) bad times
to drive are 2 a.m. and 6 a.m., while the best times are
10 a.m. to 10 p.m. Different results are given by the
research conducted by (Saputra, 2017) based on
accident data collection (KNKT, 2007-2016) in
Indonesia that the time for many accidents to occur is
from 12 noon to 7 pm.
The road density factor is a factor that affects a
person's speed when driving. When someone is on a
very congested or busy road, they tend to slow down.
Meanwhile, when on a road that tends to be quiet, the
driver will tend to increase his speed.
2.1.3 Distraction Factor
The driving process can run smoothly if there are no
distractions while driving that can disturb the driver's
concentration. This distraction can occur during the
driving process itself which is widely used in
previous research such as the emergence of road
crossers, motorbikes breaking the lane, and animals
crossing suddenly. (Wang, et al., 2019); (Choudhary
& Velaga, 2019); (Choudhary & Velaga, 2017) or
static obstruction (Pawar, et al., 2020).
In addition to the factors originating from the
driver, another thing that greatly influences the
occurrence of road accidents is the secondary task, in
this case, the use of cell phones. At this time cell
phones are electronic devices that have many
functions and complement today's lifestyle. Several
studies related to driving and the use of cell phones
have been carried out by considering various factors
(Hancock, et al., 2003). Research using cell phones is
very much done because of the various variations in
the use of the cell phone itself, such as the use of cell
phones hands free which does not reduce the risk of
accidents that can occur (Li, et al., 2016). Reaction
time when talking on cell phone (Calvi, et al., 2017);
(Mohebbi, et al., 2009); (Drews, et al., 2008);
(Laberge, et al., 2004), send short messages either
simple or complex messages (Choudhary & Velaga,
2019), compare it with the use of a music player
(Choudhary & Velaga, 2017); (Yannis, et al., 2013).
Experimental Design of Driving with Distractions at Urban Area using Simulator Driving
161
2.2 Driving Simulation Device
Driving activity in this experiment will be represented
using a driving simulator, although of course the use
of a driving simulator cannot fully describe driving
conditions directly. Lots of driving research is done
using simulations because of the cost efficiency and
safety factors. On his research (McGehee, et al.,
2000) trying to validate by comparing the driving
conditions using a driving simulator and directly on
the track, where the results obtained state that there is
a statistical equivalence of the two experiments.
2.2.1 Software (Game Simulation)
The design of a simulation game for driving uses
unity software. Unity is a 3D Game Engine created
by Unity Technology which is widely used to create
three-dimensional game animations. Some of the
advantages of designing a driving simulation game
using Unity are that it can be configured with various
scenarios. In addition, it can also be done recording
the parameter data needed for further processing.
The following is a display of a simulation game
that has been designed using unity.
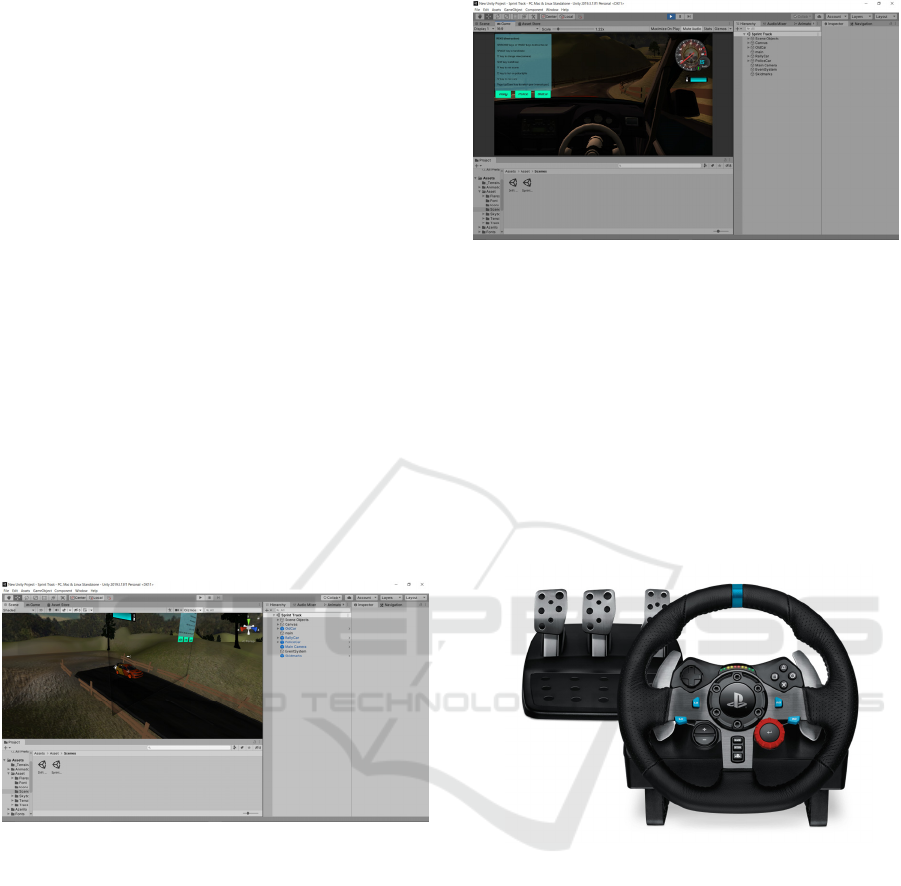
Figure 1: Display Unity.
Figure 1 is a display in unity. On the main page of
Unity, there is a toolbar on the top side that functions
to move, rotate, scale objects, and buttons to run,
pause, and stop the project. On the lower side, there
is an assets page that functions as a folder where
materials for game creation such as audio files,
shaders, materials, scripts, and so on are stored. Then
on the assets page, there is a scene window that
functions as a game creation place and a game page
to see how the game will look when the project is run.
Then there is also a hierarchy, which is a list of
objects in the scene, then next to it there is an
inspector page that functions as an editor for objects
in the assets and hierarchy.
Figure 2: Project View.
Figure 2 is an example when the project is
running, you can see that the scene page can move
automatically to the game page so you can see what
if the project is run.
2.2.2 Hardware (Simulator Driving
Apparatus)
The hardware used has the following specifications
Logitech G29 Driving Force (Steering Wheel &
Pedals), Driving Force Shifter, and a projector or
monitor.
Figure 3: Steering Wheel & Pedals (Source:
www.logitechg.com).
Figure 4 is a display of the data collection
condition settings carried out.
ICE-TES 2021 - International Conference on Emerging Issues in Technology, Engineering, and Science
162
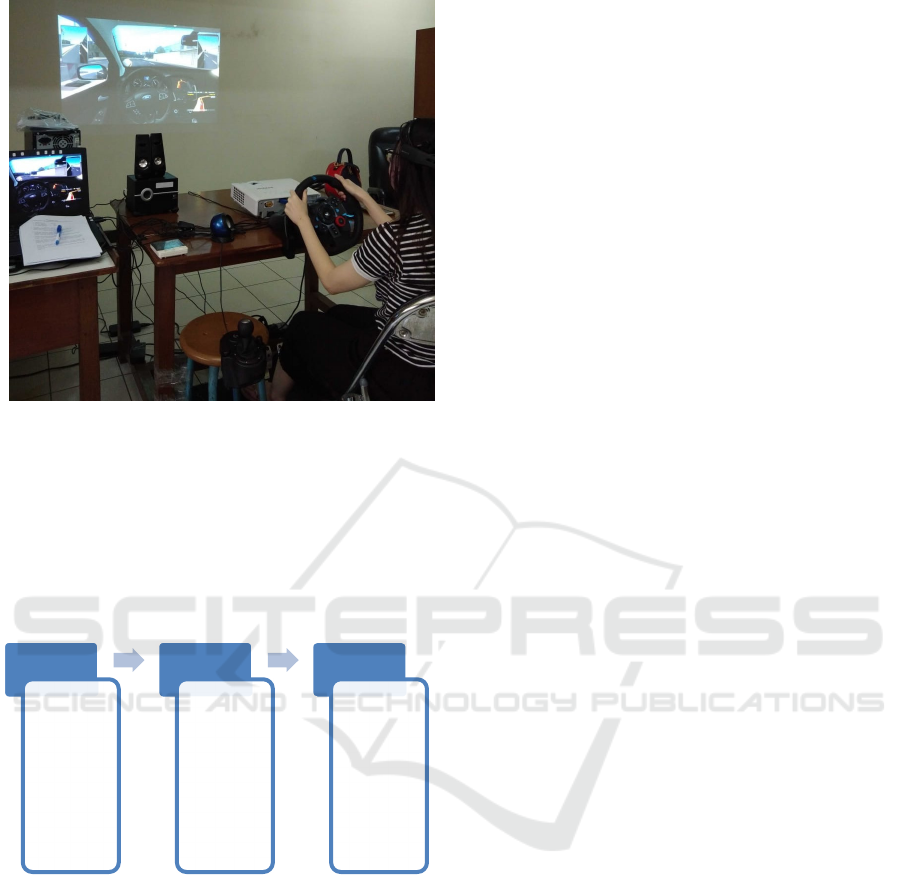
Figure 4: Game Simulation (Source: Personal
Documentation).
3 RESULT AND DISCCUSION
Based on the previous survey and literature review,
an experimental design was carried out as illustrated
in the following diagram:
Figure 5: Experimental Design.
3.1 Experimental Design before and
after Driving
After knowing the impact of traffic accidents due to
fatigue and drowsiness caused by a lack of sleep
duration and other activities that cause fatigue, which
is monotonous work, the intensity and duration of
work are out of tolerance. The impact of fatigue and
drowsiness will be measured using subjective
measurements using the Karolinska Sleepiness Scale
(KSS) method. Meanwhile, the objective
measurement is to measure the heart rate, which is to
assess the physical condition of a person.
According to (Akerstedt & Gillberg, 1990)
Karolinska Sleepiness Scale (KSS) the Karolinska
Sleepiness Scale (KSS) is a questionnaire to measure
the subjective level of sleepiness at a certain time
which shows the psycho-physical experience
experienced in the last 10 minutes. The KSS
questionnaire was research by (Kaida, et al., 2006)
whose reliability and validity had been tested, the
results showed that KSS had high validity. The author
has investigated the validity of KSS and found that it
is highly correlated to EEG (Electroencephalogram)
and behavioral variables. The results showed that
KSS has high validity. However, because the KSS
scores varied according to sleep earlier, time of day,
and other parameters, it was difficult to infer the
reliability of the test-retest. This rating is from a scale
of 1 (extremely alert) to a scale of 10 (extremely
sleepy, falls asleep all the time). Score in KSS
increases with longer periods of awake and it is highly
correlated with time of day (Shahid, et al., 2012).
In addition to the Karolinska Sleepiness Scale
(KSS) questionnaire, another method is the objective
measurement by measuring heart rate. Heart rate
measurement is used to detect when the pulse is
below normal, this indicates that the blood supply to
the body system is reduced. So the nutrients and
oxygen that flow in the blood are not optimal, causing
the body to feel weak and drowsy. The measurement
of heart rate will be converted into the total value of
energy expenditure to measure the physical fatigue of
the driver which will later be processed using the
energy expenditure classification method developed
by (Kroemer, et al., 2001).
3.2 Experimental Design While Driving
In this study will design a driving simulation with the
distractions that exist in urban areas. The distraction
that will be applied is the distraction that is directly
related to the driving condition that is being carried
out, which is in the form of distraction that has been
predicted from a distance or is referred to as static
distraction, for example the appearance of road
obstacles such as a car parked on the shoulder of the
road, road closing signs, and others. In addition, there
will also be distractions that appear suddenly, for
example a car or motorcycle suddenly overtaking,
people or animals crossing the road suddenly and
others.
3.2.1 Primary Task
The primary task in this study is the main task when
a person is driving, namely controlling the movement
Experimental
DesignBefore
Driving
• Thedesired
conditionforthe
driverisfeeling
sleepy
• Measurements
usingtheKSS
andheartrate
Experimental
DesignWhile
Driving
• Designing
distractionswhile
theprimarytask
(driving)isbeing
carriedout
• Static
Distraction
•Dynamic
Distraction
• Addingdistraction
fromsecondary
task(cellphone
use)
•Checkingthe
conditionof
drowsinesswith
KSSandheartrate
Experimental
DesignAfterDriving
•Checkingthe
conditionof
drowsinesswith
KSSandheart
rateagain
Experimental Design of Driving with Distractions at Urban Area using Simulator Driving
163

and speed of the vehicle being driven. As previously
explained, driving is a very complex activity that
requires high concentration. When a person just
focuses on driving, there are many distractions that
can be found, for example, the road conditions they
are traveling on, the movement of other vehicles, and
many more. In the experimental design that will be
carried out, the distraction related to driving is
designed to be static distraction and dynamic
distraction.
a. Static Distraction
The nature of this distraction should be easily
detected by the driver because it can be seen
from a distance, if the driver is fully
concentrated while driving. Some examples of
this distraction are road closure signs, cars
parked on the shoulder of the road, and other
objects in the driver's travel path.
b. Dynamic Distraction
Unlike the case with stationary distraction that
can be predicted beforehand, there is dynamic
distraction, its appearance is sometimes
unpredictable, for example, other vehicles that
suddenly overtake, people or animals crossing
the road suddenly and many more.
Basically, this distraction is a distraction that is
commonly encountered by a driver while driving on
highways, especially urban roads.
3.2.2 Secondary Task
Secondary tasks are activities that are not directly
related to the driving activity itself, for example
listening to music, changing radio channels in the car,
chatting with other passengers, making calls, typing
in addresses on GPS, etc. The secondary task in this
experiment is the use of cell phones, where the use of
cellphones in this study will be divided into simple
tasks and complex tasks.
a. Simple Task
The simple task in this study is a simple task
where the driver only needs to press one button
on the cell phone, for example picking up or
closing an incoming call via a cell phone (motor
activity).
b. Complex Task
Meanwhile, a complex task is a task that is quite
differ and complicated, for example, answering
a short message with answers such as yes or no
(motor activity and mental activity).
The stages that will be carried out during the
driving simulation are described in the following
flowchart:
Figure 6: Experimental Design While Driving.
Based on (Gawron, 2019) there are several driving
parameters that can be measured using a driving
simulator, including average brake reaction time,
brake pedal error, control light response time, and
many more. The targets to be achieved when driving
with various distractions that occur are related to the
given braking reaction time which can be detected
through the changes in speed that occur.
4 CONCLUSIONS
Figure 7: Summary of Factors and Paramaters
The factors that can be identified based on the
literature review that have been carried out are
included in the experimental design.
These factors are considered in the conditions that
exist in the driver that is individual characteristics,
conditions in the simulation game that is
Stage1:NoTaskandNo
Distraction(15minutes)
Stage2:SimpleTask(15menit)
• WithoutDistraction(5min)
• StaticDistraction(5min)
• DynamicDistraction(5min)
Stage3:ComplexTask(15
menit)
• WithoutDistraction(5min)
• StaticDistraction(5min)
• DynamicDistraction(5min)
Measurement
Parameters
(Changeinspeed,
averageBRT,
numberof
collisions,number
ofbrakes)
Enviromental
Characteristics
•Typicalroad
• Crowdedconditions
•Drivingtime
IndividualCharacteristics
•Age
• Gender
• Sleepduration
• Drivingexperience
• Dailydrivingduration
Distraction
Characteristics
• Staticdistraction
• Dynamicdistraction
• Cellphone
distraction
ICE-TES 2021 - International Conference on Emerging Issues in Technology, Engineering, and Science
164

environmental characteristics and distraction
received is in the form of a static and dynamic
obstacle for the main task, and comes from the cell
phone for the secondary task. This experimental
design is expected to provide an overview of the
various experiences experienced by drivers while
driving on urban roads. So, through this it can be
obtained an overview regarding the influence,
response, and recommendations that should be made
by a driver on the highway so that they can avoid
danger.
The long-term results expected, is to be able to
design a control system that can provide warnings to
drivers in order to avoid dangers, and can reduce the
number of accidents that occur on the highway.
ACKNOWLEDGEMENTS
Thank you to all those who have given their time,
energy, and thoughts for this research. Those
involved are the Laboratory of Work Design Analysis
and Ergonomics of the Industrial Engineering Study
Program at Maranatha Christian University and
related staff. As well, the Electrical Engineering
Study Program and Computer Engineering Study
Program at Maranatha Christian University along
with related staff.
REFERENCES
AAA Foundation for Traffic Safety. (2018, February 8).
AAA Foundation for Traffic Safety. Retrieved from
aaafoundation.org:
https://newsroom.aaa.com/2018/02/drowsy-driving-
dont-asleep-wheel/
Akerstedt, T., & Gillberg, M. (1990). Subjective and
Objective Sleepiness in the Active Individual.
International Journal of Neuroscience, Volume 52 (1-
2) 29-37.
Calvi, A., Benedetto, A., & D'Amico, F. (2017).
Investigating driver reaction time and speed during
mobile phone conversations with a lead vehicle in front:
A driving simulator comprhensive study. Taylor &
Francis Online, Journal of Transportation Safety &
Security Pages 5-24.
Choudhary, P., & Velaga, N. R. (2017). Modelling driver
distraction effects due to mobile phone use on reaction
time. Elsevier, Transportation Research Part C 77
(2017) 351-365.
Choudhary, P., & Velaga, N. R. (2019). Performance
Degradation During Sudden Hazardous Events: A
Comparative Analysis of Use of a Phone and a Music
Player During Driving. IEEE Transactions on
Intelligent Transportation Systems, Volume 20 (11)
4055-4065.
Divekar, G. (2011). The Effect of External Distractions on
Novice and Experienced Drivers' Anticipation of
Hazards and Vehicle Control. United States of
America: ScholarWorks@UMass Amherst.
Drews, F. A., Pasupathi, M., & Strayer, D. L. (2008).
Passenger and Cell Phone Conversations in Simulated
Driving. Sage Journals, Journal of Experimental
Psychology Vol. 14, No. 4, 392–400.
Gawron, V. J. (2019). Human Performance and Situation
Awareness Measures Third Edition. Boca Raton: CRC
Press/Taylor & Franciss Group.
Hancock, P., Lesch, M., & Simmons, L. (2003). The
distraction effects of phone use during a crucial driving
maneuver. Pergamon, Accident Analysis and
Prevention 35 (2003) 501–514.
Herawati. (2014). Traffic Accident Characteristics And
Caused In Indonesia 2012. Kementrian Perhubungan
Badan Penelitian dan Pengembangan Perhubungan,
Vol 26, No 3 (2014).
Hole, G. (2007). The Psychology Of Driving. New York:
Lawrence Erlbaum Associates, Inc.
Kaida, K., Takahashi, M., Akerstedt, T., Nakata, A.,
Otsuka, Y., Haratani, T., & Fukasawa, K. (2006).
Validation of the Karolinska sleepiness scale against
performance and EEG variables. Elsevier, Clinical
Neurophysiology Volume 117 (7) 1574-1581.
Kroemer, K. H., Kroemer, H. B., & Kroemer-Elbert, K. E.
(2001). Ergonomics: How to Design for Ease and
Efficiency. London: Prentice Hall.
Laberge, J., Scialfa, C. (., White, C., & Caird, J. (2004).
Effects of Passenger and Cellular Phone Conversations
on Driver Distraction. Sage Journals, Volume: 1899
issue: 1, page(s): 109-116.
Lenne, M. G., Triggs, T. J., & Redman, J. R. (1997). Time
of Day Variations In Driving Performance. Pergamon,
Accid. Anal. and Prm.. Vol. 29, No. 4, pp. 431-437.
1997.
Li, X., Yan (Ph.D.) (Professor), X., Wu, J., Radwan
(Professor), E., & Zhang, Y. (2016). A rear-end
collision risk assessment model based on drivers’
collision avoidance process under influences of cell
phone use and gender—A driving simulator based
study. Elsevier, Accident Analysis and Prevention 97
(2016) 1-18.
Luo, Q., Chen, X., Yuan, J., Zang, X., Yang, J., & Chen, J.
(2020). Study and Simulation Analysis of Vehicle
Rear-End Collision Model considering Driver Types.
Hindawi, Journal of Advanced Transportation Volume
2020, Article ID 7878656, 11 pages.
McGehee, D. V., Mazzae, E. N., & Baldwin, G. S. (2000).
Driver Reaction Time in Crash Avoidance Research:
Validation of a Driving Simulator Study on a Test
Track. Sage Journals, Volume: 44 issue: 20, page(s): 3-
320-3-323.
Mohebbi, R., Gray, R., & Tan, H. Z. (2009). Driver
Reaction Time to Tactile and Auditory Rear-End
Collision Warnings While Talking on a Cell Phone.
Sage Journals, Volume: 51 issue: 1, page(s): 102-110.
Experimental Design of Driving with Distractions at Urban Area using Simulator Driving
165

NHTSA. (2015, February). National Highway Traffic
Administration. Retrieved from nhtsa.gov:
https://crashstats.nhtsa.dot.gov/Api/Public/ViewPublic
ation/812115
Pawar, N. M., Khanuja, R. K., Choundhary, P., & Velaga,
N. R. (2020). Modelling braking behaviour and
accident probability of drivers under increasing time
pressure conditions. Elsevier, Accident Analysis and
Prevention 136 (2020) 105401.
Salvucci, D. D., & Taatgen, N. A. (2011). The Multitasking
Mind. New York: Oxford University Press, Inc.
Saputra, A. D. (2017). Study of Traffic Accident Rate in
Indonesia Base on KNKT (Komite Nasional
Keselamatan Transportasi) Database from 2007-2016.
Kementrian Perhubungan Badan Penelitian dan
Pengembangan Perhubungan, Vol 29, No 2 (2017).
Sena, P., d'Amore, M., Brandimonte, M. A., Squitieri, R.,
& Fiorentino, A. (2016). Experimental framework for
simulators to study driver cognitive distraction: brake
reaction time in different levels of arousal. Elsevier,
Transportation Research Procedia 14 ( 2016 ) 4410 –
4419.
Shahid, A., Wilkinson, K., Marcu, S., & Sharpio, C. M.
(2012). STOP, THAT and One Hundred Other Sleep
Scales. New York: Springer Science+Business Media,
LLC.
Shinar, D. (1978). Psychology on the Road: The Human
Factor in Traffic Safety. New York: Wiley.
Ulleberg, P., & Rundmo, T. (2003). Personality, attitudes
and risk perception as predictors of risky driving
behaviour among young drivers. Elsevier, Safety
Science Volume 41 427-443.
Wang, W., Cheng, Q., Li, C., Andre, D., & Jiang, X. (2019).
A cross-cultural analysis of driving behavior under
critical situations: A driving simulator study. Elsevier,
Transportation Research Part F (2019) 483-493.
Warshawsky-Livne, L., & Shinar, D. (2002). Effects of
uncertainty, transmission type, driver age and gender on
brake reaction and movement time. Pergamon, Journal
of Safety Research 33 (2002) 117-128.
WHO. (2020, February 7). World Heath Organization.
Retrieved from who.int: https://www.who.int/news-
room/fact-sheets/detail/road-traffic-injuries
Yadav, A. K., & Velaga, N. R. (2019). Modelling the
relationship between different Blood Alcohol
Concentrations and reaction time of young and mature
drivers. Elsevier, Transportation Research Part F 64
(2019) 227-245.
Yannis, G., Papathanasiou, E., Postantzi, E., &
Papadimitriou, E. (2013). Impact of mobile phone use
and music on driver behaviour and safety by the use of
a driving simulator. 3rd International Conference on
Driver Distraction and Inattention Paper No. 55-P.
Yilmaz, V., & Celik, H. E. (2004). A model for risky
driving attitudes in Turkey. An International Journal,
Social Behavior and Personality Volume 32 (8) 791-
796.
ICE-TES 2021 - International Conference on Emerging Issues in Technology, Engineering, and Science
166
