
Analyse Protein Model of the SARS-CoV-2 Virus using Data Mining
Methods
Tiur Gantini
a
and Hans Christian
b
Department of Information Technology, Maranatha Christian University, Jl Suria Sumantri No.65, Bandung, Indonesia
Keywords: Bioinformatics, Data Mining, J48, Naïve Bayes, WEKA.
Abstract: Since December 2019, the SARS II Covid 19 virus pandemic worldwide, The National Centre for
Biotechnology Information (NCBI) has also recorded information related to this virus in its database. This
research focuses on identifying dataset the protein of the species Severe acute respiratory syndrome
coronavirus 2 (SARS-CoV-2), genus BETACORONAVIRUS, and family CORONAVIRIDAE from NCBI
database by a data mining model using a classification based naïve Bayes and J48 algorithms which were
recorded from December 1, 2019, to April 13, 2021, with 1.149.217 data. The dataset that has been cleaned
is data of SARS II Covid 19 + virus in humans with a total record of 517.834 consisting of data on nucleotide
length, nucleotide completeness, geographic location, and protein. This data used for the data training. Then
we used 475 for data testing which was chosen randomly. The result is that the entire protein can be predicted
using the J48 algorithm but cannot be predicted using Naive Bayes. From the data mining results, it can be
concluded that the best method that can be used to predict protein in humans affected by the SARS II Covid
19 + virus is the J48 algorithm rather than the Naive Bayes algorithm.
1 INTRODUCTION
Since the pandemic occurred in December 2019, many
people conducted research related to the SARS-COV-
2 (Covid 19) virus. Currently, there is a very large
amount of virus data in an open-source database
system.
NCBI is an organization that has an open-source
database system. NCBI maintains a series of databases
relevant to biotechnology and biomedicine. This
database is an important resource for bioinformatics
tools and services which also records databases related
to the SARS II Covid 19 virus from various parts of
the world(Smith, 2019) (Information, 2019).
Recently, there have been major changes and
improvements in the field of biomedical research
which we know as biomedical. Biomedical is the
basis of research related to biomedical information
innovation, medical imaging technology, gene chips,
nanotechnology, psycho-biomedical social models,
development of biological systems that have shaped
modern biomedical systems. It is closely related to the
formation of the biotechnology industry in the
a
https://orcid.org/ 0000-0002-5050-5774
b
https://orcid.org/ 0000-0001-5063-7761
twenty-first century, and is an important area related
to medical diagnosis and human health(Kc Santosh,
Zohora, 2018) (Kalsi et al., 2018). Bioinformatics is
Data mining is a very effective and useful technique
in the research and development of bioinformatics
(Albahri et al., 2020). Data mining has attracted a
great deal of attention in the research as a whole in
recent years, due to the availability of big data and the
need to convert that data into useful information and
knowledge. Data mining, also known as Knowledge
Discovery in Databases (KDD) is a field for finding
new and potentially useful information from large
databases (Baker, 2010).
This research will be focused on identifying
dataset the protein of species Severe acute respiratory
syndrome coronavirus 2 (SARS-CoV-2), genus beta
coronavirus, and family Corona VIRIDAE by
implementing a data mining model using a
classification based on J48 and naïve Bayes
algorithms in Weka which was recorded from 1
December 2019 to April 13, 2021. The dataset that
has been cleaned is data of SARS II Covid 19 + virus
in humans with a total record of 517.834 consisting
Gantini, T. and Christian, H.
Analyse Protein Model of the SARS-CoV-2 Virus using Data Mining Methods.
DOI: 10.5220/0010744800003113
In Proceedings of the 1st International Conference on Emerging Issues in Technology, Engineering and Science (ICE-TES 2021), pages 95-103
ISBN: 978-989-758-601-9
Copyright
c
2022 by SCITEPRESS – Science and Technology Publications, Lda. All rights reserved
95
of data training and 475 data testing on nucleotide
length, nucleotide completeness, geographic location,
and protein class. There were 98 geographic
locations, 28 protein wish nucleotide completeness
used in this dataset.
This research used two algorithm classifications
of data mining, i.e. J48 and naïve Bayes. Those
algorithms will be compared to get the best results for
making predictions of the proteins contained in the
species SARS-CoV-2 in humans.
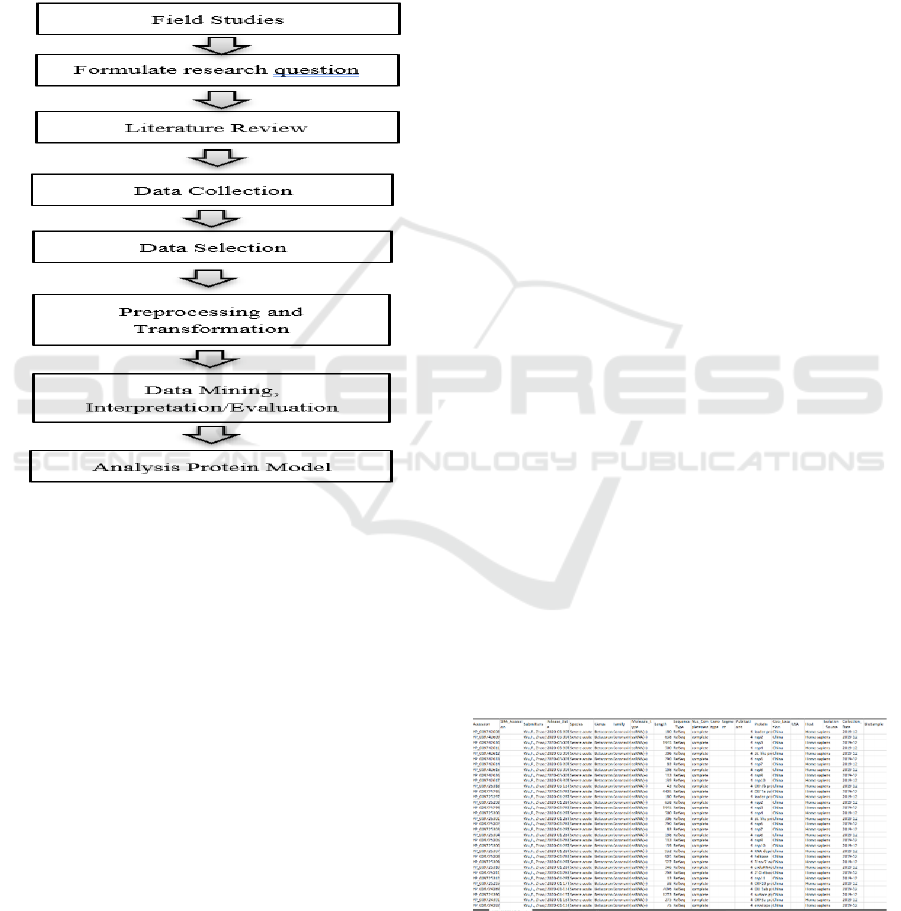
Figure 1: Research Method.
2 METHODS (AND MATERIALS)
The research method can be seen in Figure 1. Each
phase will discuss in this section with materials
research.
2.1 Field Studies
Before starting the research, first a field survey was
conducted to get a qualitative picture of the accuracy
of the data to be studied.
2.2 Formulates Research Question
The formulates research question is the stage where
the object of research formulates the problem,
namely, how to do protein analysis of the SARS-
COVID-2 using data mining method and how to
predict the model protein.
2.3 Literature Review
In order to achieve the goals to be achieved, it is
necessary to study literature studies related to the
analysis of the SARS COV 2 virus protein and data
mining (Christian, 2021).
2.4 Data Collection
The data collection was carried out in several ways,
namely the literature study method and data
collection from the website of the National Centre for
Biotechnology Information (NCBI). It is called
the NCBI database. For this research, data was taken
on December 19, 2020 until April 13, 2021 in the
Comma-Separated Values (CSV) file format
(Christian, 2021).
2.5 Data Selection
The NCBI database has a lot of data that can be
researched, but at the selection stage the data is
determined in relation to the severe acute respiratory
syndrome coronavirus 2 (SARS-CoV-2) protein in
humans. The selected column of NCBI database
consists of the Accession, SRA Accession,
Submitters, Release Date, Species, Genus, Family,
Molecule Type, Length, Sequence Type, Nucleotide
Completeness, Genotype, Segment, Publications,
Protein, Geography Location, USA, Host, Isolation
Source, and Collection Date classes.
2.6 Preprocessing and Transformation
In the preprocessing stage, data cleaning will be
carried out. The entire data collection is 1,149,217
data. There were many empty data and useless data,
then we cleaned and become 517.834 data training
and 475 data testing which consists of the Length,
Nucleotide Completeness, Protein, Geography
Location, Host, and Isolation Source classes. The data
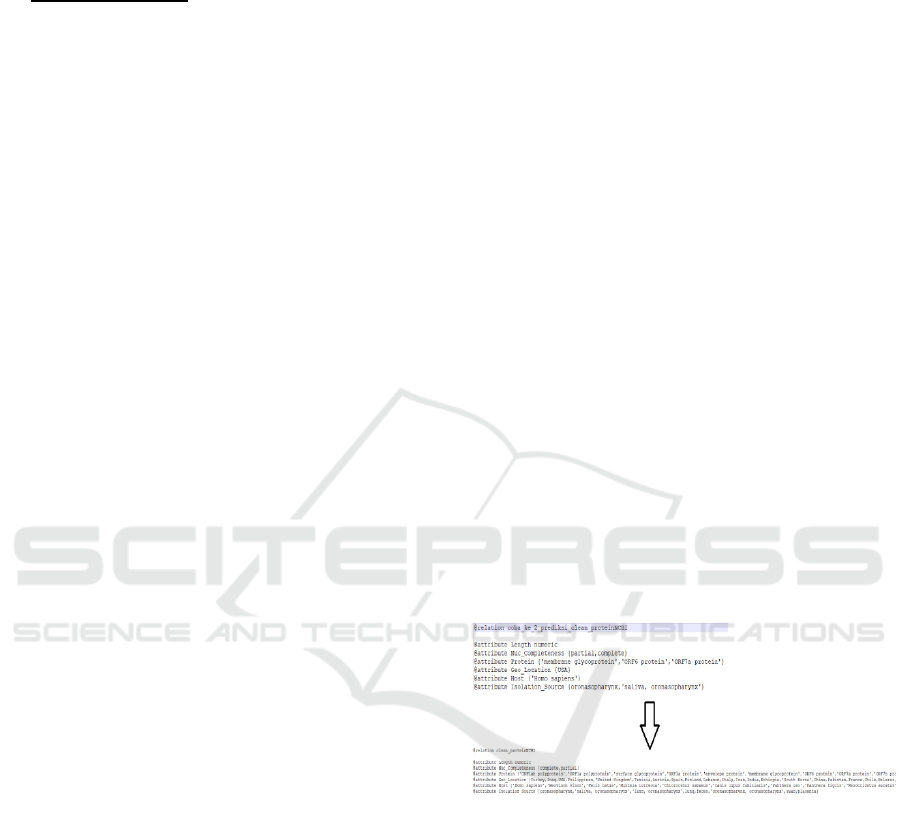
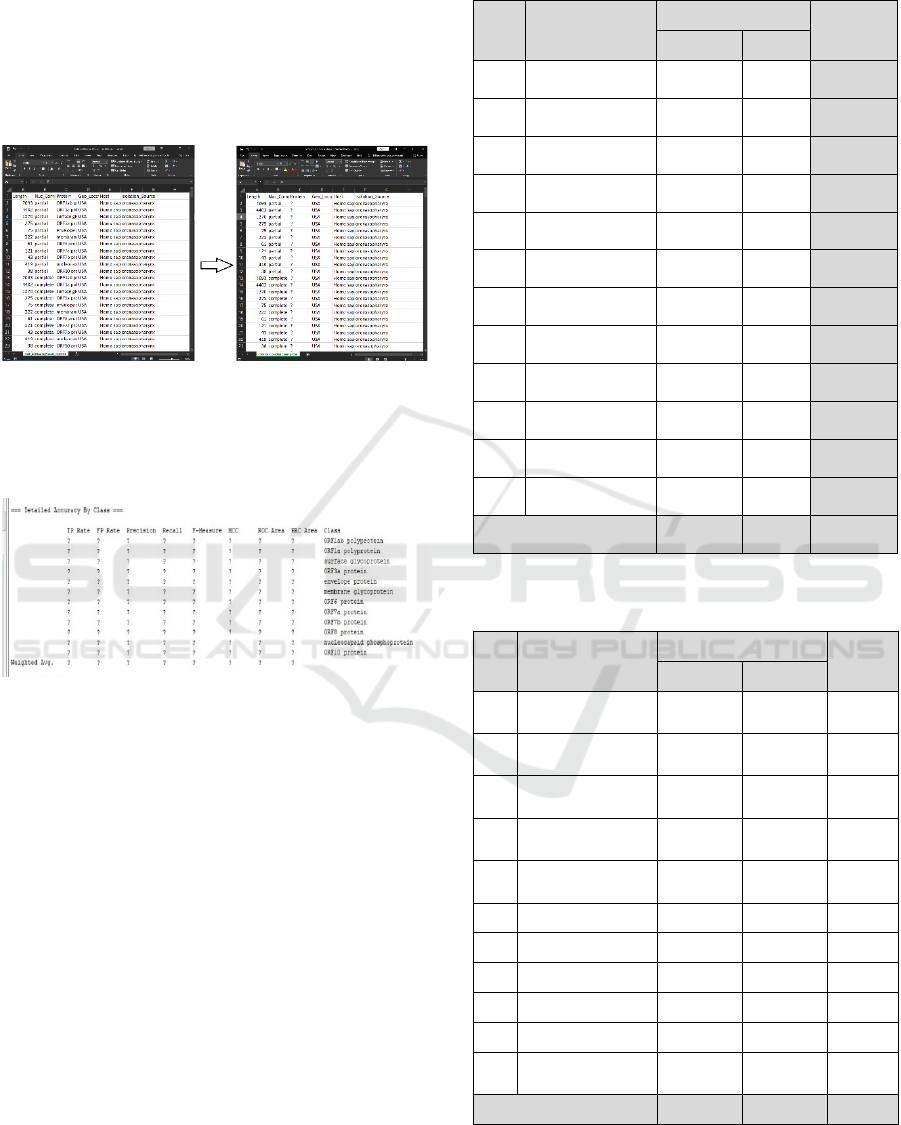
sample can be seen in Figure 2.
Figure 2: Preprocessing Data Sample.
Each class will be described in this section
(Information, 2019).
ICE-TES 2021 - International Conference on Emerging Issues in Technology, Engineering, and Science
96
• Length records how long the sequence of SARS-
COV-2 protein.
• Nuc_completeness stands for nucleotide
completeness where data stored is data that
explains completeness or some of the descriptions
listed for the data. If the data has a molecular
description / information, the data is considered
complete, but if the data does not have a
molecular description / information, the data will
be considered partial.
• Protein stored data protein of SARS-CoV-2 virus
in each location that was inserted into the NCBI
database. According to the phylogenetic tree,
there are three core variants, with minor variations
in their amino acid sequences. The most primitive
(“ancestral”) variant is designated ‘A’. Two
newer variants are designated B and C,
respectively. Geographically, A and C are
prevalent outside East Asia, whereas B has a
predominant presence in East Asia (Biswas et al.,
2020) (Mohanty et al., 2020). Gene arrangement
in the viral genome has been determined through
sequencing. Two untranslated regions (UTR)
flank the coding region at both 5′ and 3′ ends.
Genes in the coding region, from 5′ end to 3′
end are Open Read Frame ab (ORF1ab), spike (S),
envelope (E), membrane (M), and nucleocapsid
(N). Several other ORFs are also present between
S (Spike) and N (nucleocapsid) genes. ORF1ab is
the largest of the genes (Noorimotlagh et al.,
2020) and is further subdivided into ORF1a and
ORF1b. The ORF1ab gene encodes more than 15
nonstructural proteins including RNA-dependent
RNA polymerase (RdRP) and helicase (Wu et al.,
2020)(Mohanty et al., 2020). The ORF1ab also
encodes the pp1ab protein that contains 15 nsps
(nsp1-nsp10 and nsp12-nsp16). The pp1a protein
encoded by the orf1a gene also contains 10 nsps
(nsp1-nsp10). The accessory genes are distributed
among the structural genes” (Noorimotlagh et al.,
2020) (Wu et al., 2020).
• Geolocation stands for “The geographic location”
of each country of origin of humans infected with
the SARS-COV2 virus which is inserted into the
NCBI database. There were many countries
inserted into the database.
• Host record human or animal in which a parasite
or commensal organism lives of SARS-CoV-2
virus. The data written in Latin that contains homo
sapiens (human), CANIS LUPS FAMILIARIS
(dog), CHLOROBEUS SABEUS (green
monkey), FELIS CATUS (cat),
MESOCRICETUS AURATUS (Suriah hamster),
MUSTELA LUTREOLA (Europe Cerpelai),
NEOVISION VISON (American Cerpelai),
PANTHERA LEO (lion), dan PANTHERA
TIGRIS (tiger). In this research we used just
humans for host value.
• Isolation source record the protein was taken from
the SARS-CoV-2 virus that contains the
ORONASOPHARYNX (part of the throat behind
the oral cavity), placenta (a temporary organ that
connects the mother and fetus), feces (body waste
removed from the intestine), lung (a large organ
located in the chest cavity at both sides of the
heart), saliva (saliva), and swabs (taking using a
cotton swab or gauze that takes a substance from
the surface of the body or a hole).
• Isolation Source is in the form of data that covers
where the protein is taken from the SARS-CoV-2
virus. Data Isolation Source is written in medical
terms which contains the ORONASOPHARYNX
(part of the throat behind the oral cavity), placenta
(a temporary organ that connects the mother and
fetus), feces (body waste removed from the
intestine), lung (a large organ located in the chest
cavity at both sides of the heart), saliva (saliva),
and swabs (taking using a cotton swab or gauze
that takes a substance from the surface of the body
or a hole).
Then the data transformed to the Attribute
Relation File Format (ARFF) using the WEKA
application see figure 3.
Figure 3: Data Transformation in ARFF Format.
2.7 Data Mining and Interpretation/
Evaluation
After preprocessing, data is ready for mining
procedure and extracting the knowledge. We called
data mining.
2.7.1 Data Mining
At this stage, the classification of data mining task
was selected by applying the Naïve Bayes
and J48
algorithms. The 517.834 of data training will be
discussed next.
Analyse Protein Model of the SARS-CoV-2 Virus using Data Mining Methods
97
Data Training. Classification data training of SARS-
Cov-2 virus protein consists of 12 classification
proteins. They are envelope protein, membrane
glycoprotein, nucleocapsid phosphoprotein, ORF1a
polyprotein, ORF1ab polyprotein, ORF3a protein,
ORF6 protein, ORF7a protein, ORF7b protein, ORF8
protein, ORF10 protein and surface glycoprotein. The
total of each protein can be seen in Table 1. The most
protein of SARS-COV2 is surface glycoprotein.
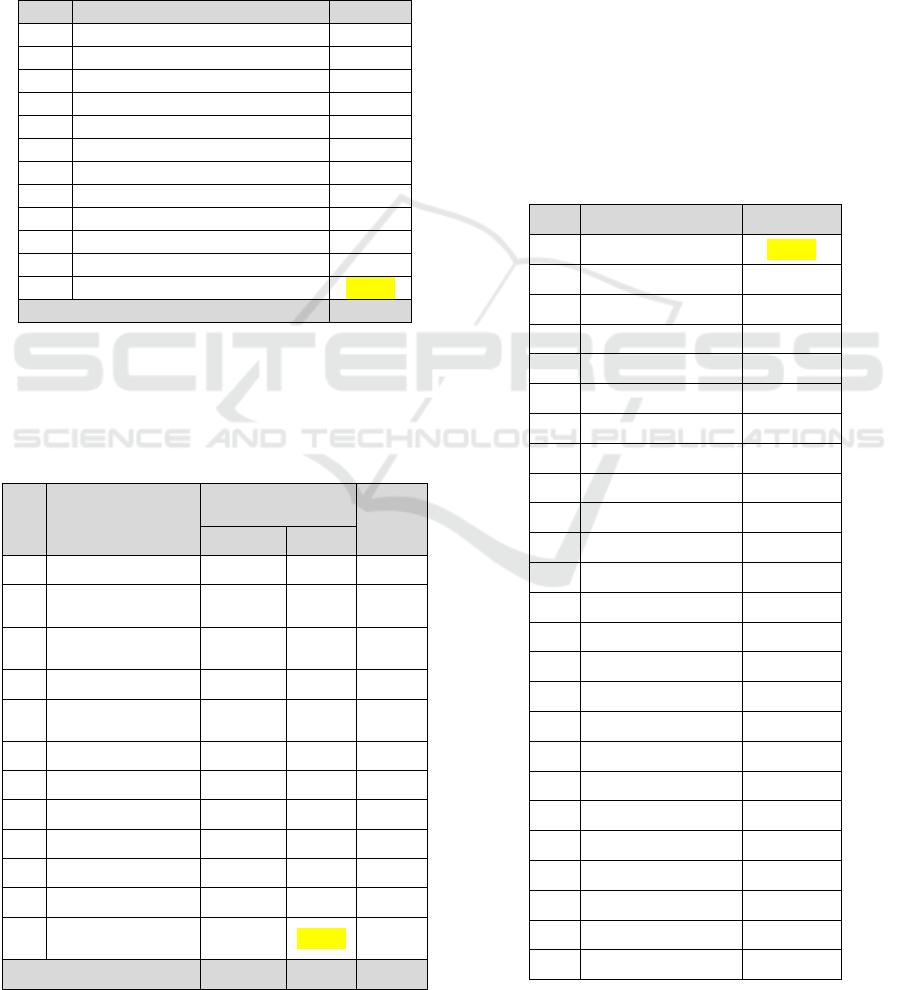
Table 1: Data Training of Total Protein.,
No Protein Total
1 Envelope protein 43.567
2 Membrane glycoprotein 43.804
3 Nucleocapsid phosphoprotein 43.766
4 ORF1a polyprotein 43.833
5 ORF1ab polyprotein 43.852
6 ORF3a protein 43.740
7 ORF6 protein 43.463
8 ORF7a protein 43.460
9 ORF7b protein 43.270
10 ORF8 protein 37.636
11 ORF10 protein 43.363
12 surface glycoprotein 44.080
Grand Total 517.834
Table 2 illustrates the total nucleotide
completeness protein of the SARS-Cov2 class. The
most were partial nucleotide completeness of surface
glycoprotein.
Table 2: Data Training of Nucleotide Completeness Protein.
No Protein
Nucleotide
completeness
Total
Complete Partial
1 Envelope protein 20.384 23.183 43.567
2
Membrane
g
l
y
co
p
rotein
20.384 23.420 43.804
3
Nucleocapsid
p
hosphoprotein
20.384 23.382 43.766
4 ORF1a polyprotein 20.379 23.454 43.833
5
ORF1ab
p
ol
yp
rotein
20.361 23.491 43.852
6 ORF3a protein 20.348 23.392 43.740
7 ORF6 protein 20.371 23.092 43.463
8 ORF7a protein 20.373 23.087 43.460
9 ORF7b protein 20.366 22.904 43.270
10 ORF8 protein 19.856 17.780 37.636
11 ORF10 protein 20.379 22.984 43.363
12
Surface
g
l
y
co
p
rotein
20.385
23.695 44.080
Total 243.970 273.864 517.834
The data collected from 58 geolocations, namely
Argentina, Austria, Bahrain, Bangladesh, Belarus,
Benin, Brazil, Cambodia, Cameroon, Chile, China,
Ecuador, Egypt, Ethiopia, Finland, France, Gabon,
Georgia, Germany, Ghana, Guatemala, Hong Kong,
India, Iran, Iraq, Italy, Japan, Jordan, Kazakhstan,
Lebanon, Mali, Malta, Mexico, Morocco, Myanmar,
New Zealand, Pakistan, Peru, Philippines, Poland,
Portugal, Puerto Rico, Russia, Saudi Arabia, Sierra
Leone, South Korea, Spain, Sweden, Switzerland,
Taiwan, Thailand, Tunisia, Turkey, United Kingdom,
Uruguay, USA, Venezuela and West Bank. Most of
the data come from the USA, as many as 493.154
rows. The surface glycoprotein for each geolocation
illustrates in Table 3. The USA is still the country
which has the most surface glycoprotein. The total
was 41.787.
Table 3: The distribution data of surface glycoprotein based
on geolocation.
No Geo Location Total
1USA
41.787
2 Chile
370
3 Bangladesh
299
4 Egypt
281
5 Pakistan
205
6 Iran
199
7 Ghana
77
8Hon
g
Kon
g
70
9 Turke
y
68
10 Ital
y
64
11 Phili
pp
ines
60
12 Tunisia
59
13 Austria
55
14 Mexico
48
15 Saudi Arabia
46
16 Argentina
43
17 China
34
18 Jordan
27
19 Portugal
22
20 Russia
22
21 S
p
ain
17
22 India
16
23 West Ban
k
16
24 South Korea
15
25 Lebanon
13
ICE-TES 2021 - International Conference on Emerging Issues in Technology, Engineering, and Science
98
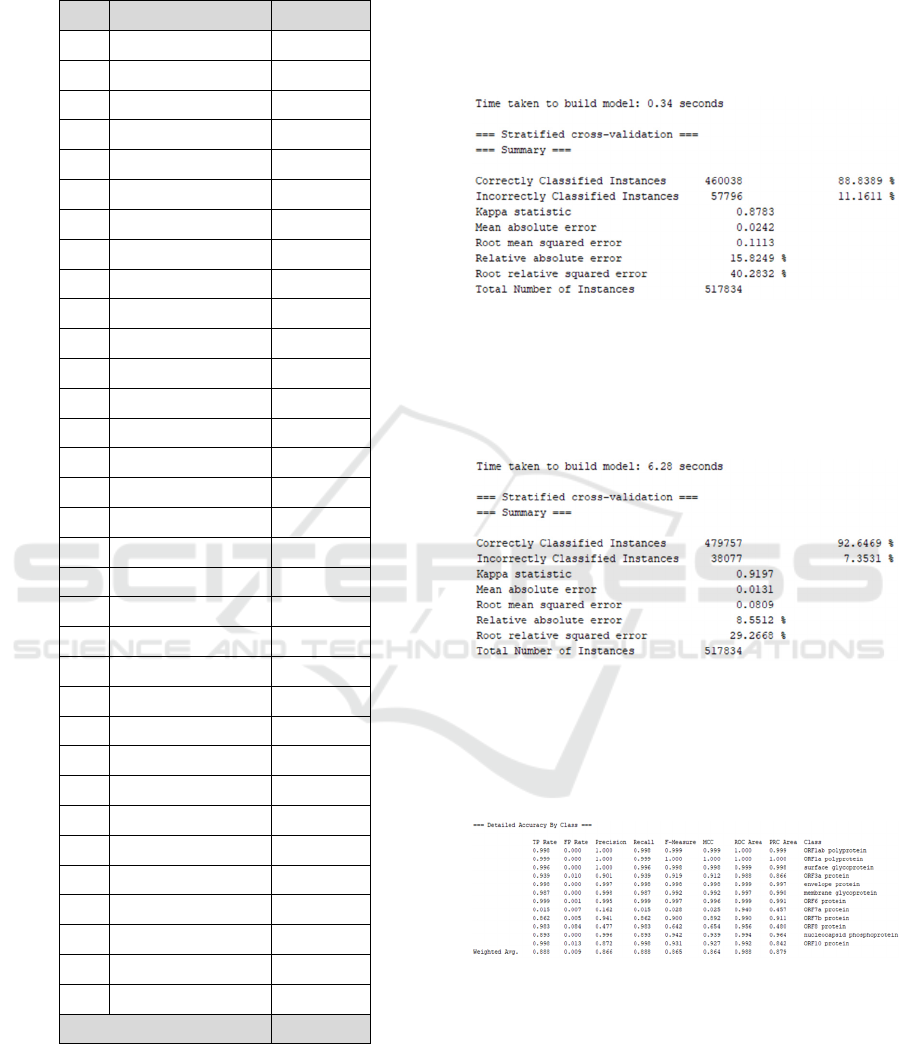
Table 4: The distribution data of surface glycoprotein based
on geolocation (cont.).
No Geo Location Total
26 Benin
12
27 Finlan
d
11
28 Sierra Leone
11
29 Gabon
10
30 Guatemala
10
31 Malta
10
32 Japan
9
33 M
y
anma
r
9
34 Geor
g
ia
7
35 Ira
q
7
36 Polan
d
7
37 Uru
g
ua
y
7
38 France
6
39 Taiwan
6
40 Peru
5
41 Bahrain
4
42 Brazil
4
43 Ecuado
r
4
44 Ethiopia
4
45 United Kin
g
dom
4
46 Venezuela
4
47 German
y
3
48 Mali
2
49 Thailan
d
2
50 Belarus
1
51 Cambodia
1
52 Cameroon
1
53 Kazakhstan
1
54 Morocco
1
55 New Zealan
d
1
56 Puerto Rico
1
57 Sweden
1
58 Switzerlan
d
1
Total 44.080
The distribution data about the length protein of
SARS-Cov2 will not be discussed in this paper,
because of the need to separate sessions. Using data
mining method, the classification data training used
k-fold cross-validation according to protein class. The
value k is 10. After performing 10 folds cross-
validation using WEKA application, then a
classification pattern model will be created. The
pattern model will then be stored for data testing. And
the summary of the J48 and Naïve Bayes
classification pattern models illustrates in Figure 4
and Figure 5.
Figure 3: Summary of Naïve Bayes Algorithm.
Figure 4 shows the results of the Naïve Bayes
algorithm classification, the accuracy of the correctly
classified data amounted to 88.8% and the incorrect
classification amounted to 11.1%.
Figure 4: Summary of J48 Algorithm.
Figure 5 shows the results of the J48 algorithm
classification, the accuracy of the data that is
classified correctly is 92.6% and the incorrect
classification is 7.3%.
Figure 5: Detailed result of Naïve Bayes algorithm.
Figure 6 shows the detailed results of the accuracy
based on the SARS-CoV-2 protein classification class
with the Naïve Bayes algorithm.
Analyse Protein Model of the SARS-CoV-2 Virus using Data Mining Methods
99
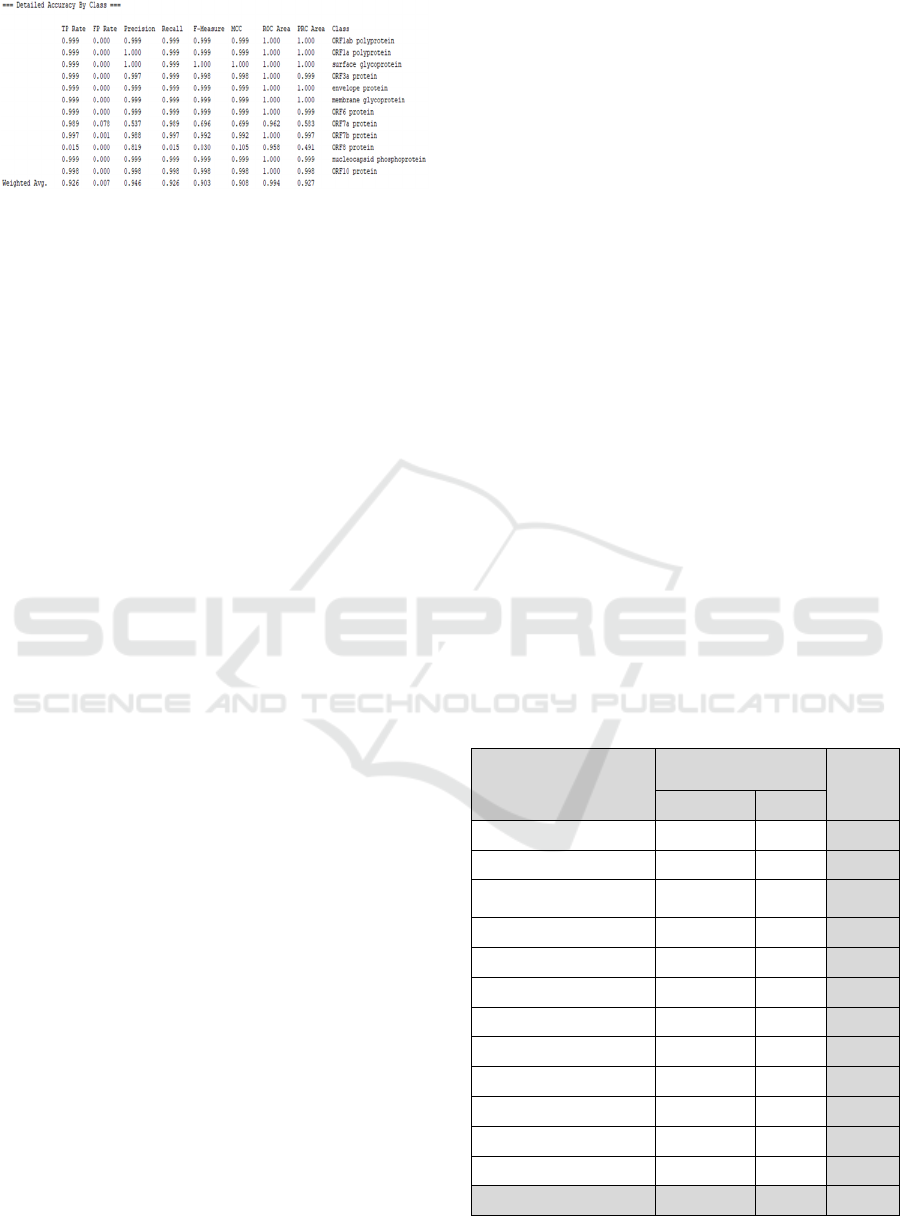
Figure 6: Detailed result of J48 algorithm.
Figure 7 shows the detailed results of the accuracy
based on the SARS-CoV-2 protein class with the J48
algorithm. The following is a detailed explanation
about of the accuracy (Zhu et al., 2010):
a. TP (True Positive) Rate: The true positive rate
refers to positive data that is considered correct by
the classifier.
b. FP (False Positive) Rate: A false positive rate
refers to negative data that is incorrectly labelled
as positive.
c. Precision: Precision can be thought of as a
measure of the accuracy of what percentage of
data label as positive is actually.
d. Recall: A measure of how complete the correct
identified percentage rate is.
e. F-Measure: an alternative to measure precision
and recall with F-measure.
f. MCC: Matthews Correlation Coefficient is a
measure of the coefficient relationship between
classifications to predict. MCC returns a value
between -1 (indicating a failed prediction) to +1
(indicating a perfect prediction).
g. ROC Area: Receiver Operating Characteristics
Area is a test used as a criterion for measuring the
ability of classification performance, the concept
of ROC Area can be interpreted if the data has 2
classes and each has a data, what is the percentage
of correct predictions if the data from the two
classes are predicted. ROC Area is considered as
one of the important outputs where the optimal
ROC area results are close to 1, and 0.5 is
proportional to the "random prediction".
h. PRC Area: If the ROC Area shows an overview
of how classifiers are performing in general,
Precision-Recall Curves are useful for measuring
how classifiers are performing in one class.
For now, we will not discuss accuracy here. The
accuracy will be discussed in other sessions.
Data Testing. From the data training, the USA is the
geolocation with the most data in the NCBI database,
so test data testing will be used from the USA which
is taken randomly. There were 475 data testing that
chosen random from geolocation USA in this phase
ready to proceed. The data that has been determined
then will be loaded into Microsoft Excel to replace
with a question mark as a prediction class. The data
consists of 12 proteins of SARS-Cov2 which have
complete or partial value for nucleotide
completeness.
Nucleotides, which are nucleic acid monomers
(building blocks) that form deoxyribonucleic acid
(DNA) and ribonucleic acid (RNA), which function
as a repository of genetic information. Nucleotides
have three component characteristics, namely
heterocyclic nitrogenous bases, pentose sugars, and
phosphate groups. Nucleotide molecules whose
phosphate groups undergo hydrolysis are called
nucleosides. Bases and pentose sugars that makeup
nucleotides are heterocyclic compounds. The
heterocyclic nitrogen bases that make up the
nucleotides are purines and pyrimidines. There are
four nitrogen bases which are the building blocks of
DNA, namely adenine (A), guanine (G), cytosine (C),
and thymine (T). Meanwhile, the formers of RNA are
adenine (A), guanine (G), cytosine (C), and uracil
(U). Adenine and guanine are purine-type nitrogen
bases while cytosine, thymine, and uracil are
pyrimidine derivatives(National Human Genome
Reasearch Institute National Human Genome
Reasearch Institute, 2014). If the nucleotide
component is complete then the class of nucleotide
completeness has “complete” value, otherwise it is
“partial” (see data in Table 4).
Table 5: Data Testing.
Protein
Nucleotide
Com
p
leteness
Total
Complete Partial
Envelope protein
15 27 42
Membrane glycoprotein
15 27 42
Nucleocapsid
phosphoprotein
15 26 41
ORF1a polyprotein
15 27 42
ORF1ab polyprotein
15 27 42
ORF3a protein
15 26 41
ORF6 protein
15 27 42
ORF7a protein
15 27 42
ORF7b protein
15 26 41
ORF8 protein
4 13 17
ORF10 protein
15 26 41
Surface glycoprotein
15 27 42
Total 169 306 475
ICE-TES 2021 - International Conference on Emerging Issues in Technology, Engineering, and Science
100
2.8 Interpretation/ Evaluation
The next process is to load the J48 and Naïve Bayes
classification models that were made in the previous
stage. After loading the classification model, the test
data can be predicted with the option Re-evaluate the
model on the current test set (see Figure 8 and Figure
9).
Figure 7: Re-evaluation data.
Using the WEKA application, the result of evaluation
using J48 and Naïve Bayes algorithm illustrated in
Figure 9.
Figure 8: Re-evaluation data
of J48 and Naïve Bayes
algorithm sample in WEKA.
2.9 Analysis Protein Model
The result of prediction protein using the J48, and
Naïve Bayes Algorithm summarized in Table 5 and
Table 6. Using the J48 algorithm the most wrong
prediction was ORF7a protein and when using Naïve
Bayes algorithm there was no ORF7a protein in
prediction.
Table 6: Summarize protein model prediction using J48
Algorithm.
No Protein
Prediction
Total
FALSE TRUE
1
Envelope
protein
42
42
2
Membrane
glycoprotein
42
42
3
Nucleocapsid
phosphoprotein
41
41
4
ORF1a
polyprotein
42
42
5
ORF1ab
polyprotein
42
42
6 ORF3a protein 1 41 42
7 ORF6 protein
42 42
8 ORF7a protein 15 42 57
9 ORF7b protein
41 41
10 ORF8 protein
1 1
11 ORF10 protein
41 41
12
Surface
glycoprotein
42
42
Total 16 459 475
Table 7: Summarize protein model prediction using Naïve
Bayes Algorithm.
No Protein
Prediction
Total
FALSE TRUE
1
Envelope
p
rotein
42 42
2
Membrane
g
l
y
co
p
rotein
42 42
3
Nucleocapsid
p
hosphoprotein
41 41
4
ORF1a
p
olyprotein
42 42
5
ORF1ab
p
ol
yp
rotein
42 42
6
ORF3a
p
rotein
41 41
7
ORF6 protein
42 42
8
ORF7b
p
rotein
41 41
9
ORF8
p
rotein
42 17 59
10
ORF10 protein
41 41
11
Surface
g
l
y
co
p
rotein
42 42
Total 42 433 475
Analyse Protein Model of the SARS-CoV-2 Virus using Data Mining Methods
101
3 RESULT AND DISCUSSION
The results of protein analysis can be seen from Table
5. The protein summary prediction model uses the J48
Algorithm. We can see that there are 12 proteins
predicted using the J48 algorithm, namely Envelope
protein, membrane Glycoprotein, Nucleocapsid
phosphoprotein, ORF1a polyprotein, ORF1ab
protein, ORF3a protein, ORF6 protein, ORF7a
protein, ORF7b protein, ORF8 protein, ORF10
protein, and Surface glycoproteins. From the 12
proteins, not all proteins were predicted correctly. For
ORF3a protein and ORF7a protein, not all were
successfully predicted. From the 42 ORF3a proteins,
1 protein could not predictable. And from the 57
ORF7a proteins, there were 15 proteins that could not
be predicted. The summary of 12 protein predictions
using the J48 algorithm were 496 proteins which
correct predictions.
It can also be seen from Table 6. Summarizing the
predictions of the protein model using the Naïve
Bayes Algorithm. We can see that there are 11
proteins that were predicted using the Naïve Bayes
Algorithm are proteins that were also predicted by the
J48 algorithm. There is only 1 protein that cannot be
predicted using Naive Bayes, namely ORF7a protein.
And the ORF8 protein was not predictable at all, there
were 42 unpredictable proteins out of 59 proteins.
And if recap, obtained 433 proteins from the 11 types
of proteins that were successfully predicted using the
Naive Bayes algorithm.
The result of the data testing prediction shows in
Table 7. The J48 algorithm produces a lot of correct
predictive data like the original data than the Naïve
Bayes Algorithm. The ORF7a protein can be
predicted using the J48 algorithm with many false
predictions but cannot be predicted using the Naïve
Bayes algorithm. The comparison between the two
algorithms summarizes in Table 7.
Table 8: Result of Data Testing Prediction.
RESULT
ALGORITHM
J48 NB
TRUE 459 433
FALSE 16 42
4 CONCLUSIONS
The conclusion of this study is that to analyse the
SARC-COV2 protein, data mining methods can be
used by applying the J48 and Naive Bayes algorithms.
When comparing the two algorithms, it can be
proposed using the J48 algorithm, because all
proteins can be predicted even though there are still
prediction errors for the ORF1a protein. Meanwhile,
when using the Naive Bayes algorithm, the ORF1a
protein cannot be predicted at all. For future research,
the J48 algorithm can be compared with other
algorithms besides Naive Bayes. It will hope that the
predictions can get even better results.
ACKNOWLEDGEMENTS
This paper and the research behind it would not have
been possible without the extraordinary support of the
Information Systems study program, the Faculty of
Information Technology, and the ranks of the
Maranatha Christian University LPPM Bandung.
Besides that, also thanks to the head of the Maranatha
Christian University library who always supports the
literature needs and checks the plagiarism of this
research. Thank you also to my husband, my
daughter, and also Hans Adrian, my student as my
partner who accompanied me in carrying out the
research and also wrote the journal until it was
completed well.
REFERENCES
Albahri, A. S., Hamid, R. A., Alwan, J. k., Al-qays, Z. T.,
Zaidan, A. A., Zaidan, B. B., Albahri, A. O. S.,
AlAmoodi, A. H., Khlaf, J. M., Almahdi, E. M., Thabet,
E., Hadi, S. M., Mohammed, K. I., Alsalem, M. A., Al-
Obaidi, J. R., & Madhloom, H. T. (2020). Role of
biological Data Mining and Machine Learning
Techniques in Detecting and Diagnosing the Novel
Coronavirus (COVID-19): A Systematic Review.
Journal of Medical Systems, 44(7).
https://doi.org/10.1007/s10916-020-01582-x
Baker, R. S. J. d. (2010). Data mining. International
Encyclopedia of Education, 112–118.
https://doi.org/10.1016/B978-0-08-044894-7.01318-X
Biswas, A., Bhattacharjee, U., Chakrabarti, A. K., Tewari,
D. N., Banu, H., & Dutta, S. (2020). Emergence of
Novel Coronavirus and COVID-19: whether to stay or
die out? Critical Reviews in Microbiology, 46(2), 182–
193. https://doi.org/10.1080/1040841X.2020.1739001
Christian, H. (2021). ANALISIS AKURASI DATA
PROTEIN VIRUS SARS-COV-2 DENGAN
MENGGUNAKAN METODE DATA MINING.
Christopher P. Austin, M. D. (2014). Bioinformatics.
Usa.Gov. https://www.genome.gov/genetics-
glossary/Bioinformatics
Information, N. C. for B. (2019). Database sars-cov-2.
National Center for Biotechnology Informationter for
ICE-TES 2021 - International Conference on Emerging Issues in Technology, Engineering, and Science
102

Biotechnology Information. https://www.ncbi.nlm.
nih.gov/nuccore/?term=SARS+II
Kalsi, S., Kaur, H., & Chang, V. (2018). DNA
Cryptography and Deep Learning using Genetic
Algorithm with NW algorithm for Key Generation.
Journal of Medical Systems, 42(1).
https://doi.org/10.1007/s10916-017-0851-z
Kc Santosh, Zohora, F. T. (2018). Circle-like foreign
element detection in chest x-rays using normalized
cross-correlation and unsupervised clustering.
(Bio)Medical Imaging, 105741V.
https://www.researchgate.net/publication/320961220_
Circle-like_foreign_element_detection_in_chest_x-
rays_using_normalized_cross-
correlation_and_unsupervised_clustering
Lan, K., Wang, D. tong, Fong, S., Liu, L. sheng, Wong, K.
K. L., & Dey, N. (2018). A Survey of Data Mining and
Deep Learning in Bioinformatics. Journal of Medical
Systems, 42(8). https://doi.org/10.1007/s10916-018-
1003-9
Mohanty, S. K., Satapathy, A., Naidu, M. M.,
Mukhopadhyay, S., Sharma, S., Barton, L. M.,
Stroberg, E., Duval, E. J., Pradhan, D., Tzankov, A., &
Parwani, A. V. (2020). Severe acute respiratory
syndrome disease 19 ( COVID-19 ) – anatomic
pathology perspective on current knowledge.
Diagnostic Pathology, 15(1), 103.
National Human Genome Reaserch Institutetional Human
Genome Reaserch Institute. (2014). Nucleotide.
https://www.genome.gov/genetics-glossary/Nucleotide
Noorimotlagh, Z., Karami, C., Mirzaee, S. A., Kaffashian,
M., Mami, S., & Azizi, M. (2020). Immune and
bioinformatics identification of T cell and B cell
epitopes in the protein structure of SARS-CoV-2: A
systematic review. International
Immunopharmacology, 86(May).
https://doi.org/10.1016/j.intimp.2020.106738
Smith, K. (2019). A Brief History of NCBI’s Formation and
Growth. The NCBI Handbook.
https://www.ncbi.nlm.nih.gov/books/NBK143764/
Wu, A., Peng, Y., Huang, B., Ding, X., Wang, X., Niu, P.,
Meng, J., Zhu, Z., Zhang, Z., Wang, J., Sheng, J., Quan,
L., Xia, Z., Tan, W., Cheng, G., & Jiang, T. (2020).
Genome Composition and Divergence of the Novel
Coronavirus (2019-nCoV) Originating in China. Cell
Host and Microbe, 27(3), 325–328.
https://doi.org/10.1016/j.chom.2020.02.001
Zhu, W., Zeng, N., & Wang, N. (2010). Sensitivity,
specificity, accuracy, associated confidence interval
and ROC analysis with practical SAS®
implementations. Northeast SAS Users Group 2010:
Health Care and Life Sciences, 1–9.
Analyse Protein Model of the SARS-CoV-2 Virus using Data Mining Methods
103
