Estimation of Paddy Leaf Nitrogen Status using a Single Sensor
Multispectral Camera
Muliady Muliady
1a
, Tien Sze Lim
2b
, Voon Chet Koo
2c
and Nathaniel Pius Winata
1d
1
Department of Electrical Engineering, Maranatha Christian University, Jl. Surya Sumantri 65, Bandung, Indonesia
2
Faculty of Engineering and Technology, Multimedia University, Malacca, Malaysia
Keywords: Paddy Leaf Nitrogen Status, Single Sensor Multispectral Camera, Normalized Difference Vegetation Index
(NDVI), SPAD Meter, Regression.
Abstract: Rice consumption will be increasing by 26% in the next 25 years since 2010. The common practice to achieve
high rice production is by fertilizing the paddy with a proper quantity of nutrients, especially nitrogen (N). A
lot of previous researches were done to estimate the paddy N status, starting from using a simple Leaf Color
Chart (LCC) to high technology hyperspectral images taken from a satellite. This research used a MAPIR
Survey3 multispectral camera, which is affordable and gives the advantage of a quick and efficient practice.
The problem came out due to the impossible to fully separate the spectral channels of the images, which
causes low accuracy and imprecise data. This research objective is to correct the data by relating it with a
SPAD meter. A total of 75 paddy plants were sampled in the panicle initiation stage from two paddy fields
located at Margaasih and Cimahi, Jawa Barat, Indonesia. The Normalized Difference Vegetation Index
(NDVI) for each image was calculated after calibrated, cropped, and segmented. The result is a regression
of a 2
nd
order equation with 6.96% of mean error. The regression equation was used to create a SPAD color
map to estimate the paddy leaf N-status.
a
https://orcid.org/0000-0003-0377-1524
b
https://orcid.org/0000-0002-7899-8750
c
https://orcid.org/0000-0002-3617-1069
d
https://orcid.org/0000-0001-6686-9305
1 INTRODUCTION
World rice demand is predicted will be increasing by
26% from 2010 to 2035 (Riaz & Hussain, 2020). The
prediction was projected based on the population
growth data from the United Nations and the income
data from Food and Agricultural Policy Research
Institute (FAPRI). The success in increasing the rice
yield by the previous research is still needed to follow
by a faster rice yield growth to compensate for the
pressure on paddy lands in the developing world from
urbanization, and climate change. One of the most
important factors is crop management, particularly
fertilizing practice. The appropriate time and amount
of fertilizer will significantly improve rice
productivity and reduce production costs. The
conventional practice in implementing fertilizer
management is by predicting the greenness level of
the paddy leaves. The leaf greenness is directly
related to leaf nitrogen (N) status, which is needed to
promote the growth of the paddy. Farmer experiences
and skills to predict the leaf greenness level will be
varied to each other, inaccurate, and imprecise. In
addition, the complexity arises because the level of
leaf greenness depends and changes on the life phase
of the paddy. An inexpensive and easy-to-use tool,
the Leaf Color Chart (LCC), has successfully
improved the farmer decision-making process in N
management and optimize N use at reasonably high
yield levels (Ahmad et al., 2016). The disadvantage
in using LCC is the need for a well-trained skilled
farmer to interpret the color chart. A high
technology device called Soil Plant Analysis
Development (SPAD) chlorophyll meter is widely
used to determine the leaf N level and increased the
efficiency of N fertilizer (Hussain et al., 2009). The
SPAD meter works on measuring the absorbances of
the leaf in the red and near-infrared light wavelength
26
Muliady, M., Lim, T., Koo, V. and Winata, N.
Estimation of Paddy Leaf Nitrogen Status using a Single Sensor Multispectral Camera.
DOI: 10.5220/0010743900003113
In Proceedings of the 1st International Conference on Emerging Issues in Technology, Engineering and Science (ICE-TES 2021), pages 26-31
ISBN: 978-989-758-601-9
Copyright
c
2022 by SCITEPRESS – Science and Technology Publications, Lda. All rights reserved

and calculates a SPAD value that is proportional to
the chlorophyll in the leaf. This will need a lot of work
and time if implemented in a large area of paddy
fields. The modern electronic and computer device
can be used to reduce time and work, (Zhang &
Zhang, 2018) introduced several imaging
technologies for plant high-throughput phenotyping,
including detection of canopy chlorophyll content,
leaf, and canopy senescence. (Muliady et al., 2021)
gave a solution by using a smartphone camera with a
light sensor, and a k-Nearest Neighbor (k-NN)
machine-learning algorithm to estimate the paddy N
status. The paddy leaf N status estimation becomes
easy and affordable since almost everyone owns a
smartphone with a camera. The work (Peter et al.,
2017) demonstrated how a digital camera can be a
low-cost and effective device for estimating the
paddy leaf N status under field conditions. For a large
paddy field area, the application of Unmanned Aerial
Vehicle (UAV) in crop monitoring and pesticide
spraying was evaluated (Mogili & Deepak, 2018).
Finally, a promising result in developing low-cost
multispectral imaging with a UAV system to create
a Normalized Difference Vegetation Index (NDVI)
map (Natividade et al., 2017). Farmers in low-middle
income countries wish to have modern but affordable
technology to assist their fertilizer management of
large paddy fields efficiently.
2 METHODS
The use of high technology devices or high-cost
technology with the support of computer science
does not guarantee the quality in estimating the
paddy leaf N content result. The comparison of a
commercial multispectral camera Parrot Sequoia that
costs USD3,500 while a low-cost multispectral
camera Mapir Survey3 only costs USD400. This
research used Mapir Survey3 camera with a 3.37mm
wide lens which is affordable and can minimize the
effect of the visible light in estimating the paddy leaf
N status but still has the advantage of quick and
efficient field practice.
The main weakness of this affordable
multispectral camera is it only has one sensor to
collect three light wavelengths simultaneously. This
will cause contamination between each light
wavelength and sensitivity to the noise that comes
from the surrounding environment. Another downside
of using is it gives a lower NDVI value than it is
supposed to, even a shaded area gives a higher NDVI
value than the unshaded area. Normally at the
beginning of the panicle phase, paddy will have a
0.63 to 0.72 NDVI value (Lestari et al., 2020). This
research objective is to correct and map the
calculated NDVI value of multispectral image from
a Mapir Survey3 Camera with a SPAD meter.
The experiments were taken in two paddy fields
in Jawa Barat - Indonesia, which is located in the
southern and northern part of Bandung city. The first
paddy field is located at Ciawitali, Citeureup,
Kecamatan Cimahi Utara-Cimahi, and the second
one is located at Cibisoro, Nanjung, Kecamatan
Margaasih-Bandung. The work consists of three
steps which are processing and calculating the
multispectral images into NDVI value, measuring
the leaf’s SPAD value, and regression analysis. All
the data was taken at the vegetation stage of the
paddy, right before the panicle stage, about 67 days
after transplanting. It is usually considered as the
time for the farmer to fertilize their paddy field, and
high concern about the nutrition is needed to prepare
the paddy for the reproductive phase. The
multispectral images were taken manually at a high
angle position. This position allowed the canopy of
the paddy plant to be captured for estimating the leaf
N status as suggested in (Yu et al., 2013).
2.1
Multispectral Images
The selection of Mapir Survey3 Camera filter will
highly influent the contrast between the soil and the
paddy plant. As suggested in Mapir’s manual guide,
the one with Orange Cyan Near-Infrared (OCN)
filter has better contrast than the generally used Red
Green Near-Infrared (RGN) filter. One of the most
frequently used Vegetation Indices (VIs) is a
normalized ratio between the red and near-infrared
bands be known as the Normalized Difference
Vegetation Index (NDVI) (Xue & Su, 2017). The
NDVI simply shows the plant photosynthetic
activity in values between − 1 and 1. A low NDVI
value indicates moisture-stressed vegetation and a
higher value indicates a higher density of green
vegetation.
The field experiment shows that the multispectral
images were affected by the intensity and the
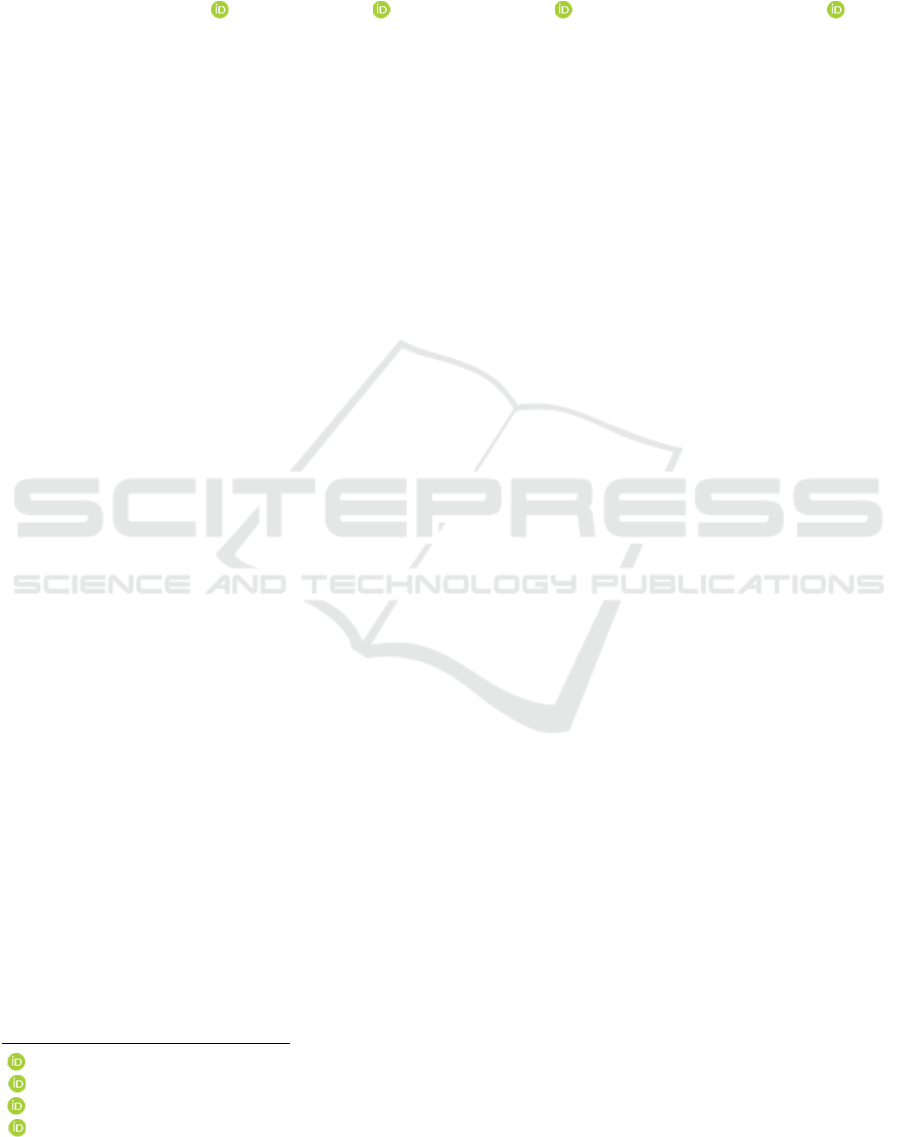
direction of the sunlight. A calibration target in
Figure 1 is supplied by Mapir, was used to
compensate for the light intensity of the paddy
images, and then calibrate them in a computer using
Mapir Camera Control application. The calibration
target has a QR code on the right side and four
pieces of calibration surface on the left side. The
calibration process uses a linear regression between
4 points comparing pixel values to known target
reflectance. The calibration target and the paddy
Estimation of Paddy Leaf Nitrogen Status using a Single Sensor Multispectral Camera
27
images should be taken under the same or similar
light intensity.
Figure 1: The calibration target.
The paddy plants with a minimum of 10 tillers
were randomly chosen for data analysis, 25 paddy
plants from Ciawitali field, and 50 paddy plants
from Cibisoro field. Each paddy plant was marked
with a number and captured in 3 different canopy
angles to minimize the effect of sunlight direction.
From these 3 images, their NDVI value will be
calculated ang then averaged to represent the NDVI
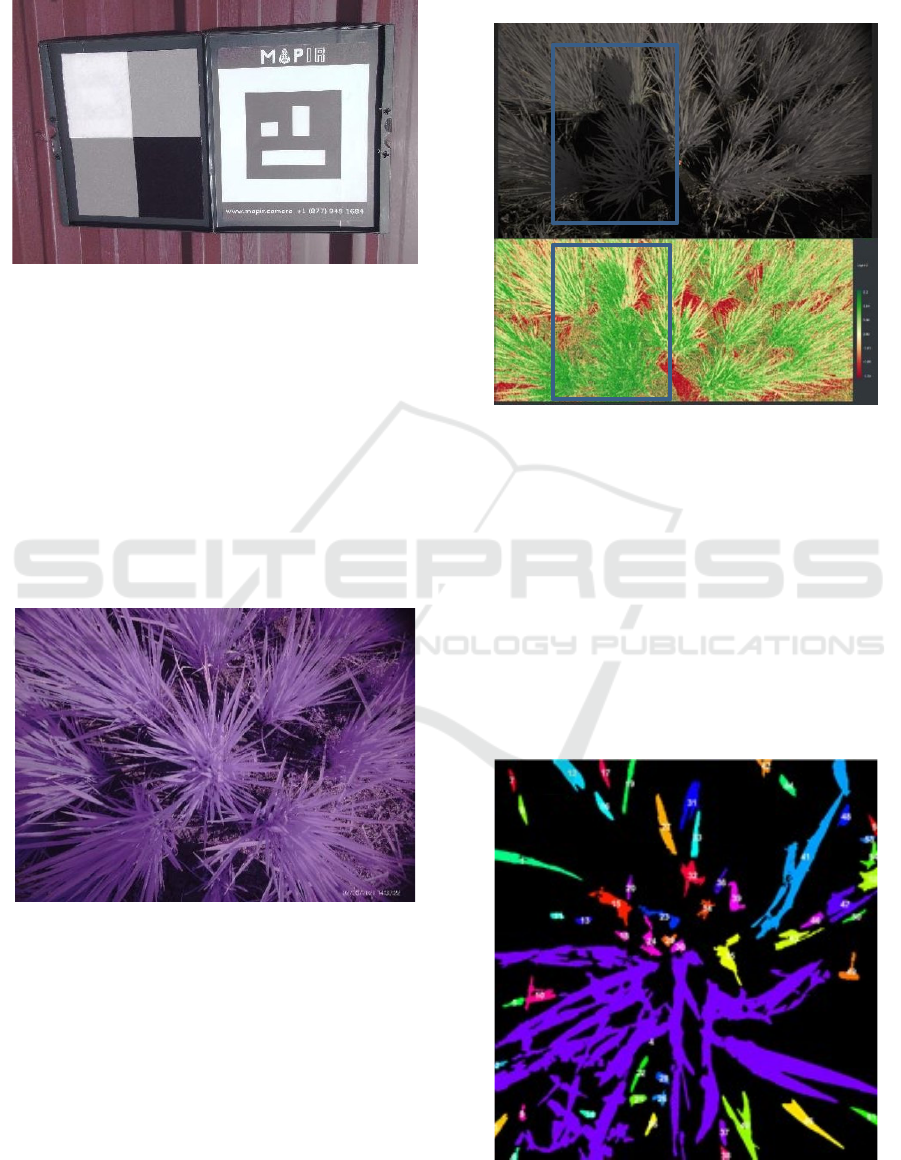
value of the paddy plant. Figure 2 shows the image
sample of OCN paddy plant, the one located at the
center of the image is considered as the object that
will be analyzed.
Figure 2: The paddy plant in OCN image.
The direction of sunlight usually generates a
shaded area on the image that should be avoided. By
referring to the NDVI color chart on the right side, the
leaf with a shaded area in Figure 3 has a higher NDVI
value (dark green) compared to the other areas. To
minimize this error the images should be taken in the
mid-day, about 10.00 A.M. to 2.00 P.M, which will
give a minimum shaded area for the leaf canopy.
After the images were processed and calibrated
using Mapir Control Camera application, they were
cropped manually to have only one paddy plant.
Before the NDVI value is calculated, the image will
be segmented.
Figure 3: The shaded area increases the NDVI value.
2.1.1
Segmentation
The cropped OCN images were segmented in two
steps process, the first one is to eliminate the soil
background by separating the pixels with the Near-
Infrared (NIR) intensity value of more than 8000 as
paddy leaves. The second segmentation is to classify
the leaves into several groups based on the nearest
NIR band intensity which is shown in Figure 4. The
group with the most pixels is selected to represent
the paddy plant for example the violet pixels in
Figure 4.
Figure 4: The image segmentation process.
ICE-TES 2021 - International Conference on Emerging Issues in Technology, Engineering, and Science
28
2.1.2
NDVI Calculation
The leaf NDVI value was calculated using Equation
1 after the segmentation process was done. The
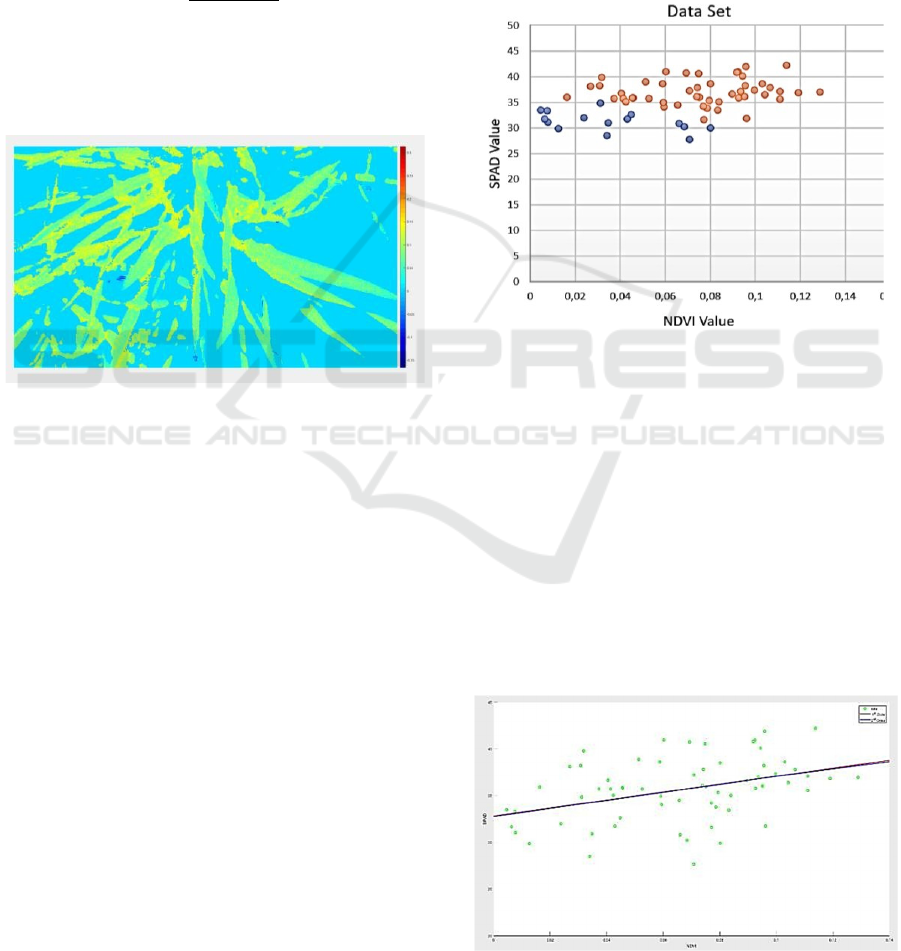
result is shown in Figure 5 with the color map. The
final NDVI value that represents the paddy plant
was obtained by calculating the average NDVI of all
segmented leaf pixels. The calculation and color
plotting was done in Matlab.
(𝑁𝐼𝑅 − 𝑂)
𝑁𝐷𝑉𝐼 =
(𝑁𝐼𝑅 + 𝑂)
(1)
Where:
NIR is a reflectance in the near-infrared band; O is a
reflectance in the orange band
Figure 5: The color map of NDVI value.
2.2
SPAD Value
TYS-4N model of the SPAD meter was used as a
benchmark to be compared with the NDVI value.
The reference (Yuan et al., 2016) suggested
measuring the SPAD value at one-third from the
fourth leaf tip. To minimize the human error in
measuring the SPAD value, each leaf was measured
a minimum of 5 times, and conduct the measuring to
a minimum of 5 tillers with a full open fourth leaf.
The average value was calculated after eliminating
the outlier and represent the SPAD value of the
paddy plant.
2.3
Regression Analysis
The sampled data were collected from the Ciawitali
paddy field is 25 paddy plants and the other 50
paddy plants from the Cibisoro paddy field. Since
each paddy plant was captured 3 times, the total of
images was 225. Although the sampled data were
carefully taken and repeated several times, some of
the data need to be checked. The imprecise and
untrusted data will be eliminated. The imprecise data
was defined by a significant difference in NDVI
value between 3 OCN images. As an example, the
paddy plant number 11 in the Ciawitali field has
calculated NDVI from the first until third OCN
images respectively, 0.092, 0.017, and 0.042.
Finally, only 15 data set from the Ciawitali field in
blue color, and 49 data set from the Cibisoro field in
orange color were selected and plotted in Figure 6.
The paddy in the Ciawitali has a relatively lower
SPAD value than the paddy in the Cibisoro field.
Figure 6: The final data set distribution.
The regression equation was expressed in 1
st
and
2
nd
order using Equation 2. The results were shown
in Figure 7, with the red and blue line is constructed
from the 1
st
order and 2
nd
equation respectively.
Both of the equations have several similarities,
which are the same mean error of 6.96%, and
correlation of 0.39, a closed value of slope (B), and
y-axis intercept (C).
𝑦 =
𝐴
𝑥
2
+ 𝐵𝑥 + 𝐶
(2)
1
st
order: A=0, B=42.55, C=32.84
2
nd
order: A=-21.72, B=45.27, C=32.77
Figure 7: The regression line.
Estimation of Paddy Leaf Nitrogen Status using a Single Sensor Multispectral Camera
29
3 RESULTS AND DISCUSSION
The 2
nd
order regression was implemented to create
a color map that shows the SPAD value of the
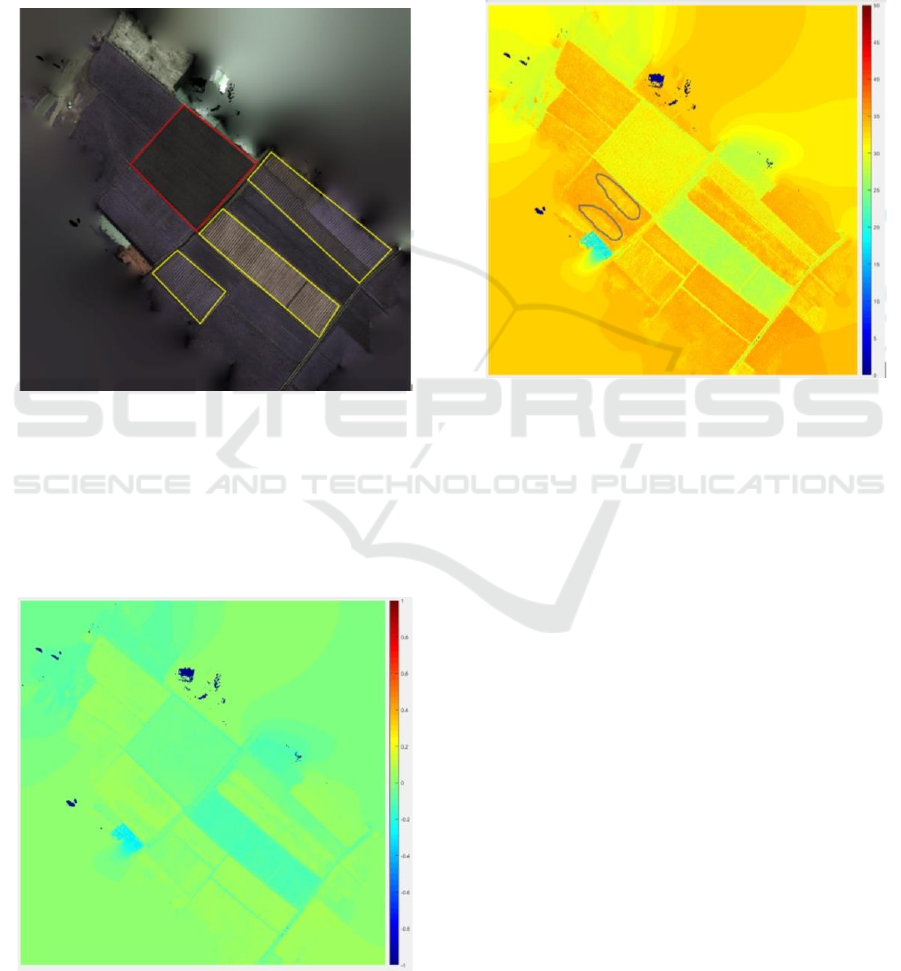
Cibisoro paddy field. Figure 8 is a Cibisoro paddy
field stitching image from the OCN images were
taken by DJI Phantom 4 Pro Obsidian. The field in a
red rectangular indicates the new paddy just planted.
The yellow rectangular is kale vegetable field.
Figure 8: OCN image.
Figure 9 shows the NDVI color map of the
Cibisoro paddy field, with the NDVI value between
0.1 to 0.3. The map also shows the heterogenous of
the paddy leaf N status, but could not gives more
information about the fertilizer sufficiency regarding
the inaccurate NDVI value.
Figure 9: NDVI color map.
Figure 10 is the SPAD color map and shows the
distribution of the paddy N status. A high yield
paddy usually has a SPAD value between 35.4 to
40.1 (Swain & Jagtap Sandip, 2010). The grey
marking on the map is the paddy with a low SPAD
value of about 30 that indicates the deficiency of N
fertilizer. In practice, this SPAD color map will help
the farmers to analyze their paddy field, and the
treatment needs to conduct to gain a high rice yield.
Figure 10: SPAD color map.
4 CONCLUSIONS
The research work process has successfully built a
SPAD color map that can be used to estimate the
paddy leaf N status. The SPAD value is presented
clearly, and informatively in high contrast color.
This quick and efficient analysis process starts with
capturing the NDVI image using a drone attached
with Mapir Survey3 OCN camera when the paddy
enters the panicle initiation phase and processes the
images with a computer to have a SPAD color map.
Future work can be improved by reducing the mean
error using a machine learning algorithm.
REFERENCES
Ahmad, N., Zada, A., Junaid, M., & Ali, A. (2016).
Bridging the Yield Gap in Rice Production by Using
Leaf Color Chart for Nitrogen Management. Journal
of Botany, 2016. https://doi.org/10.1155/2016/
2728391
Hussain, M. Z., Khan, S. A., & Thiyagarajan, T. M.
(2009). Increasing Nitrogen Use Efficiency in Rice
(Oryza Sativa L.) with Chlorophyll Meter and Leaf
ICE-TES 2021 - International Conference on Emerging Issues in Technology, Engineering, and Science
30

Color Chart. The IUP Journal of Soil and Water
Sciences Vol II No 4 Pp 3654 November 2009.
https://doi.org/10.2139/ssrn.1513199
Lestari, E. A. P., Supriatna, & Damayanti, A. (2020).
Model of paddy rice phenology using Sentinel 2- A
imagery with NDVI algorithm in Subang Regency.
IOP Conference Series: Earth and Environmental
Science, 481(1). https://doi.org/10.1088/1755-1315/
481/1/012069
Mogili, U. R., & Deepak, B. B. V. L. (2018). Review on
Application of Drone Systems in Precision
Agriculture. Procedia Computer Science, 133, 502–
509. https://doi.org/10.1016/j.procs.2018.07.063
Muliady, M., Tien Sze, L., Voon Chet, K., & Patra, S.
(2021). Classification of rice plant nitrogen nutrient
status using k-nearest neighbors (k-NN) with light
intensity data. Indonesian Journal of Electrical
Engineering and Computer Science, 22(1), 179.
https://doi.org/10.11591/ijeecs.v22.i1.pp179-186
Natividade, J., Prado, J., & Marques, L. (2017). Low-cost
multi-spectral vegetation classification using an
Unmanned Aerial Vehicle. 2017 IEEE International
Conference on Autonomous Robot Systems and
Competitions, ICARSC 2017, 336–342.
https://doi.org/10.1109/ICARSC.2017.7964097
Peter, J., Rischbeck, P., Hu, Y., Kipp, S., Hu, Y.,
Barmeier, G., Mistele, B., & Schmidhalter, U. (2017).
Use of a digital camera as alternative method for non-
destructive detection of the leaf chlorophyll content
and the nitrogen nutrition status in wheat. Computers
and Electronics in Agriculture, 140, 25–33.
https://doi.org/10.1016/j.compag.2017.05.032
Riaz, U., & Hussain, S. (2020). Overview and
Perspectives of Food Security. January.
Swain, D. K., & Jagtap Sandip, S. (2010). Development of
SPAD Values od Medium-and Long-duration Rice
Variety for Site-specific Nitrogen Management.
Journal of Agronomy, 9(2), 38–44.
https://doi.org/10.3923/ja.2010.38.44
Xue, J., & Su, B. (2017). Significant remote sensing
vegetation indices: A review of developments and
applications. Journal of Sensors, 2017.
https://doi.org/10.1155/2017/1353691
Yu, K., Li, F., Gnyp, M. L., Miao, Y., Bareth, G., & Chen,
X. (2013). Remotely detecting canopy nitrogen
concentration and uptake of paddy rice in the
Northeast China Plain. ISPRS Journal of
Photogrammetry and Remote Sensing, 78(April), 102–
115. https://doi.org/10.1016/j.isprsjprs.2013.01.008
Yuan, Z., Cao, Q., Zhang, K., Ata-Ul-Karim, S. T., Tan,
Y., Zhu, Y., Cao, W., & Liu, X. (2016). Optimal leaf
positions for SPAD meter measurement in rice.
Frontiers in Plant Science, 7 (May 2016), 1–10.
https://doi.org/10.3389/fpls.2016.00719
Zhang, Y., & Zhang, N. (2018). Imaging technologies for
plant high-throughput phenotyping: A review.
Frontiers of Agricultural Science and Engineering.
https://doi.org/10.15302/J-FASE- 2018242
Estimation of Paddy Leaf Nitrogen Status using a Single Sensor Multispectral Camera
31
