
Exploration of an Indonesian Currency Legality Detection System by
Utilizing Image Intensity of RGB Mean Values
Ratnadewi Ratnadewi
1a
, Aan Darmawan Hangkawidjaja
1b
, Agus Prijono
1c
,
Rudy Wawolumaja
2d
, Kartika Suhada
2e
, Maria Christine Sutandi
3f
,
Andrew Sebastian Lehman
4g
, Elty Sarvia
2h
and Kervin Lusiano
1i
1
Department of Electrical Engineering, Maranatha Christian University, Jl. Surya Sumantri 65, Bandung, Indonesia
2
Department of Industrial Engineering, Maranatha Christian University, Jl. Surya Sumantri 65, Bandung, Indonesia
3
Department of Civil Engineering, Maranatha Christian University, Jl. Surya Sumantri 65, Bandung, Indonesia
4
Department of Computer Engineering, Maranatha Christian University, Jl. Surya Sumantri 65, Bandung, Indonesia
rudy.wawolumaja@eng.maranatha.edu, kartika.suhada@eng.maranatha.edu, maria.cs@eng.maranatha.edu,
andrew.sl@eng.maranatha.edu, elty.sarvia@eng.maranatha.edu, kervinlusiano17@yahoo.com
Keywords: Naïve Bayes, Entropy, Contrast, Correlation, Energy, Homogeneity, RGB.
Abstract: Money is one of the objects used by the public to carry out legal buying and selling transactions in a country.
The problem is there are fake bills that are printed by irresponsible people, so everyone needs to be able to
know that the banknotes received is fake or genuine. But not everyone can detect the authenticity of a
banknote, so a tool is needed to detect the banknote is genuine or fake. In this paper, software has been
designed to detect the authenticity of Indonesian currency. In this paper, feature extraction of the grey level
co-occurrence matrix with the features of entropy, contrast, correlation, energy and homogeneity is used to
detect the nominal value of Indonesian banknotes and to detect the validity of Indonesian banknotes; the
extraction of red-green-blue features with features is used mean R, mean G and mean B. The detected
Indonesian currency was Indonesian currency from 2004-2016, with nominal values of Rp. 1000, Rp. 2000,
Rp.5000, Rp. 10000, Rp. 20000, Rp. 50000, and Rp.100000. The classification process uses Naïve Bayes.
From the test results, the system works well for reading the nominal value of Indonesian banknotes and
detection the validity of the money can function properly.
1 INTRODUCTION
The rapid development of science and technology
encourages humans to create tools that can simplify
human work, one of which is a tool to read the
nominal value of money and detect the authenticity of
banknotes. After using this tool then humans will
more easier to save and withdraw money from an
automatic cash withdrawal deposit machine or also
a
https://orcid.org/0000-0001-6487-8101
b
https://orcid.org/0000-0002-6474-8013
c
https://orcid.org/0000-0001-6287-8781
d
https://orcid.org/0000-0003-3975-4830
e
https://orcid.org/0000-0002-8126-300X
f
https://orcid.org/0000-0002-8352-5675
g
https://orcid.org/0000-0002-7311-1209
h
https://orcid.org/0000-0003-3708-8723
i
https://orcid.org/0000-0002-4906-3227
known as an Automatic Teller Machine (ATM) and
there are also several machines that deal with money,
for example vending machines that sell tickets trains,
or sell drinks and others.
Some of the research that have been carried out
will be presented here: detecting the authenticity of a
currency through digital image processing, the Bit
Plane Slicing technique is used to extract the most
significant features and the application of the Canny
Ratnadewi, R., Hangkawidjaja, A., Prijono, A., Wawolumaja, R., Suhada, K., Sutandi, M., Lehman, A., Sarvia, E. and Lusiano, K.
Exploration of an Indonesian Currency Legality Detection System by Utilizing Image Intensity of RGB Mean Values.
DOI: 10.5220/0010743700003113
In Proceedings of the 1st International Conference on Emerging Issues in Technology, Engineering and Science (ICE-TES 2021), pages 9-17
ISBN: 978-989-758-601-9
Copyright
c
2022 by SCITEPRESS – Science and Technology Publications, Lda. All rights reserved
9

edge detection algorithm is also used. The image of
banknotes with 256 grey-levels is decomposed into 8
binary images. Images that have a higher bit order
rate are evaluated for image grayscale banknotes by
applying the Canny edge detection algorithm. Then
the results are compared between real and counterfeit
banknotes using the same detection technique. From
the observation, it was found that the results of edge
detection using an image that was sliced by bit-plane
results were more accurate and could detect it faster
than directly processing the original image without
being sliced. The limitation problem in this study is
that detection is only for Kuwait banknotes based on
the features of the money and comparisons are made
between real money and counterfeit money based on
component connectivity features, average value,
standard deviation and SNR. The further research
suggested in this paper is carried out by expanding
the scope of observations to colour images using six
bit-planes to verify that will be produced more detail
from grayscale bit-planes (Alshayeji et al., 2015).
In this paper discusses the detection of counterfeit
banknotes using ordinary light rays, the observed
attributes of watermarks and recto verso and currency
ornaments. The image of banknotes is carried out by
the process of converting a colour image into an
image with a grey level, the process of edge detection,
feature extraction, matching of results against
predetermined areas. In this paper, there are no
quantitative or qualitative observations (Giri, 2019).
In this article explains the detection Indian
banknotes using digital image processing techniques.
There are six characteristics of Indian banknotes
chosen to detect counterfeiting, including:
identification mark, security thread, watermark,
numeric watermark, floral design and micro lettering.
Extraction of characteristic features is carried out on
the image and compared with the characteristic
features of the original banknotes. Decision making
is done by counting black pixels. In this article
explain to design a low cost system and a fast decision
making system. The proposed method is inspired by
the analysis of hidden marks on the image of
banknotes. The image of the banknote is obtained
through the camera by applying a white backlight to
the banknote, so that a hidden currency sign appears
in the image. The image is further processed by
applying image processing techniques, such as: image
pre-processing, edge detection, image segmentation,
characteristic extraction. The feature extraction
process can be extended up to 100 Rupees. Six
features are extracted within 1 second. The complete
methodology was carried out for Indian banknotes of
20,50,100, 500 and 1000. The method is very simple
and easy to apply. If the hardware is designed for
image acquisition it helps to minimize the currency
counterfeiting problem. This technique is used to
extract six characteristics of banknotes which include
identification marks, security threads, floral designs,
numeric watermarks, and watermarks (Pambudi et al.,
2016), and the micro letter on the security thread. The
system also extracts hidden features, namely the
latent images of banknotes. The proposed work is an
approach to the extraction of the characteristics of
Indian banknotes. The serial number can also be
extracted using a latent image extraction procedure.
The system can extract features even though the test
image size is different when compared to the
reference image (Prasanthi & Setty, 2015).
The circulation of counterfeit money in Indonesia
at this time may not have invisible ink. Invisible ink
is a security feature for banknotes, and money
counterfeiters do not have the ability to counterfeit
invisible ink in Indonesia. The banknotes genuine or
fake are determined by identifying the presence of
invisible ink. This research developed a software to
determine the nominal value of a banknotes and its
authenticity through one of the banknotes safeguards
features, namely invisible ink.
This software uses Digital Image Processing
technology as an authentication process and Artificial
Neural Networks more specifically Learning Vector
Quantization neural networks (Indradewi &
Ariantini, 2018) as an identification process. In the
authentication process, several processes are carried
out, namely the segmentation process that uses the
green histogram threshold value, the area calculation
process using the chain-code method, and the area
filter process, while the process of identifying the
nominal Indonesian currency (IDR) is carried out by
the feature extraction process with Discrete Fourier
Transform (TFD) and LVQ neural network. The trial
results showed that the average percentage of success
at the authentication stage was 98.77% and the
average percentage at the identification stage of the
Indonesian currency (IDR) was 77.604% (Rijal,
2008).
The main hypothesis of a digital image processing
system can be used to detect Indonesian currency
(IDR) and read the nominal value of Indonesian
currency (IDR). In general, Indonesian currency
(IDR) detection and reading of the nominal value of
Indonesian currency (IDR) can be realized with
software using two lighting, namely an ordinary
lighting and an ultra violet lighting with methods for
digital signal processing.
ICE-TES 2021 - International Conference on Emerging Issues in Technology, Engineering, and Science
10

2 METHODS
In this study, two procedures were used, namely, first
using an ordinary lighting, the second using an ultra
violet lighting.
2.1 Indonesian Currency (IDR)
Nominal Value Detection System
The process of using an ordinary lighting aims to read
the nominal Indonesian currency (IDR) using the
Naïve Bayes classifier. The system design of this
ordinary procedure can be seen in Figure 1. First to
be done is inputting scanned normal image, then the
system will do pre-processing. Pre-processing is the
process in order to get optimal image results, so that
it is easy to carry out the next process. After doing
pre-processing, then the next step is feature extraction
with analysis using the Grey Level Co-occurrence
Matrix (GLCM) method. From the GLCM analysis,
the entropy value, contrast value, correlation value,
energy value and homogeneity value will be obtained.
After carrying out the feature extraction stage, the
next process will be classified with the naïve Bayes
classifier, after being classified, the final value will be
in the form of a nominal Indonesian currency (IDR).
Figure 1: Ordinary detection system nominal value for
money.
The second procedure is using an ultraviolet
lighting which aims to detect the validity of the
Indonesian currency (IDR). First of all to be done is
that the money is irradiated with ultra violet then
photographed and get a UV image, then the ultra
violet image will be passed in the pre-processing
process, namely crop at the water point you want to
detect, after the pre-processing stage, then the
features will extracted for each Red, Green, image.
and Blue and will produce the mean r, mean g and
mean b feature values. After getting the mean R, G
and B feature values, it will be classified with the
naïve Bayes classifier. Then the output will be
generated whether the money is real or fake.
2.2 Nominal Value in Indonesian
Currency (IDR)
Indonesian banknotes are money in the form of sheets
made of paper issued by the Indonesian government,
in this case Bank Indonesia, whose the usage is
protected by Law No.23 of 1999 and legally used as
a means of exchange for payments within the territory
of the Republic of Indonesia. In this study, the money
that will be examined is the Indonesian banknotes
from 2004 to 2016 in the form of Rp. 1,000, Rp.
2,000, Rp. 5,000, Rp. 10,000, Rp. 20,000, and Rp.
50,000, Rp. 75,000, and Rp. 100,000 (Figure 2).
There are several characteristics of the
authenticity of Indonesian currency (IDR), prior to
2016, namely: 1. Recto verso: the BI logo which will
be completely visible when exposed; 2. Latent Image:
the hidden BI logo can be seen from a certain point of
view; 3. Watermark: in the form of a picture of a
National Hero that will be visible when viewed; 4.
Security thread: thread embedded in the paper bearing
the inscription of Bank Indonesia and flashing red
when under UV light; 5. Micro-writing: Bank
Indonesia writing which can only be read with the
assistance of Loupe; 6. Micro letters: BI letters which
can only be read with the help of Loupe; 7. Serial
number: consists of 3 letters and 6 numbers which
will change colour when under UV light; 8. Blind
code that has the shape of a rectangular box, two
squares, a circle, two triangles and two circles that
feels rough when touched; 9. Visible ink: ink in the
form of Kalimantan ornaments, Palembang
ornaments, Balinese ornaments that will brighten
colours when under UV light; 10. Invisible ink:
nominal numerical ink that will glow when under UV
light; 11. Print a rainbow in a rectangular shape that
will change colour when viewed from a different
perspective.
Take Image
with Camera
Preprocessing
GLCM
Naïve Bayes
Rupiah
Nominal Value
Exploration of an Indonesian Currency Legality Detection System by Utilizing Image Intensity of RGB Mean Values
11
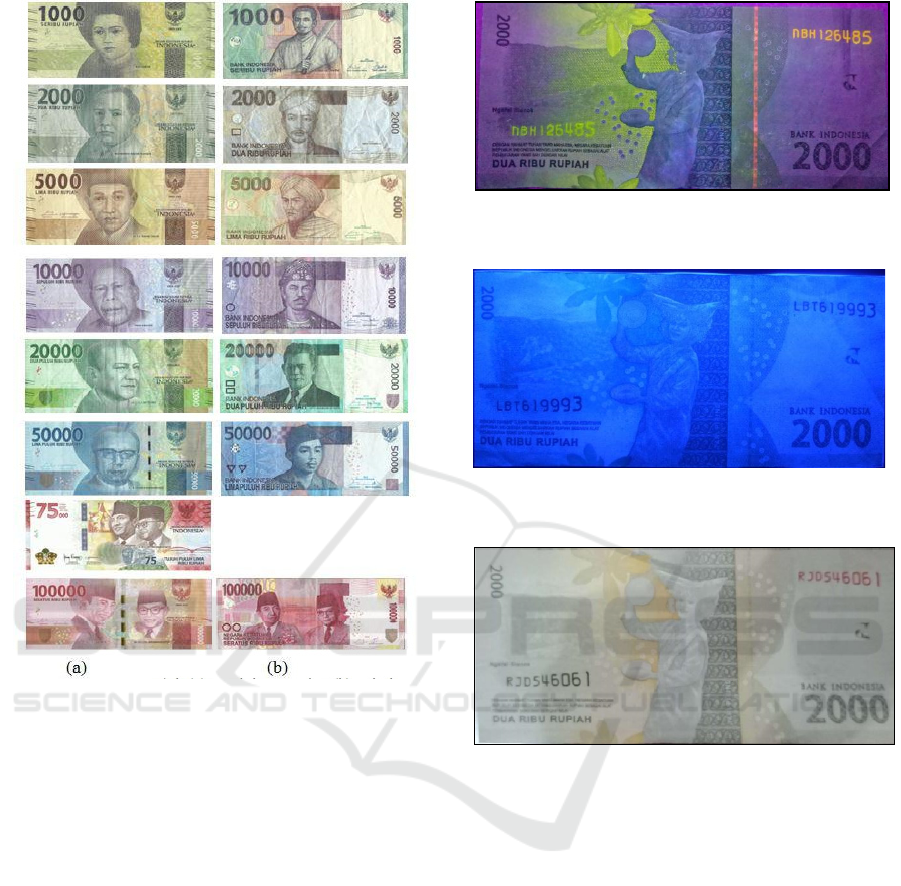
Figure 2: Indonesian banknotes (a) after 2016 and (b)
before 2016.
2.3 Indonesian Currency (IDR)
Legality Detection System
The process of legality of the Indonesian currency
(IDR) can be seen when using an ultra violet lighting.
Ultra violet light hitting the special ink on the
Indonesian currency (IDR) will cause the appearance
of the banknotes to differ between fake and real
money.
Figure 3 is an example of the appearance of real
banknote when viewed with an ultra violet lighting,
and Figure 4 is an example of the appearance of fake
banknote when viewed with an ultra violet lighting.
Figure 5 is banknote photographed with a regular
lighting. The full design of the proposed Indonesian
Currency (IDR) legality detection system can be seen
in Figure 6. The presence of special inks used causes
authenticity can be distinguished by calculating the
mean value of each component Red, Green, and Blue.
Figure 3: Valid Indonesian currency (IDR) as seen in ultra
violet light.
Figure 4: Fake Indonesian currency (IDR) seen in ultra
violet light.
Figure 5: Valid Indonesian currency (IDR) seen with a
ordinary lighting.
2.4 Gray-Level Co-occurrence Matrix
(GLCM)
One approach in describing texture is to use a
statistical moment of histogram of the intensity of an
image. Statistics method such as a matrix of shared
events are important to get valuable information
about the relative position of neighbouring pixels of
an image (Eleyan & Demirel, 2011) this method is
used to identify textiles by (Azim, 2015). Co-
occurrence matrix P is defined as described in
equation 1.
The reviews of some features of a digital image
by using GLCM are also given in this sub-section.
Those are Energy, Contrast, Correlation, and
Homogeneity (features vector). The energy known as
uniformity of ASM (Angular Second Moment)
calculated as given in equation 2.
ICE-TES 2021 - International Conference on Emerging Issues in Technology, Engineering, and Science
12

Energy =
∑
∑
𝑃𝑖,
𝑗
(2)
Figure 6: Indonesian Currency (IDR) legality detection
system.
Contrast measurements of texture or gross
variance, of the grey level. The difference is expected
to be high in a coarse texture if the grayscale contrast
is significant local variation of the grey level.
Mathematically, this feature is calculated as defined
in equation 3.
Contrast =
∑
∑
𝑖
𝑗
𝑝𝑖,
𝑗
(3)
Texture correlation measures the linear
dependence of grey levels on those of neighbouring
pixels. This feature is computed as defined in
equation 4.
Correlation =
∑
∑
,
(4)
Where:
𝜇
𝑀
𝑝
𝑚,𝑛
𝜇
𝑁
𝑝
𝑚,𝑛
𝜎
𝑚 𝜇
𝑝𝑚,𝑛
𝜎
𝑛 𝜇
𝑝𝑚,𝑛
(5)
(6)
(7)
(8)
The homogeneity measures the local correlation a
pair of pixels. The homogeneity should be high if the
grey level of each pixel pair is similar. This is
calculated by the function in equation 9.
Homogeneity =
∑
∑
,
(9)
2.5 Naïve Bayes Classifier
The Naive Bayes algorithm is a simple probabilistic
classifier that calculates a set of probabilities by
counting the frequency and combinations of values in
a given data set. The algorithm uses Bayes theorem
and assumes all attributes to be independent given the
value of the class variable. This conditional
independence assumption rarely holds true in real
world applications, hence the characterization as
Naive yet the algorithm tends to perform well and
learn rapidly in various supervised classification
problems. Naïve Bayesian classifier is based on
Bayes’ theorem and the theorem of total probability.
The probability that a document d with vector 𝑥
〈𝑥
,…𝑥
〉 belongs to hypothesis h is (Patil &
Sherekar, 2019)
The Bayes Theorem formula is defined in
equation 10 (Patil & Sherekar, 2019).
𝑃
𝑄|𝑋
𝑃
𝑋|𝑄
.𝑃
𝑄
𝑃
𝑋
(10)
Where: 𝑋 Data with unknown class; 𝑄 The
hypothesis 𝑋 is a specific class; 𝑃
𝑄|𝑋
The
probability of the Q hypothesis refers to 𝑋; 𝑃
𝑄
Probability of the hypothesis 𝑄 (prior probability);
𝑃
𝑋|𝑄
Probability 𝑋 in the hypothesis 𝑄 ; 𝑃
𝑋
Probability 𝑋.
To explain the Naïve Bayes theorem, it must be
known that the classification process requires various
clues to determine the class according to the sample
analysed. Therefore, the Bayes theorem above is
adjusted as given in equation 11.
𝑃
𝑖,
𝑗
1 𝑖𝑓 𝐼
𝑥,𝑦
𝑖 𝑎𝑛𝑑
𝐼𝑥 ∆_𝑥,𝑦 ∆_𝑦
𝑗
0 𝑜𝑡ℎ𝑒𝑟𝑤𝑖𝑠𝑒
(1)
Take image
money with ultra
violet lighting
Pre-processing
Mean Red, Mean
Green, Mean Blue
Naïve Bayes
Rupiah
Validity
Exploration of an Indonesian Currency Legality Detection System by Utilizing Image Intensity of RGB Mean Values
13
𝑃
𝑄|𝑋
…𝑋
𝑃
𝑋
…𝑋
|𝑄
.𝑃
𝑄
𝑃
𝑋
…𝑋
(11)
Where: 𝑄 variable is a representation of class,
while variable 𝑋
…𝑋
represents the characteristics
of the instructions needed for the classification
process.
2.6 Mean Value
The mean value of each image intensity on the Red,
Green and Blue channels is calculated by using the
equation in 12 (Ni’am, 2013):
𝜇
𝑓
𝑝
𝑓
(12)
Where: 𝑓
is a grey intensity value, while 𝑝
𝑓
is the
histogram value (probability of the intensity
appearing in the image).
2.7 Success Rate
The success rate is measured using the f-measure in
equation 15.
𝑝𝑟𝑒𝑐𝑖𝑠𝑖𝑜𝑛
𝑇𝑃
𝑇𝑃 𝐹𝑃
𝑟𝑒𝑐𝑎𝑙𝑙
𝑇𝑃
𝑇𝑃 𝐹𝑁
𝑓𝑚𝑒𝑎𝑠𝑢𝑟𝑒2
𝑝𝑟𝑒𝑐𝑖𝑠𝑖𝑜𝑛 .𝑟𝑒𝑐𝑎𝑙𝑙
𝑝𝑟𝑒𝑐𝑖𝑠𝑖𝑜𝑛 𝑟𝑒𝑐𝑎𝑙𝑙
(13)
(14)
(15)
Where:
TP (True Positive) is a test to read the nominal
value of banknotes based on the system and manual
is correct. FP (False Positive) is a test to read the
nominal value of banknotes based on the system that
is not correct, but based on manually it is correct. FN
(False Negative) is a test to read the nominal value of
banknotes based on the system and manual is wrong.
3 RESULTS AND DISCUSSION
3.1 Classification of Indonesian
Currency (IDR) Nominal Value
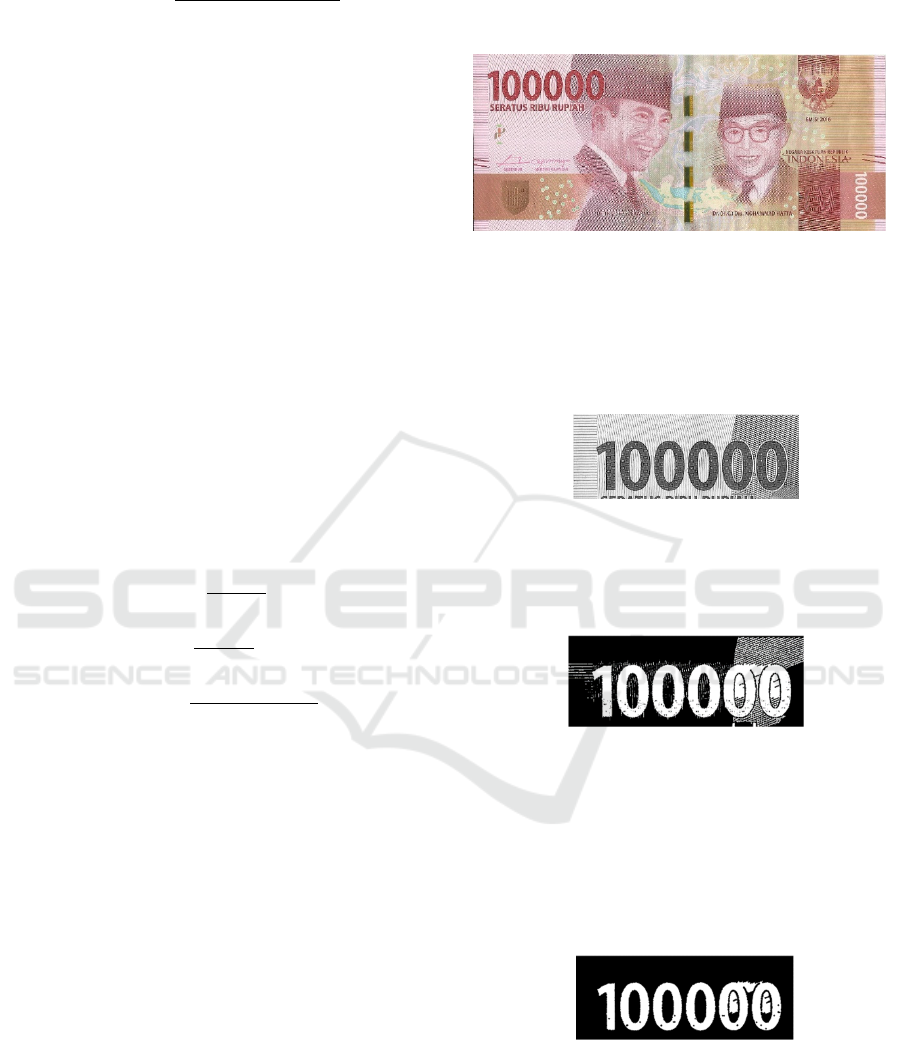
In the process of detecting the nominal value of the
Indonesian currency (IDR), it has been successfully
realized. At first, image of the money taken by the
camera or scanned by a scanner, then the results of
the photo or scan was entered in the program as
shown in Figure 7.
Figure 7: Photograph or scan image.
The image will be cropped on the left side, namely
on the part where there is a nominal, after that the
RGB image was changed to a grayscale image and the
intensity value is being adjusted. The results can be
seen in Figure 8.
Figure 8: Image of cropped money.
It was continued with segmentation of grayscale
images into foreground and background parts using
active contour as shown in Figure 9.
Figure 9: Image of the active contour.
Followed by filling in the blanks in the image
with the morphological structuring element
technique. Images other than the nominal value will
be removed using a dilation and erosion operation.
Neighbouring pixels located 2 pixels from the
element's centre point will be assigned a value equal
to the binary value of the element's centre point.
Figure 10: Binary image.
ICE-TES 2021 - International Conference on Emerging Issues in Technology, Engineering, and Science
14
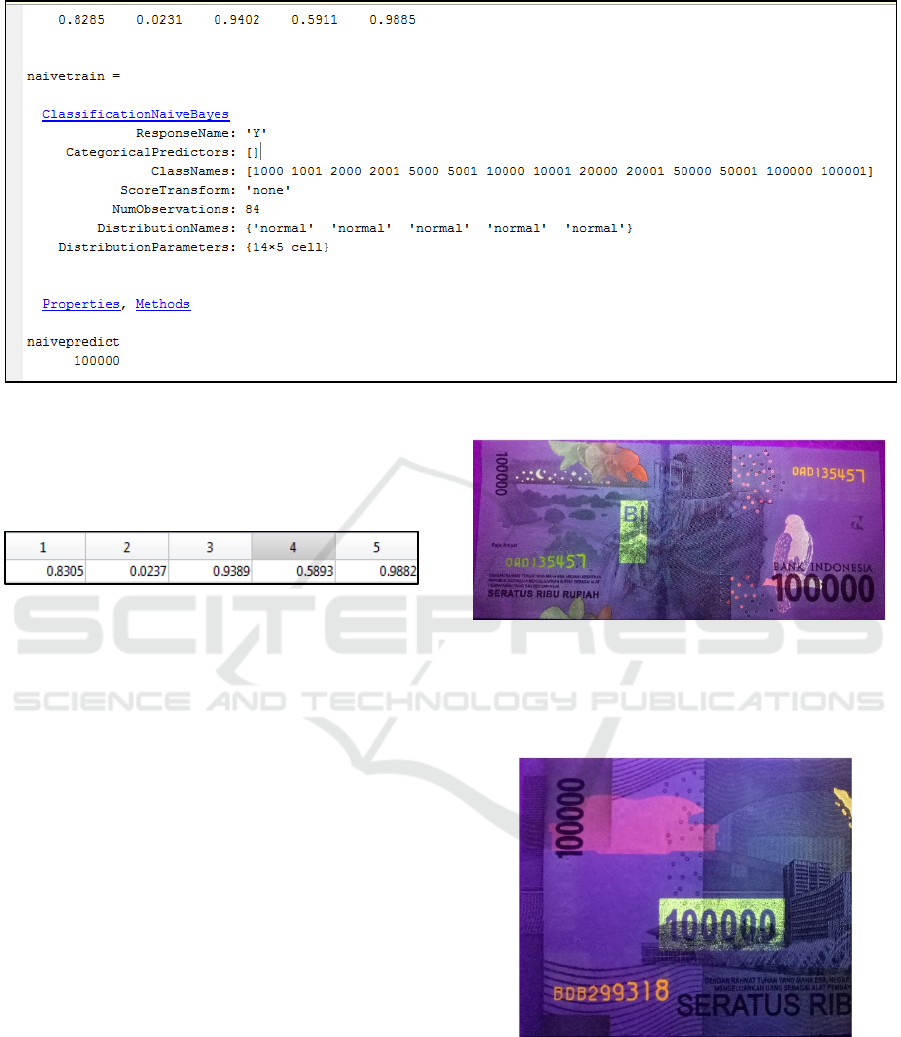
Figure 12: Output image of classification program.
The results of this binary image are used to
calculate entropy, contrast, correlation, energy, and
homogeneity. This value can be seen in Figure 11.
Figure 11: Entropy, contrast, correlation, energy, and
homogeneity value, respectively.
In the training process, 6 images are used for each
Indonesian currency (IDR) with the same nominal
value so that from 15 Indonesian banknotes there are
6 x 15 = 90 GLCM training data with supervised
learning. The data is stored in a nominal.txt and
class.txt file. In the testing process, the file is used as
reference data for classifying nominal values. The
classification here uses Naïve Bayes and the system
will display the results of the test image data
classification by displaying the nominal value of the
prediction results of Naïve Bayes as a nominal value
of 100 000 as in Figure 12.
In the test results with 30 test data, it is obtained
that TP = 24, FP = 6, FN = 0, so that from the f-
measure value, the percentage of system accuracy for
reading the nominal value of Indonesian banknotes is
88%.
3.2 Classification of Rupiah Validity
The process of detecting the validity of the rupiah
currency has been successfully realized. At first the
money was exposed to ultra violet light and
photographed, and then the photos or scans were
included in the program as shown in Figure 13.
Figure 13: Ultra violet image.
The ultra violet image result cropped at position
[0.5 0.5 1894 1730] in pixels and the results can be
seen in Figure 14.
Figure 14: Cropped ultra violet image.
The cropped UV image was separated by Red,
Green, and Blue channels, and then the mean
intensity of each channel is calculated. The data
stored in a file data_uv.txt and class_uv.txt. In the
testing process, the file used as reference data to
classify genuine or fake. The classification here uses
Naïve Bayes and the system will display the results of
Exploration of an Indonesian Currency Legality Detection System by Utilizing Image Intensity of RGB Mean Values
15
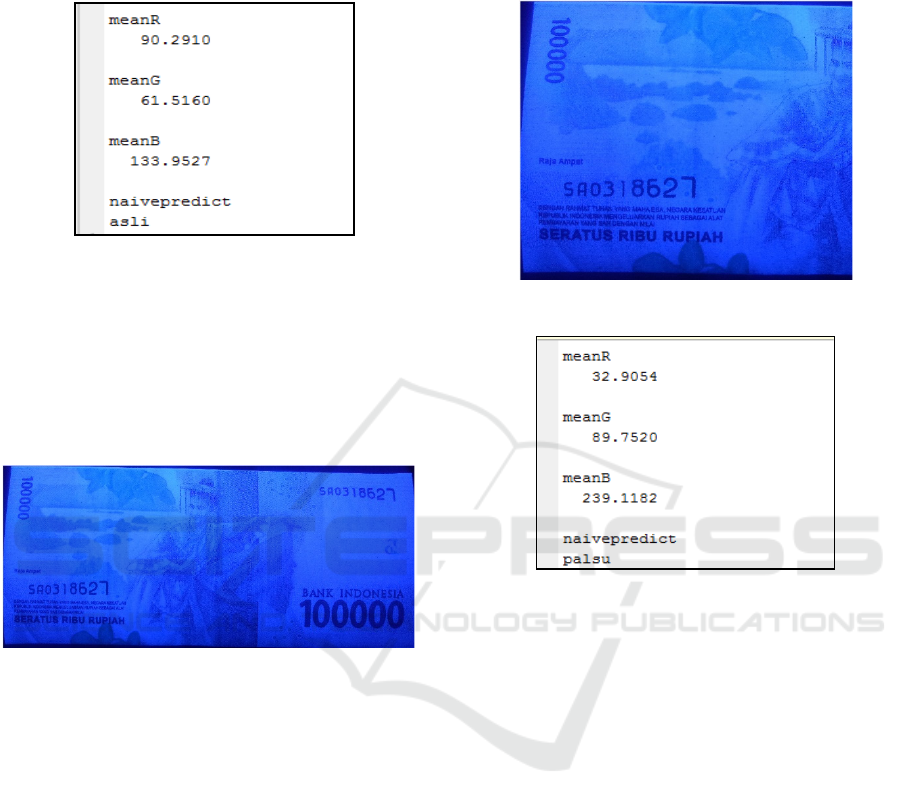
the classification of the test image data by displaying
the original or false information from the prediction
of Naïve Bayes as in Figure 15.
Figure 15: Program output for the validity of the Indonesian
currency (IDR).
The results of the ultra violet image for fake
Indonesian currency (IDR), which is different from
the ultra violet image of the original Indonesian
currency (IDR), can be seen in Figure 16 that the fake
banknote is dominated by blue when viewed with
ultra violet light.
Figure 16: UV image of ‘fake’ banknote
The cropped UV image at position [0.5 0.5 1894
1730] in pixels can be seen in Figure 17. The cropped
UV image is separated by Red, Green, and Blue
channels, and then the mean intensity of each
channel is calculated. The data is stored and
combined with the cropped UV image in a
data_uv.txt and class_uv.txt file. In the testing
process, the file is used as reference data to classify
genuine or fake. The classification here uses Naïve
Bayes and the system will display the results of the
classification of the test image data by displaying the
original or false information from the prediction of
Naïve Bayes as in Figure 18.
In the training process, 6 images are used for each
Indonesian currency (IDR) with the same nominal
value so that from 15 Indonesian banknotes there are
6 x 15 = 90 training data mean Red, mean Green, and
mean Blue with supervised learning. In the test results
with 30 test data, we get TP = 30, FP = 0, FN = 0, so
we get precision = 1, recall = 1, f-measure = 1. From
the f-measure value, the percentage of system
accuracy for reading the nominal Indonesian
banknotes is 100%.
Figure 17: Ultra violet crop image of a ‘fake’ banknote.
Figure 18: Mean red, mean green, mean blue prediction of
a ‘fake’ banknote.
4 CONCLUSIONS
The nominal value of Indonesian banknotes are Rp.
1000, Rp. 2000, Rp. 5000, Rp. 10000, Rp. 20000, Rp.
50000, Rp. 75000, and Rp. 100000 in the 2004-2021
edition has been successfully realized using the Grey-
Level Co-Occurrence Matrix (GLCM). Several
features of digital images, namely energy, contrast,
correlation, and homogeneity, are used as input for the
Naïve Bayes Classifier. From the experimental results
obtained 88% accuracy and the validity of the
Indonesian currency (IDR) can be detected using the
mean of red, mean of green, and mean of blue channel
values.
ACKNOWLEDGEMENTS
Thank you so much for the funding support that
makes this research possible to Universitas Kristen
Maranatha.
ICE-TES 2021 - International Conference on Emerging Issues in Technology, Engineering, and Science
16

REFERENCES
Alshayeji, M. H., Al-Rousan, M., & Hassoun, D. T. (2015).
Detection method for counterfeit currency based on bit-
plane slicing technique. International Journal of
Multimedia and Ubiquitous Engineering, 10(11), 225–
242. https://doi.org/10.14257/ijmue.2015.10.11.22
Azim, G. A. (2015). Identification of Textile Defects Based
on GLCM and Neural Networks. Journal of Computer
and Communications, 03(12), 1–8.
https://doi.org/10.4236/jcc.2015.312001
Eleyan, A., & Demirel, H. (2011). Co-occurrence matrix
and its statistical features as a new approach for face
recognition. Turkish Journal of Electrical Engineering
and Computer Sciences, 19(1), 97–107.
https://doi.org/10.3906/elk-0906-27
Indradewi, I. G. A. A. D., & Ariantini, M. S. (2019).
Jaringan Syaraf Tiruan LVQ Berbasis Parameter HSV
dalam Penentuan Uang Rupiah Palsu. Jurnal Ilmiah
Teknologi Informasi Asia, 13(1), 47-52.
Ni’am, B. A. A. A. (2013). Identifikasi nilai nominal dan
keaslian uang kertas rupiah menggunakan support
vector machine (Bachelor thesis, Universitas Islam
Negeri Maulana Malik Ibrahim).
Pambudi, A. R., Informatika, T., Komputer, F. I.,
Karawang, U. S., Segmentasi, M., Based, R., Contour,
A., Tepi, D., Metode, M., & Dengan, C. (2016). Deteksi
keaslian uang kertas berdasarkan watermark dengan
pengolahan citra digital. Jurnal Informatika
Polinema, 6(4), 69-74.
Patil, T. R., & Sherekar, S. S. (2019). Performance Analysis
of ANN and Naive Bayes Classification Algorithm for
Data Classification. International Journal of Intelligent
Systems and Applications in Engineering, 7(2), 88–91.
https://doi.org/10.18201/ijisae.2019252786
Prasanthi, B. S., & Setty, D. R. (2015). Indian Paper
Currency Authentication System-A Quick
Authentication System. 6(9), 1249–1256.
Rijal, Y. (2008). Identifikasi Keaslian Mata Uang Rupiah
Melalui Invisible Ink Berbasis Fourier Transform
Menggunakan Neural Learning Vector Quantization.
Retrieved from Repositori Universitas Dinamika:
https://repository.dinamika.ac.id/id/eprint/ 425/1/2008-
IV-396.pdf.
Giri, I. K. Y. B. (2019). Pendeteksian Mata Uang Rupiah
Palsu Menggunakan Image Processing. Retrieved from
Sekolah Teknik Elektro dan Informatika (STEI) ITB:
https://informatika.stei.itb.ac.id/~rinaldi.munir/Citra/2
019-2020/Makalah2019/13516115.pdf.
Exploration of an Indonesian Currency Legality Detection System by Utilizing Image Intensity of RGB Mean Values
17
