
Big Data-driven Smart Fish Farming
Sarah Benjelloun, Mohamed El Mehdi El Aissi, Yassine Loukili, Younes Lakhrissi
and Safae Elhaj Ben Ali
SIGER Laboratory, Sidi Mohamed Ben Abdellah University, Fez, Morocco
Keywords: Big Data, Smart Aquaculture, Smart Fish Farming, Data-driven.
Abstract: With the fast global population growth, the demand of fishery products is also increasing. Aquaculture is
developed in Asian countries the most, but not enough in countries with the same climate as Morocco. This
study explores the potential of Big Data technologies as fuel for a smart fish farm. By using big Data, the
activity of aquaculture is well managed with a better production level and less wastage. Many research studies
are exploring big Data for agriculture, but there is only a few exploring the potential of these technologies for
fish farming. Moreover, no study has been conducted for the Morocco case. This study is directed to reveal
the importance of investing in a big Data-Driven aquaculture. This paper presents the state of aquaculture in
Morocco to show the area of improvement. Then, it reveals the application of big Data technologies for smart
fish farming with a suggested architecture to solve current challenges. It also highlights Data generation
process, Data collection techniques and analytics methods.
1 INTRODUCTION
With the rapid development of robotics, the Internet
of Things (IoT), fifth-generation (5G), Big Data and
Artificial Intelligence, all fields of activity have gone
through a considerable progression (Bradley, 2019).
Agriculture is the most critical industry. With the
increasing global population, the demand for food is
also increasing (Sarker, 2019a). Human consumption
tends to prefer aliments with a much leaner and
lower-calorie source of protein. Naturally, fish is
preferred and widely consumed.
Aquaculture has a promising potential to help in
securing food safety worldwide. Aquaculture
production is growing more and more around the
world. In fifty years, fish production increased from
1 million tons in the 50s to 55 million tons in 2004 to
90 million tons in 2012 and finally reaching 106
million tons in 2015, according to The World Bank
(The World Bank, 2016). China is the largest
aquaculture producer with other Asian countries like
Indonesia, India, Vietnam, the Philippines,
Bangladesh, South Korea, Thailand and Japan.
Unfortunately, Morocco doesn’t score significant
points in this domain. In general, aquaculture in
Africa remains limited despite the existence of
immense potential.
Big Data has a big potential to assess actions to
increase the productivity in agriculture in general and
aquaculture specifically. Indeed, with the power of
Data management, Data analytics and its
applications, all industries have improved
significantly. According to (Liu, Shanhong, 2020),
Big Data and business analytics revenue worldwide
in 2019 reached 189.1 billion U.S. dollars, and is
forecasted to reach 274.3 billion U.S. dollars in 2022.
These numbers encourage the use of Big Data in order
to obtain its benefits. Fostering smart Data-based
solutions in aquaculture enables innovative
management and making intelligent decisions.
Indeed, Big Data applications support
industries/companies to help make decisions via
managing then analysing huge volumes of Data.
Different organizations from different domains invest
in Big Data technologies for discovering hidden
patterns, market trends, customer preferences and
unknown correlations.
Big Data related technologies did gain one's spurs
in agriculture first (Sarker, 2019b), then in a few
aquaculture commercialized solutions. But no studies
regarding aquaculture have been conducted in
Morocco for this purpose.
In this optic, the current research suggests an
architectural and technical solution based on Big
Data’s technologies. By exploiting the already
512
Benjelloun, S., El Aissi, M., Loukili, Y., Lakhrissi, Y. and Elhaj Ben Ali, S.
Big Data-driven Smart Fish Farming.
DOI: 10.5220/0010738800003101
In Proceedings of the 2nd International Conference on Big Data, Modelling and Machine Learning (BML 2021), pages 512-517
ISBN: 978-989-758-559-3
Copyright
c
2022 by SCITEPRESS – Science and Technology Publications, Lda. All rights reserved
existing Data, the purpose of this work is to provide a
system in which fish production is not only managed
but also optimized. The objective is to acquire Data,
process it and store it before utilizing it for reports,
dashboards and predictive purposes.
The objective of this paper is to highlight the
current state of art of Moroccan aquaculture to
establish the area of improvement. After that, we
show the different use cases of Big Data in this field
by considering research papers addressing Data-
driven studies. Finally, we present the functional
architecture proposal.
This work is organized into four major sections.
The first section summarizes the state of aquaculture
in Morocco. The following section contains the
methodology that we followed in order to accomplish
the research. In the third section, we emphasize use
cases of Big Data related to fish farming. The
prominent three use cases are management,
optimization and prediction. The fourth chapter is a
suggestion of a Big Data architecture applied to fish
farming Data. We discuss the functional architecture
proposed and explain every component.
2 AQUACULTURE IN MOROCCO
In Morocco, aquaculture remains growing at a very
slow pace compared to several regions in the world.
The most significant production of aquaculture
products is in Asia and especially China. Moroccan
continental aquaculture production levels are not very
well recorded, but according to FAO, the production
level has increased from 2 500 tons in 2005 to around
15 000 tons in 2015. Most of the production of
continental aquaculture comes from carp production
in reservoirs (dams), lakes and rivers. According to
(Holth, 2018), in 2018, fish production levels in
pools, lakes and rivers were estimated at 13 000
tons/year. In fact, this fish is caught by fishermen and,
more correctly, could be marked “aquaculture-based
fishery” instead of aquaculture. The remaining
production of continental aquaculture is constituted
by:
- Eel (production level estimated in 2018, 350
tons/year),
- Tilapia (around 200 tons/year),
- Trout (100 tons/year),
- An unknown production by reservoir fishery of
carp and other species.
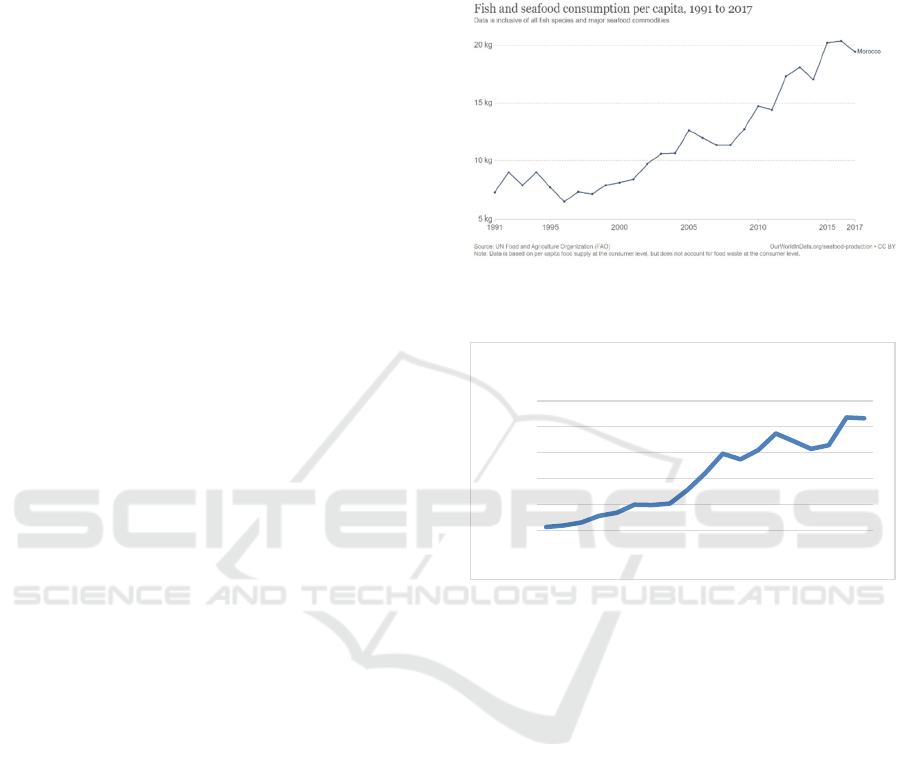
As figure 1 shows, consumption per capita is
increasing. Given the modest production, no one can
deny that Moroccan aquaculture sector is still in its
embryonic phase. Furthermore, the Morocco fish
imports’ values reach 216 032 million American
dollars, according to International Trade Centre (ITC)
in Trade Map (Trademap, 2020), as presented in
figure 2.
Figure 1: Fish and seafood consumption per capita 1991-
2017 (Our World in Data, 2018).
Figure 1: Moroccan Imports’ value 2001-2019 (Trade Map,
2020).
When comparing fish production and fish
consumption amounts, we notice that there is a huge
gap that is not improving with time, and that
translates into the need of importing fish products. In
consequence, there is a real need for moving
traditional fish farming systems into smart fish
farming systems to handle the increasing demand.
The goal of this study is to put light on Big Data
Analysis and how it can be a game-changer in terms
of fish production quality and management through a
smart fish farming ecosystem.
3 METHODOLOGY
In order to conduct the study, a systematic literature
method is used to explore the existing techniques. All
literature available between 2015 and 2021 has been
assessed. Other than the period criteria, we used two
inclusion criteria: Full article publication and
0
50000
100000
150000
200000
250000
2001
2002
2003
2004
2005
2006
2007
2008
2009
2010
2011
2012
2013
2014
2015
2016
2017
2018
2019
Imports' value in millions (American dollar)
Big Data-driven Smart Fish Farming
513

relevance to the research. Also, two exclusion criteria
were used: Language publication in English and work
focusing on technical design. To collect articles from
renewed research databases such as web of science,
Springer and IEEE Xplore, we used the following
query: “Big Data” AND “Morocco” AND
[“Aquaculture” OR “Fish Farming”].
Unfortunately, no paper on Smart fish farming
using Big Data applicated to Morocco were found.
Instead, we found most articles of Asia and precisely
China. To overcome this problem of lack of
references, we based our research on articles from
countries having the same climate as Spain. Besides
Spain, no relevant research from Algeria or Tunisia
were found.
After collecting the research papers, our
methodology consisted of following the process: All
relevant big Data-based aquaculture articles were
gathered; Since Asia is the leader in aquaculture
production, we chose relevant work from China in
order to study different methods used in this country.
We narrowed our study by focusing on the
consideration of the application of some practices in
Spain.
4 BIG DATA IN FISH FARMING
USE CASES
Big Data is a lever in the industrial revolution 4.0 and
is a big game-changer for most industries already
over the last few years. Organizations use Big Data
applications in Healthcare, Manufacturing,
Entertainment, cybersecurity and intelligence, crime
prediction and prevention, scientific research, traffic
optimization, weather forecasting and more. Indeed,
Big Data provides valuable insights and, for
companies, undeniable profitability (Wolfert, 2017).
These technologies can be used in fish farming to
predict patterns and increase production and income,
and also fish quality (Sarker, 2020). Some researchers
are also interested in Big Data for its potential in
helping aquaculture become sustainable (Lioutas,
2020).
In fish farms, Data is generated and collected
continually (Roukh, 2020). The Data value chain of
aquaculture then begins with Data acquisition from
sources, whether it is streaming or batch-based
(Amora, 2020). Pre-processing is for cleaning the
Data gathered for validation purposes. This Data is
then stored in a distributed storage system to perform
Data Analysis (Wolfert, 2017). There are four types
of Data Analysis:
‐ Descriptive Analysis: Track Key Performance
Indicators (KPIs) using dashboards;
‐ Diagnostic Analysis: Detect patterns of
behaviour using insights drill down from
descriptive analysis;
‐ Predictive Analysis: Predict what is likely to
happen based on statistical modelling;
‐ Prescriptive Analysis: Determine actions to take
using insights from all previous analyses.
Alongside, Data Visualization comprises the
graphical representation of Data. It also can be useful
to monitor production and activity state through Data
generated by IoT equipment.
The objective of including Big Data technologies
to fish farms is to enhance productivity per cost quota
and to have better environment print by improving
fish survival and water quality for better sustainability
(Roukh, 2020; Bajpai, 2019). The traits considered
with high economic importance in fish farming are
mainly growth, survival and feed conversion ratio
(FCR) (Mengistu, 2020). Many papers are addressing
these topics to understand the variables affecting
these three traits.
China being the worldwide leader in the
aquaculture segment, many research papers approach
aquaculture using big Data. The relevant applications
can be divided into six categories (Yang, 2021): live
fish identification, species classification, behavioural
analysis, feeding decisions, size or biomass
estimation, and water quality prediction. It is
esteemed that maintaining an ecological environment
with good water quality is the most critical link to
ensure production efficiency with the quality other
than focusing on economic aspects (Hu, 2020).
Therefore, many pieces of researche have been
conducted in the optic of water quality management
using big Data applications (Hu, 2020; Wen, 2020;
Peng, 2020; Song, 2019; Yang, 2021). Whereas,
Spain research articles focus on water quality
management and feeding strategies for improving the
economic efficiency of the operational process (Parra,
2018; Luna, 2019; O’Donncha, 2019).
5 FISH FARMING BIG DATA
ARCHITECTURE
The functional architecture has evolved from a mono-
zone to a multi-zone, depending on the technical
need.
BML 2021 - INTERNATIONAL CONFERENCE ON BIG DATA, MODELLING AND MACHINE LEARNING (BML’21)
514
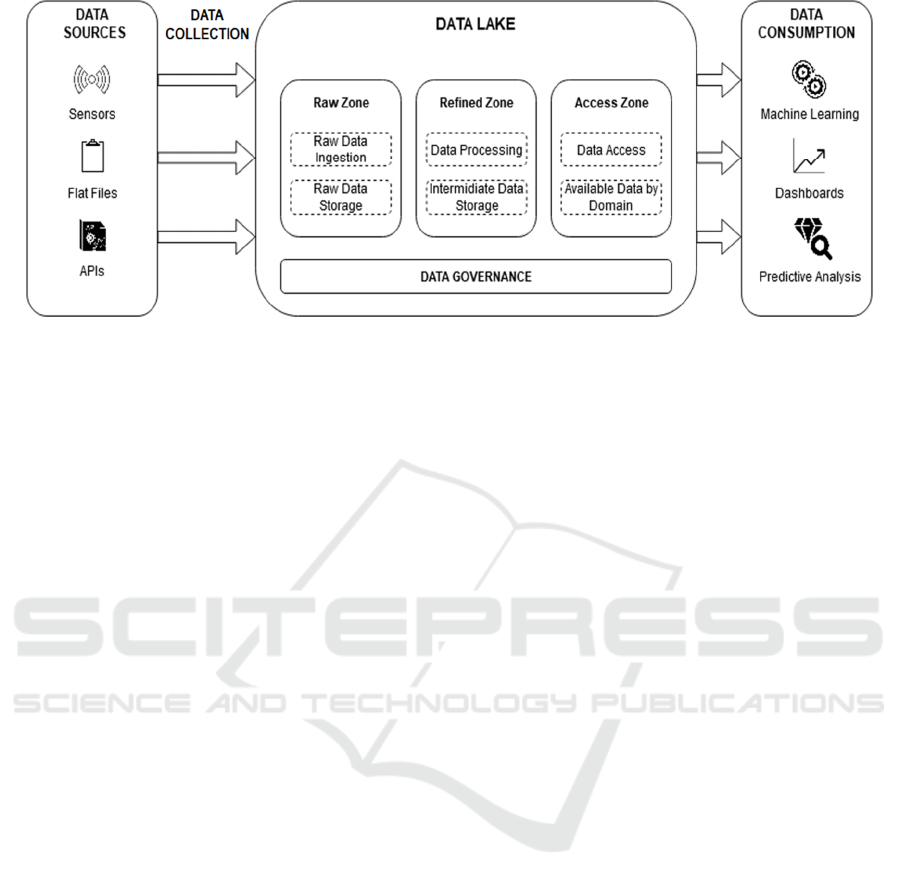
Figure 3: Functional architecture proposal for Data-Driven fish farming system.
From our perspective, the Data Lake should allow
us to store all the Data coming from the sources, and
it may be structured, semi-structured or even
unstructured. As a result, mono-zone Data Lake was
efficient to store the Data in its native format.
However, in most cases, we may perform some
transformations on the stored Data at the Data Lake
level. Under these circumstances, we started using the
multi-zone Data Lakes by creating more than one
Data storage level. This approach will allow us to
manage Data more efficiently.
For this main reason, our proposed Data Lake
architecture for fish farming context contains three
Data storage layers, as shown in figure 3.
5.1 Data Sources
Fish farming systems can have many Data sources,
and each Data source has its own Data structure. The
primary Data source for our system is the sensors that
collect real-time Data (Pressure, Temperature, PH,
Humidity, Dissolved Oxygen, salinity...).
The second Data source is the manual Data stored
in flat files (CSV, TXT) by the business people. It
contains marketing and measures Data that cannot be
automated by sensors.
One more Data source are APIs; they provide
Data about weather, average global fish price and
information about the fish farming market.
5.2 Data Lake
The adopted Data Lake architecture have three Data
storage level. The first Data storage level is the Raw
Zone; it contains Data as-is from the source without
any transformations. The Data ingestion may be on
real-time or batch. This Data Lake Zone allows
finding the original Data version by the Data
engineers. It has to be noted that the stored raw Data
format can be slightly different from the original
format.
The second Data storage level is the Refined zone.
In this zone, we can transform Data according to the
needs and store the intermediate Data. In the Refined
zone, Data can be processed either in batch or stream.
Users can perform selections, joins, aggregations
depending on the use case.
The third Data storage level is the Access zone,
which offers access to the stored Data for Data
analytics purposes. This zone provides self-service
Data consumption for machine learning algorithms,
Reporting, Business Intelligence, statistical analysis,
etc.
Lastly, all the previous Data Lake zones are covered
by Data Governance zone to ensure Data quality,
metadata management and Data access.
5.3 Data Consumption
The Data can be consumed in many types as Data
Visualization through dashboards presenting KPIs for
each uses case. We can perform some predictive
analysis through Machine learning or even some
statistical analysis.
6 CONCLUSION AND FUTURE
WORK
Nowadays, Big Data techniques are almost applied in
all fields as insurance, banking, industry, marketing
and medicine. And it has been proved effective as it
helped enhance traditional operational processes and
increase profit. However, Big Data is not widely
applied in agriculture in general and in aquaculture
Big Data-driven Smart Fish Farming
515

especially. This study focuses on fish farming
production in Morocco. It shows the vast gap between
fish production amount and significant market need,
which generate an essential quantity of fish
importation.
To handle this increasing demand, applying Big
Data becomes a necessity for migrating from
traditional fish farming systems to Data-driven
systems, allowing fish farmers and stakeholders
effective Data exploitation for enhanced fish
production and quality.
We propose a functional architecture of the
dedicated fish farming system that relies on three
levels, mainly Data sources, Data lake, Data
consumption. The Data source level comprises the
streaming Data generated by sensors, flat files
containing additional operational Data and Data from
APIs. The Data lake layer involves raw zone, refined
zone and access zone, and Data governance for
availability, usability, integrity and security of Data.
Lastly, the Data consumption layer is for Data
analysis and visualization.
Now that we have expended the functional
architecture of the Data-driven fish farming system,
our future works are focused on proposing a technical
architecture as a proof of concept as well as applying
Big Data analysis to predict results based on the
explanatory variables to be able to take actions
accordingly.
REFERENCES
Amora, E. N. O., Romero, K. V., & Amoguis, R. C. (2020,
August). AQUATECH: A Smart Fish Farming
Automation and Monitoring APP. In Proceeding of the
International Virtual Conference on Multidisciplinary
Research (IVCMR) (Vol. 27, p. 28).
Bajpai, R., Singh, R., Gehlot, A., Singh, P., & Patel, P.
(2019, March). Water Management, Reminding
Individual and Analysis of Water Quality Using IoT
and Big Data Analysis. In International Conference on
Advances in Engineering Science Management &
Technology (ICAESMT)-2019, Uttaranchal
University, Dehradun, India.
Bradley, D., Merrifield, M., Miller, K. M., Lomonico, S.,
Wilson, J. R., & Gleason, M. G. (2019). Opportunities
to improve fisheries management through innovative
technology and advanced Data systems. Fish and
fisheries, 20(3), 564-583.
Holth, M., & Van der Meer, A. (2018). Aquaculture
business opportunities in Morocco for Dutch
entrepreneurs.
https://www.rvo.nl/sites/default/files/2018/06/Aquacul
ture-Business-Opportunities-Morocco.pdf. Accessed
on February 27.
Hu, Z., Li, R., Xia, X., Yu, C., Fan, X., & Zhao, Y. (2020).
A method overview in smart aquaculture.
Environmental Monitoring and Assessment, 192(8), 1-
25.
Lioutas, E. D., & Charatsari, C. (2020). Big Data in
agriculture: Does the new oil lead to sustainability?.
Geoforum, 109, 1-3.
Liu, S. (2020, October 7). Big Data - Statistics & Facts.
Statista. https://www.statista.com/topics/1464/big-
Data/. Accessed on Mars 20.
Luna, M., Llorente, I., & Cobo, A. (2019). Determination
of feeding strategies in aquaculture farms using a
multiple-criteria approach and genetic algorithms.
Annals of Operations Research, 1-26.
Mengistu, S. B., Mulder, H. A., Benzie, J. A., & Komen, H.
(2020). A systematic literature review of the major
factors causing yield gap by affecting growth, feed
conversion ratio and survival in Nile tilapia
(Oreochromis niloticus). Reviews in Aquaculture,
12(2), 524-541.
O’Donncha, F., & Purcell, M. Methodologies for big Data
mining in aquaculture.
Our World in Data. (2018). Fish and seafood consumption
per capita, 1991 to 2017.
https://ourworldinData.org/grapher/fish-and-seafood-
consumption-per-
capita?tab=chart&time=1991..latest&country=~MAR.
Accessed on February 27.
Parra, L., Sendra, S., García, L., & Lloret, J. (2018). Design
and deployment of low-cost sensors for monitoring the
water quality and fish behavior in aquaculture tanks
during the feeding process. Sensors, 18(3), 750.
Peng, Z., Chen, Y., Zhang, Z., Qiu, Q., & Han, X. (2020,
April). Implementation of water quality management
platform for aquaculture based on big Data. In 2020
International Conference on Computer Information and
Big Data Applications (CIBDA) (pp. 70-74). IEEE.
Roukh, Amine, et al. "Big Data Processing Architecture for
Smart Farming." Procedia Computer Science 177
(2020): 78-85.
Sarker, M. N. I., Islam, M. S., Ali, M. A., Islam, M. S.,
Salam, M. A., & Mahmud, S. H. (2019b). Promoting
digital agriculture through big Data for sustainable farm
management. International Journal of Innovation and
Applied Studies, 25(4), 1235-1240.
Sarker, M. N. I., Islam, M. S., Murmu, H., & Rozario, E.
(2020). Role of big Data on digital farming. Int J Sci
Technol Res, 9(4), 1222-1225.
Sarker, M. N. I., Wu, M., Chanthamith, B., Yusufzada, S.,
Li, D., & Zhang, J. (2019a). Big Data-Driven Smart
Agriculture: Pathway for Sustainable Development. In
2019 2nd International Conference on Artificial
Intelligence and Big Data (ICAIBD) (pp. 60-65). IEEE.
Song, Y., & Zhu, K. (2019, November). Fishery Internet of
Things and Big Data Industry in China. In 2019
International Conference on Machine Learning, Big
Data and Business Intelligence (MLBDBI) (pp. 181-
185). IEEE.
The World Bank. (2016). Aquaculture Production (Metric
Tons) | Data.
BML 2021 - INTERNATIONAL CONFERENCE ON BIG DATA, MODELLING AND MACHINE LEARNING (BML’21)
516

www.Data.worldbank.org/indicator/ER.FSH.AQUA.
MT?start=2012. Accessed 26 Mar. 2021.
Trade Map. (2020). Fishery products imported by Morocco.
www.trademap.org/Product_SelCountry_TS.aspx.
Accessed on Mars 14.
Wen, Y., Li, M., & Ye, Y. (2020, April). MapReduce-
Based BP Neural Network Classification of
Aquaculture Water Quality. In 2020 International
Conference on Computer Information and Big Data
Applications (CIBDA) (pp. 132-135). IEEE.
Wolfert, S., Ge, L., Verdouw, C., & Bogaardt, M. J. (2017).
Big Data in smart farming–a review. Agricultural
systems, 153, 69-80.
Yang, X., Zhang, S., Liu, J., Gao, Q., Dong, S., & Zhou, C.
(2021). Deep learning for smart fish farming:
applications, opportunities and challenges. Reviews in
Aquaculture, 13(1), 66-90.
Big Data-driven Smart Fish Farming
517
