
Forecasting Stock Returns with Fuzzy HEAVY-r Model
using Genetic Algorithm
Youssra Bakkali, Mhamed El Merzguioui
and Abdelhadi Akharif
Laboratory of Mathematics and Applications, Abdelmalek Essaadi University,
Faculty of Science and Technology of Tangier, Morocco
Keywords: HEAVY-r, GA, fuzzy system, clustering.
Abstract: Financial returns expose complex dynamics that are difficult to capture with classical econometric models,
the most common feature in financial series is volatility clustering. We propose the Fuzzy HEAVY-r model
for modelling and predicting returns of the CAC40 stock market index. This model has been developed by a
combination of the fuzzy inference system and the HEAVY-r model. A Genetic Algorithm (GA) based
parameters estimation algorithm is suggested to obtain the optimal solution for the fuzzy membership function
and the HEAVY-r model. We apply these models to the high-frequency financial data regularly spaced in
time (every minute) and (every five minutes), and we compared it with the Fuzzy GARCH model and the
classical models. The results indicate that the Fuzzy HEAVY-r model outperforms other models in out of
sample evaluation according to RMSE.
1 INTRODUCTION
In econometrics, volatility has been one of the most
active research subjects. The autoregressive
Conditional Heteroscedasticity Models (ARCH)
introduced by Engle (1982) and their extensions
GARCH (generalized ARCH) introduced by
(Bollerslev, 1986) are essentially based on the
concept of conditional variance and play an effective
role in modelling the dynamic features of volatility.
The GARCH family models are ineffective in cases
where volatility changes rapidly to a new level.
With the arrival of high-frequency data in the
world of finance, a large number of studies have been
recently published. Research on realized measures of
volatility is becoming popular in studies, including
realized variance introduced by Andersen et al.
(2001a) and Barndorff-Nielsen (2002), the realized
kernel introduced by Barndorff‐Nielsen et al. (2008),
and many related quantities. These measures are more
precise and effective than the squared return in
determining the current level of volatility.
The HEAVY model (SHEPHARD &
SHEPPARD, 2010) blends the intellectual lessons of
the GARCH model with modern higher frequency
data literature and shows that the HEAVY models are
more resilient than traditional GARCH models to
level breaks in the volatility that adjust much faster to
the new level.
Given that financial series present complex and
nonlinear behaviours that make modelling difficult,
various artificial intelligence techniques have been
tested for prediction problems and have shown better
performance.
Artificial Neural networks (ANNs) have been
used successfully, but the weak point is that the
(ANNs) are black boxes, and it is not possible to
explain the links between inputs and outputs.
In order to compensate for this weakness of
(ANNs), studies insist on the interest of systems
combining the aspect connectionist of (ANNs) to
reasoning techniques. In this objective, neuro-fuzzy
systems are particularly indicated.
Current research on prediction problems of
nonlinear time series shows that the neuro-fuzzy
performs better than ANNs (Wang, Golnaraghi, &
Ismail, 2004).
Hung (2009b) proposed a hybrid Fuzzy-GARCH
model. The model was combining a functional fuzzy
inference system to analyze clustering with a
GARCH model using genetic algorithms to estimate
the parameters.
We propose the Fuzzy HEAVY-r model that
combines the heavy model in order to capture
conditional volatility and the fuzzy approach offers
316
Bakkali, Y., EL Merzguioui, M. and Akharif, A.
Forecasting Stock Returns with Fuzzy HEAVY-r Model using Genetic Algorithm.
DOI: 10.5220/0010733300003101
In Proceedings of the 2nd International Conference on Big Data, Modelling and Machine Learning (BML 2021), pages 316-320
ISBN: 978-989-758-559-3
Copyright
c
2022 by SCITEPRESS – Science and Technology Publications, Lda. All rights reserved

the ability to simulate stock movements with
volatility clustering.
For the Fuzzy HEAVY-r model estimation problem,
the GA method (Holland, 1984) aims to achieve an
optimal solution.
Our study will be based on daily financial
returns 𝑟
and a sequence of daily realised variance
(𝑅𝑉
𝑡1,2…𝑁.
The rest of this paper is organised into six
sections. The HEAVY models are presented in
section 2. The Fuzzy HEAVY-r is presented in
section 3. In section 4, the Genetic algorithm. In
section 5, We have highlighted the properties
observed empirically in high-frequency financial
data, and we apply the Fuzzy HEAVY-r model to the
real data. Concluding remarks are given in section 6.
2 HEAVY MODELS
The structure of the HEAVY models (SHEPHARD &
SHEPPARD, 2010) is given by:
Var(r
/F
h
α
α h
β RM
, (1)
α0,β∈
0,1
.
E(RM
/F
μ
γα
μ
β
RM
, (2)
α
β
∈
0,1
Where r
denote the daily return, F
is the
information set generated by high-frequency past
data, and RM
t
, that is, the high-frequency volatility
estimators. Note that (1) is called the HEAVY‐r
model and (2) the HEAVY‐RM model.
The volatility estimator that we adopt in our
model is the realized volatility (Barndorff-Nielsen &
Shephard, 2002) , as a realised measure:
𝑅𝑉
∆
log
𝑃
∆
log𝑃
∆
,
The intra-day time subscripted as i = 0, 1, 2, ..., N and
∆ is the frequency. Note that 𝑃
∆
is the closing
price at the i-th interval of day t.
3 THE FUZZY HEAVY-R MODEL
Neuro-fuzzy systems are suitable tools for solving the
prediction problems of nonlinear time series. Since
the most common feature in financial series is
volatility clustering, we combine the HEAVY-r
model and fuzzy systems to capture the accumulation
of volatility.
Fuzzy set theory is similar to human reasoning.
The capacity of fuzzy logic to imitate human
reasoning is one of the reasons why fuzzy systems are
being considered in this study.
The fuzzy inference system is a computational
framework that is used to examine and evaluates the
output of fuzzy systems in three steps: the
fuzzification (i.e. partitioning of the input data to the
antecedent of the fuzzy rules), then IF-THEN rules,
and finally the defuzzification.
The use of language rules IF-THEN reflects
knowledge about a system's dynamics, which makes
creating prediction systems with fuzzy inference
systems interesting.
Fuzzy sets are defined through a membership
function (denoted by 𝜑) which converts data into
scale inputs ranging from 0 to 1.
𝑅𝑢𝑙𝑒
: IF 𝑟
is 𝜑
THEN:
r
h
ε
,
h
α
α
h
β
RM
Such that: 𝑟
the previous value of the stock
returns, 𝜑
is the fuzzy set for rule l (l = 1,2…L), with
L the number of rules IF_THEN.
The function that we adopt in our model is the
Gaussian membership function:
φ
r
exp
,
With c is the center of the Gaussian function and σ is
a positive constant determines the zone of influence
of the cluster in question.
The output y of the inference system is determined
by taking a weighted average of the outputs of the
different rules.
𝑟
ℎ
ε
t
,
h
∑
φ
r
α
∑
α
h
∑
β
RM
∑
φ
r
4 GENETIC ALGORITHM
Genetic algorithms are a family of techniques draws
on the Darwinian theory of evolution to solve
optimization problems (Holland, 1984) based on
three basic genetic operators: reproduction, crossover
and mutation.
Genetic algorithms belong to the family of
evolutionary algorithms. They are used to optimize
complex problems in order to find an optimal
Forecasting Stock Returns with Fuzzy HEAVY-r Model using Genetic Algorithm
317
solution. It is an effective approach for nonlinear
functions (Zhou, Khotanzad, & Alireza, 2007).
5 EMPIRICAL STUDY
This paper focus on daily financial returns (𝑟
) of
CAC40 obtained by taking the logarithmic difference
of the daily price and multiplying it by 100, the
resulting stock return: r(t) = (log P(t) –log P(t-1))
*100, where P(t) is the closing price for day t
over the period from 01/11/2017 through 09/10/2020
and a sequence of daily realised variance 𝑅𝑉 obtained
by the sum of the N intra-day squared returns at
frequency 1 min for the first series and 5 min for the
second series. Where the intra-day time subscripted
as i = 0, 1, 2…N.
The first series is uniformly sampled at 1-minute
scales. This series includes exactly 388,074
observations of 01/11/2017 09: 00 until 09/10/2020
18: 00 or 520 points per day.
The second series is uniformly sampled at 5-
minute scales. This series includes exactly 77,657
observations of 01/11/2017 09: 00 until 09/10/2020
18: 00 or 105 points per day.
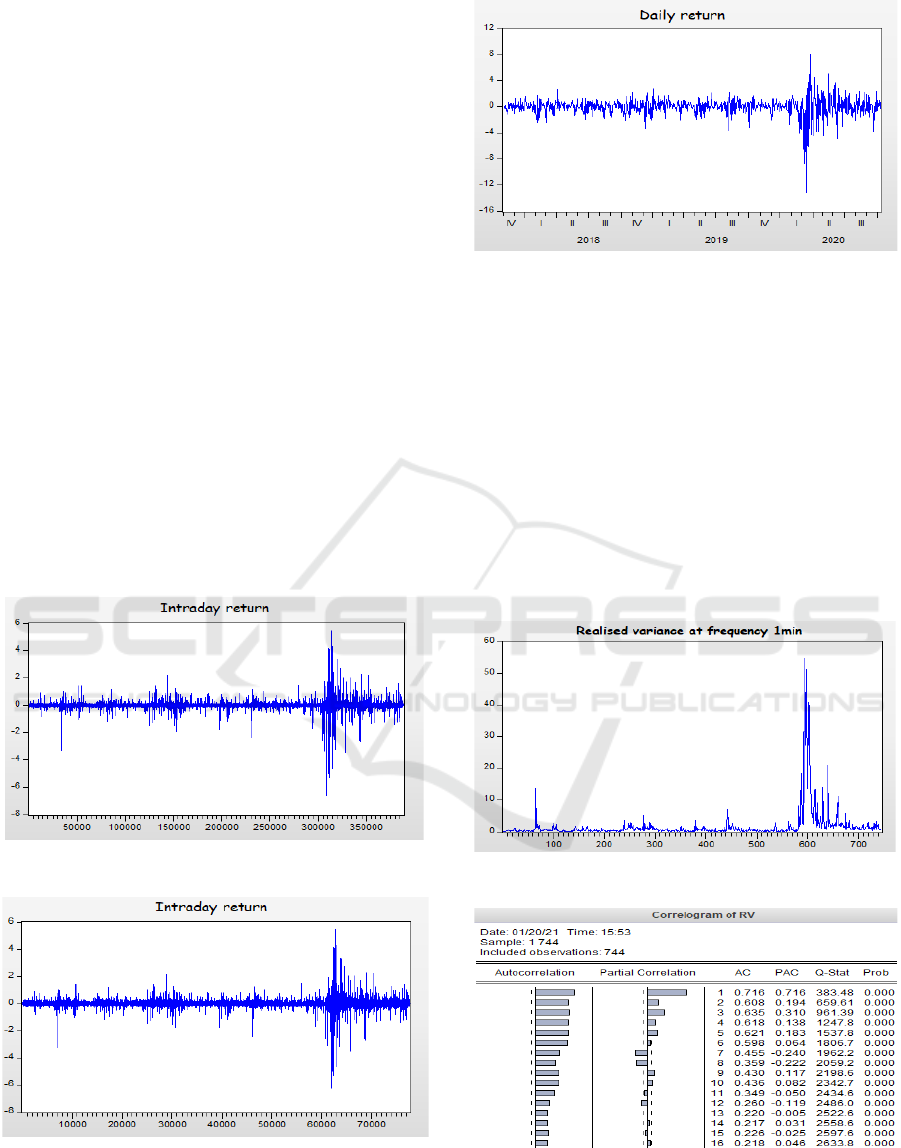
Figure 1: The intraday return at frequency 1 min
Figure 2: The intraday return at frequency 5 min
Figure 3: The daily return
The graphics (figures 1, 2, 3) represent the Time
series plots of the intraday returns and daily returns.
We can notice that the returns appear to be stationary
around a constant. The evolution of returns indicates
that the series is highly volatile.
Figures 4 and 6 below, presented the realized
variance 𝑅𝑉 of high-frequency logarithmic returns.
We observe the clustering of volatilities of the
realized variance obtained by the sum of the N intra-
day squared returns.
The correlograms (figures 5, 7) show the presence
of a significant correlation between the 𝑅𝑉
and
𝑅𝑉
.
Figure 4: Realized volatility (RV) at frequency 1 min.
Figure 5: correlogram of RV at frequency 1min.
BML 2021 - INTERNATIONAL CONFERENCE ON BIG DATA, MODELLING AND MACHINE LEARNING (BML’21)
318
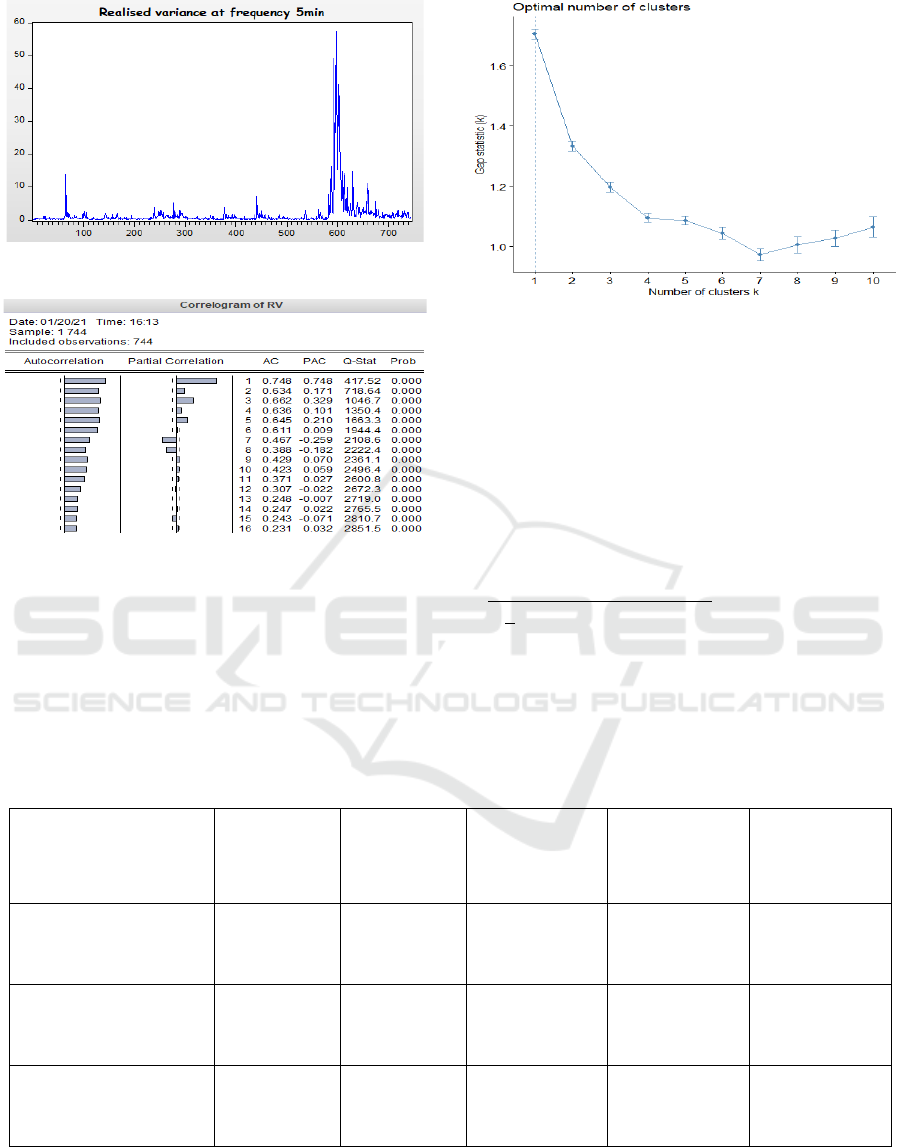
Figure 6: Realized volatility (RV) at frequency 5 min
Figure 7: correlogram of RV at frequency 5 min
The data sample was subdivided into two sets, the
first set contains 700 observations for the training
model, and the second set contains 44 observations
for the testing model.
Using the K-means algorithm, the number of rules
was specified using the "gap" method for estimating
the optimal number of clusters.
Figure 8: Gap curve
Our system has three inference rules, and the
membership function chosen is the Gaussian
function.
𝑅𝑢𝑙𝑒
: IF 𝑟
is 𝜑
THEN
ℎ
𝛼
𝛼
ℎ
𝛽
𝑅𝑉
, l = 1, 2, 3.
The parameters are significant at a 0.05 significance
level.
In order to evaluate the performance of models in
forecasting returns, a loss function is considered:
Root mean square error (RMSE): 𝑅𝑀𝑆𝐸
∑
𝑟
𝑟
Table1: Parameters estimation of Fuzzy HEAVY-r using GA.
Parameters
𝑐
𝑐
𝑐
𝜎
𝜎
𝜎
𝛼
𝛼
𝛼
𝛼
𝛼
𝛼
𝛽
𝛽
𝛽
Fuzzy HEAVY-r
(RV at frequency
1min)
0.014
0.012
0.007
0.032
0.002
0.013
0.005
0.003
0.04
0.058
0.02
0.024
0.043
0.058
0.025
Fuzzy HEAVY-r
(RV at frequency
5 min)
0.024
0.030
0.046
0.004
0.02
0.05
0.04
0.05
0.008
0.019
0.018
0.057
0.022
0.035
0.051
Fuzzy GARCH(1,1)
0.027
0.001
0.038
0.015
0.023
0.043
0.043
0.015
0.017
0.041
0.047
0.044
0.021
0.016
0.051
Forecasting Stock Returns with Fuzzy HEAVY-r Model using Genetic Algorithm
319
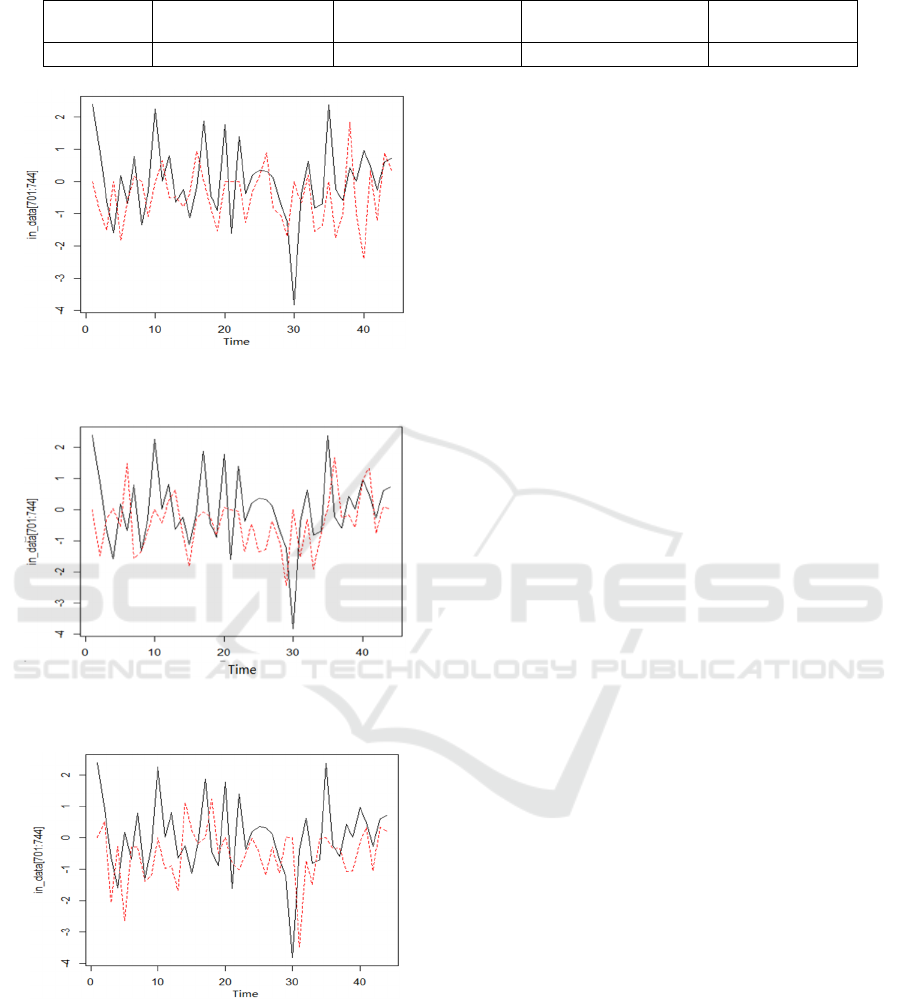
Table2: The results of forecasting returns in out‐of‐sample evaluation.
Loss
function
Fuzzy HEAVY-r
(at frequency 1min)
Fuzzy HEAVY-r
(at frequency 5min)
Fuzzy GARCH(1,1) GARCH(1,1)
RMSE 1.33 1.32 1.44 1.34
Figure 9: Predicted return by the Fuzzy HEAVY-r model
(RV at frequency 1min)
Figure 10: Predicted return by the Fuzzy HEAVY-r model
(RV at frequency 5min)
Figure 11: Predicted return by the FUZZY GARCH model.
6 CONCLUSION
We found that the correlation and the clustering of
volatilities observed empirically better captured by
the Fuzzy HEAVY-r model.
The result shows that the Fuzzy HEAVY-r models
outperform the Fuzzy GARCH model and GARCH
model in out‐of‐sample evaluation according to
RMSE.
REFERENCES
Andersen, T. G., Bollerslev, T., & Labys, F. X. (2001a).
The Distribution of Realized Exchange Rate Volatility.
Journal of the American Statistical Association, 96, 42-
55.
Barndorff-Nielsen, O. E., & Shephard, N. (2002).
Econometric analysis of realized volatility and its use
in estimating stochastic volatility models. Royal
Statistical Society, 64, 253-280. Récupéré sur
https://doi.org/10.1111/1467-9868.00336
Barndorff-Nielsen, O. E., Hansen, P. R., Lunde, A., &
Shephard, N. (2008). Designing Realized Kernels to
Measure the ex post Variation of Equity Prices in the
Presence of Noise. ECONOMETRICA, 76(6), 1481-
1536.
Bollerslev, T. (1986). Generalized autoregressive
conditional heteroskedasticity. Journal of
Econometrics, 31, 307-327.
Engle, R. F. (1982). Autoregressive Conditional
Heteroscedasticity with Estimates of the Variance of
United Kingdom Inflation. Econometrica, 987-1007.
Holland, J. H. (1984). Genetic Algorithms and Adaptation
(Vol. 16). Boston: Springer.
Hung, J.-C. (2009b). A fuzzy GARCH model applied to
stock market scenario using a genetic algorithm. Expert
Systems with Applications, 11710–11717.
SHEPHARD, N., & SHEPPARD, K. (2010). Realising the
future: forecasting with high-frequency-based volatility
(HEAVY) models. JOURNAL OF APPLIED
ECONOMETRICS, 197-231. Récupéré sur
https://doi.org/10.1002/jae.1158
Wang, W. Q., Golnaraghi, M., & Ismail, F. (2004).
Prognosis of machine health condition using neuro-
fuzzy systems. Mechanical Systems and Signal
Processing, 813-831.
Zhou, Khotanzad, E. a., & Alireza. (2007). Fuzzy classifier
design using genetic algorithms. Pattern Recognition,
3401-3414.
BML 2021 - INTERNATIONAL CONFERENCE ON BIG DATA, MODELLING AND MACHINE LEARNING (BML’21)
320
