
Fuzzy Logic Framework for Local Accessibility Assessment based on
Built Environment Characteristics
Fatima Hanani
1
, Aziz Soulhi
2
1
Laboratory LASTIMI, CEDOC EMI, Mohamed V University, Rabat, Morocco
2
National Higher School of Mines, Rabat, Morocco
Keywords: Built environment, Fuzzy Logic, Land use, Local Accessibility.
Abstract: Researchers and decision-makers are increasingly interested in assessing the impacts of urban design and
transportation planning on local accessibility. The used accessibility measures present several issues and
limitations, namely: lack of understanding of accessibility concepts and technical and computational
complexity. In this paper, we present a new method to measure local accessibility. In this method, we use the
fuzzy logic approach. Our proposed method will measure local accessibility according to the three urban
characteristics, i.e., activity density, land use mix, and street design. This work has confirmed that accessibility
is an issue of urban design. In particular, it has shown that the combination of two urban characteristics,
namely activity density, and land use mix, is very determinant for accessibility. This work can serve as a
helpful tool for policymakers to understand and capture the interactions between accessibility, land use, and
travel behaviour.
1 INTRODUCTION
The global urban transition that has been underway
for several decades is phenomenal. It has put cities
and governments in front of unprecedented
challenges to provide urban infrastructure and
services, such as education, energy, transport and
water. In addition, climate change, environmental
constraints and resource scarcity have added more
stresses to cities.
Transportation is one of the most essential
services as it connects the different city areas and
allows people to access opportunities. According to
(The Global Mobility Report, 2017), the proposed
principles for sustainable transport have four goals,
efficiency, green mobility, safety, and universal
access. These objectives are also associated with
land-use planning, and their successful
implementation depends on the integration of
transport and urban planning. In this perspective, the
concept of accessibility is supposed to provide a basic
framework for this integration (Saghapour et al.,
2018). In (Zhang et al., 2015), accessibility is defined
by the spatial distribution of potential destinations,
the ease of reaching each one, and the extent, quality,
and character of the activities found there. Recently,
accessibility has gained ground in city institutions
that can use it most effectively as a planning tool
(Páez et al. 2012) and also as a tool to evaluate
(Saghapour et al., 2018) the effectiveness of policies
for land-use and transport planning.
To transform the concept of accessibility into a
measure used by decision-makers, an extensive
literature on accessibility measures exists. According
to (Miller, 2020), there are three categories of
accessibility measures: cumulative opportunities
measures, gravity-based measures, and utility-based
measures. These methods have several limitations.
Furthermore, despite the extensive literature on the
impact of the built environment on travel behavior,
there was relatively little evidence on the relationship
between accessibility and the built environment.
Therefore, we believe that writing accessibility in
terms of the characteristics of the built environment
shows the importance of integrating land use and
transport.
For this purpose, we will propose, in this work, a
new method based on fuzzy logic that allows to assess
the local accessibility (at street level) according to the
surrounding urban characteristics. As described in
(Ewing et al., 2010), the built environment has five
attributes, namely: density, diversity, design,
destination accessibility, and distance to
transportation. In this paper, we chose to study the
Hanani, F. and Soulhi, A.
Fuzzy Logic Framework for Local Accessibility Assessment based on Built Environment Characteristics.
DOI: 10.5220/0010730800003101
In Proceedings of the 2nd International Conference on Big Data, Modelling and Machine Learning (BML 2021), pages 187-195
ISBN: 978-989-758-559-3
Copyright
c
2022 by SCITEPRESS – Science and Technology Publications, Lda. All rights reserved
187

following characteristics: density, diversity, and
design. This paper will answer the following
questions: Can sustainable accessibility (active
transport) be achieved through urban design? To what
extent can this opportunity serve city managers to
fulfill sustainable transport requirements?
This paper will be organized as follows. First of
all, we introduce the concept of accessibility and the
different methods used to measure it. After discussing
the limitations of existing accessibility measurement
methods, we will present our new measurement
method based on the fuzzy logic approach. Then, we
give a brief review of the literature (related works)
covering the impact of the built environment on
accessibility and travel behaviour. Besides, we
discuss the result of our method. Finally, we conclude
our paper by citing some perspectives for this work.
2 ACCESSIBILITY MEASURES
Accessibility has been the subject of much work
among researchers and actors (planners, decision-
makers, transportation, development). Despite
several years of active discussions, this concern is still
more present in the debate on spatial planning and
transport planning issues.
2.1 Local Accessibility Definition
Accessibility is a significant feature of urban areas
and often represents transport and land-use
objectives. Several scientific fields such as transport
planning, urban planning, and geography use this
concept, which plays an essential role in
policymaking (Karst et al., 2004). It can be a practical
tool for planning and evaluating transport and land
use planning (Saghapour et al., 2018).
There are several definitions of accessibility. We
quote some of them in the following. Firstly, in (Páez
et al. 2012), the author defines accessibility as the
possibility to reach opportunities (desired services
and activities) distributed in space and time.
Secondly, in (Zhang et al., 2015), the author describes
accessibility by the spatial distribution of potential
destinations, the ease of access (cost and time
savings, variety of transportation modes) to each
destination, and the extent (quality, diversity, and
character) of activities. Finally, according to (Karst et
al., 2004), accessibility is the extent to which land use
and transport systems enable (groups of) individuals
to reach activities or destinations using (a
combination of) transport mode(s).
In the light of the last definition, we can define local
accessibility as the extent to which land-use planning
allows (groups of) individuals to reach activities or
destinations utilizing active modes of transport
(walking and cycling). In this case, accessibility can
measure the impact of land use on the city’s
sustainability and individuals by offering them the
possibility to access activities by walking or cycling.
2.2 Existing Accessibility Measures
Accessibility measures generally consist of two
essential elements (Páez et al. 2012): the traveller'
cost (determined by the spatial distribution of
travellers and opportunities) and the quality/quantity
of opportunities. According to the accessibility
literature, there are three methods, which identify
three broad categories of indicators.
Cumulative opportunities: this measure counts the
number of opportunities reached within a given
access threshold (isochrone). This type of measure
focuses on the number of potential destinations or
opportunities rather than their distance and indicates
the choices available to residents (Karst et al., 2004).
Gravity-based measures: this measure relies on the
evidence that destinations become progressively less
attractive and less accessible as the cost (travel time,
effort, cost) increases. This phenomenon can be
considered by weighting each destination according
to a decay factor (gravity function) representing its
distance from the origin (McCahill et al., 2015).
Utility-based measures: this method refers to the
random utility theory. According to this, the
probability that an individual will make a particular
choice (e.g., destination, mode of transport) depends
on the utility of that choice relative to the utility of all
others (Zondag et al., 2015). This measure
corresponds to the log-sum of discrete choice models
applied to destination choice analysis (Páez et al.
2012).
2.3 Built-environment-based Measure
According to (Miller, 2020), the accessibility
measurement methods mentioned above present
several issues and limitations, namely: lack of
understanding of accessibility concepts (among
politicians, the public and non-modellers), technical
complexity, computational complexity, and lack of
standardized software availability and data.
Imprecision is another limitation of the different
methods of measuring accessibility. Thus, in the case
of arbitrary selection of the isochron, the imprecision
concerns the absence of differentiation between the
BML 2021 - INTERNATIONAL CONFERENCE ON BIG DATA, MODELLING AND MACHINE LEARNING (BML’21)
188

possibilities adjacent to the origin and those just
inside or outside the isochron. For the other methods,
as mentioned in (Handy et al. 1997), the parameters
of the impedance function have to be selected or
estimated. However, these parameters, which reflect
the relative importance of travel impedance in the
choice of destination, are based on aggregate travel
patterns rather than individual travel decisions.
Indeed, the individual in their evaluation of
accessibility uses quantitative and qualitative
information, making the underlying travel cost
(impedance) different from one individual to another
(Páez et al. 2012). In addition, as stated in (Zondag et
al., 2015), accessibility is seen as the main effect of
the transport system. Therefore, all methods
presented above calculate accessibility as a function
of transport system parameters (cost, travel time,
distance).
This work aims to highlight the fact that
accessibility is also an outcome of urban design.
Therefore, we present a new method, based on fuzzy
logic, to assess the accessibility according to the
urban characteristics of the area. We call it built-
environment-based accessibly measure. The use of
fuzzy logic seems relevant to us, given the limitations
mentioned above. Indeed, it is difficult to set up a
measure of accessibility with precise variables and
intervals. Furthermore, city managers need to read,
understand, and modify the rules of the accessibility
calculation model easily. Moreover, with fuzzy logic,
the accessibility measure is easy to understand and
interpret thanks to linguistic variables and human
reasoning.
3 BUILT-ENVIRONMENT AND
ACCESSIBILITY: RELATED
WORK
The substantial increase of the urban population,
urban sprawl and the distance from activities have
created a great need for travel that cannot be satisfied
by existing infrastructures and even by the
construction of others. This situation has led to the
high use of the private car. Consequently, cities face
recurrent congestion, pollution, social inequality,
road accidents, and increasing consumption of
gasoline (Toward Sustainable Mobility, 2019) (The
Global Mobility Report, 2017). As a result,
contemporary transportation focuses on changing
travel behaviour to reduce car travel and encourage
alternative modes, such as public transport, walking,
and cycling (Saghapour et al., 2018). In recent
decades, many studies have investigated and analysed
the interactions between urban form and traveller
behaviour. These studies have shown that travel
behaviour is impacted by socio-economic
characteristics (of the household) and built-
environment characteristics (of the surrounding area).
The latter is represented by the so-called 5D (density,
diversity, design, destination accessibility and
distance to transport) variables (Ewing et al., 2010).
In fact, the built environment impacts travel
behaviour through the degree of ease, the possibilities
offered to reach destinations, and the quality of
opportunities made available and accessible.
Therefore, accessibility, as defined above, is at the
heart of any change in travel behaviour.
Depending on the context, different studies on the
relationships between land use (5D variables) and
travel behaviour have focused on different transport
and travel parameters (trip frequency, distance
travelled, travel mode choices or total vehicle
kilometres travelled). However, we chose to limit our
research to these three characteristics (density,
diversity, design) considered by the scientific
literature to be the key factors that most influence
active transportation modes (at the local level) (Oakes
et al., 2007).
3.1 The Density of Activities
Density refers to the number of people, housing units,
jobs or floor area per unit area (Ewing et al., 2016). A
high density (residential, employment, other
activities, service, and leisure facilities) in a city will
reduce travel distances between residences,
workplaces and service facilities (Choi et al., 2020)
(Saghapour et al., 2016) on the one hand. On the other
hand, the complementary grouping of different
activities will help to better link different travel
objectives (Xia et al., 2020). Consequently, it will
limit energy consumption and vehicle emissions
(Yang et al., 2017) by creating walkable
environments and promoting public transport (Naess,
2012). As a result, residents of dense cities, with a
higher proportion of destinations within good
walking or cycling distance, can be expected to make
shorter daily trips on average than their counterparts
in less dense cities (Stevens, 2017). Therefore, this
can generate independence aims at the use of the
private car (Newman et al., 2006).
However, as discussed in (Deepty et al., 2019),
population or job density or even the aggregate
provide only a partial understanding and do not fully
capture the impact of the density of the set of
available activities on travel behaviour. Therefore, it
Fuzzy Logic Framework for Local Accessibility Assessment based on Built Environment Characteristics
189
would be wise to consider using a more
comprehensive variable to provide information on the
density of all activities in the area.
3.2 The Land Use Mix
Land use mix refers to the degree of concentration of
workplaces, shops, public administrations, cultural
events and recreational facilities (Song et al 2013). As
summarised by (Manaugh et al., 2013), since with a
single use of space, occupants will be obliged to use
motorized modes to get to their destinations, mixed-
use with complementarity will do the opposite. It will
allow the residents to walk or cycle to their
destination. According to several studies, the land-use
mix has several benefits to transportation, health,
economics and the environment (Manaugh et al.,
2013) (Hirt, 2016).
There are several methods for measuring land-use
mix (Song et al 2013). They all implicitly or explicitly
contain two concepts: distance and quantity. The
author in (Song et al 2013) surveyed the different
methods and classified them into two categories:
'Integral' and 'Divisional'. The first category of
measures, generally applied to small areas, tends to
reflect the balance of land use. However, the second
category, often applied to large geographic areas,
tends to reflect uniformity of land use.
3.3 Street Design and Network
Connectivity
As argued in (Brown et al., 2007), local urban design
principles, such as street configuration, availability of
sidewalks and bike lanes, and neighbourhood
aesthetic qualities, can influence the attractiveness of
non-motorised travel modes. In addition, the author
of (Ozbil et al., 2011) found that street network layout
is the leading independent variable affecting
pedestrian flow on streets. Furthermore, he argued
that shorter distances between intersections, smaller
block sizes and more direct paths encourage walking
and cycling. Indeed, according to (Ozbil et al., 2011),
the configuration of streets (connectivity) is
considered vital because it affects both the directness
of travel (making travel more or less efficient) and the
number of alternative routes, which has implications
for interest and safety. In other words, better network
connectivity can reduce travel distances for all
modes, including walking and cycling, and it can
provide more choices of routes. It should be
mentioned that there is essential literature dealing
with the measurement of connectivity. In (Dill et al.,
2004), the author evaluated several methods of
measuring connectivity (Block length, Block size,
Block density, Intersection density, Street density,
Connected Intersection Ratio, Percent four-way
intersections and Link-Node Ratio). In (Frank et al.,
2005), the author used the intersection density as a
measure of connectivity in his study at Atlanta. He
considered that areas with more than 30 intersections
per square kilometre are more walkable than other
areas. The author in (Litman, 2021) used Link-Node
Ratio as a connectivity indicator suggests that a link-
node ratio of 1.4 may be a good target for network
planning. Others found that values between 1.2 and
1.4 are good targets (Dill et al., 2004).
We have noted that the most used measures in the
literature are intersection density, street density,
connected node ratio and per cent four-way
intersection. In addition, the author in (Dill et al.,
2004) found a strong correlation between the first
three measures and suggested that Pedestrian Route
Directness (PRD) is the best measure to evaluate the
potential to encourage walking and cycling.
4 METHODOLOGY OF
LOCAL-ACCESSIBILITY
MEASUREMENT
4.1 Presentation of Fuzzy Logic
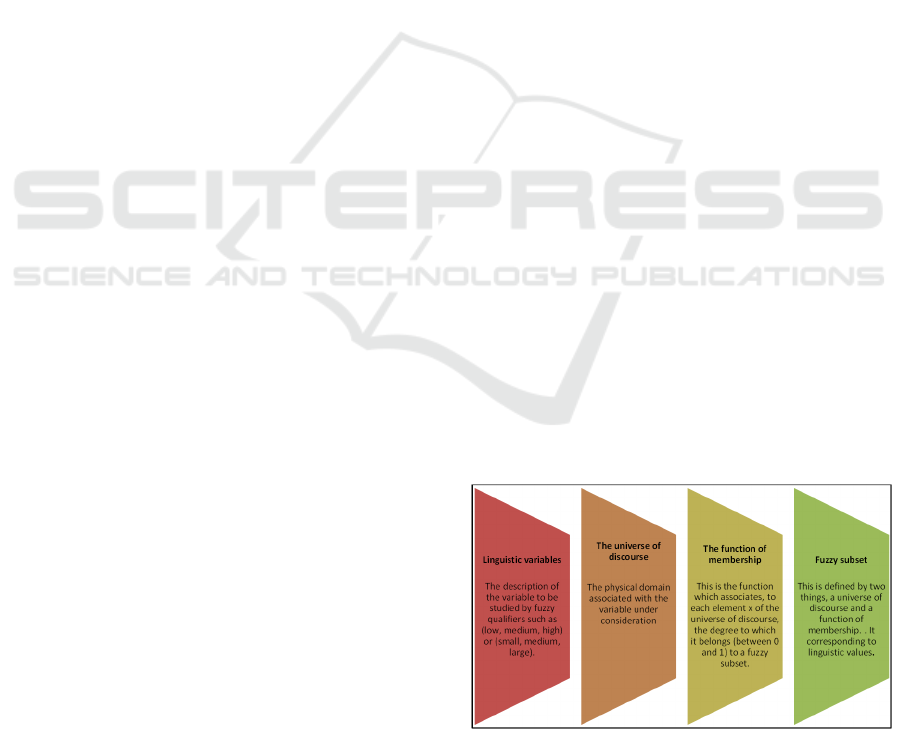
Fuzzy logic proposes a mathematical environment
built on the theory of fuzzy sets introduced in 1965
by Professor Lotfi A. Zadeh (University of California,
Berkeley). This approach attempts to simulate human
reasoning and allows the integration of imperfect data
in a decision process. As explained in (Hanani et al.,
2021), and described in figure 1, the basic
characteristics of fuzzy logic are the linguistic
variables, the universe of discourse, the function of
membership, and the fuzzy subset.
Figure 1: Fuzzy logic characteristics (Hanani et al., 2021)
Moreover, as presented in figure 2, the operating
principle of a fuzzy logic system includes three
Linguisticvariables
Thedescriptionof
thevariabletobe
studiedbyfuzzy
qualifierssuchas
(low,medium,high)
or(small,medium,
large).
Theuniverseof
discourse
Thephysicaldomain
associatedwiththe
variableunder
consideration
Thefunctionof
membership
Thisisthefunction
whichassociates,to
eachelementxofthe
universeofdiscourse,
thedegreetowhich
itbelongs(between0
and1)toafuzzy
subset.
Fuzzysubset
Thisisdefinedbytwo
things,auniverseof
discourseanda
functionof
membership..It
correspondingto
linguisticvalues.
BML 2021 - INTERNATIONAL CONFERENCE ON BIG DATA, MODELLING AND MACHINE LEARNING (BML’21)
190

phases. Namely: fuzzification, fuzzy inference
engine, and defuzzification.
Figure 2: fuzzy logic phases (Hanani et al., 2021)
4.2 Accessibility Assessment by Fuzzy
Logic
We suggest a new method for measuring local
accessibility that allows a significant level of spatial
disaggregation since we are interested in measuring
accessibility at the street level. Indeed, we will
describe local accessibility (output) as a function of
the three urban characteristics described above
(inputs), i. e., activity density, land-use mix and street
design. For this purpose, we follow the steps
illustrated in figure 3.
a) Fuzzification: we start by defining fuzzy
subsets and membership functions for each variable
of our fuzzy system (Input and Output). Then we
translate the different variables into fuzzy language.
b) Fuzzy inference: this is where we apply
human reasoning. This phase consists of two steps.
The first step is to build decision rules and find the
membership rule of the conclusion for each of them.
The second step consists of the aggregation of the
conclusions. For this phase, we use the Mamdani
inference mechanism.
c) Defuzzification: this final phase extracts a
real value from the fuzzy subset resulting from the
previous step. We chose to use the centre of gravity
method because it considers the entire final
membership function when calculating the final
result.
4.2.1 Definition of Linguistic Variables
To model our system to evaluate local accessibility,
we have defined the four variables. For each variable,
we determine
the fuzzy subset and the membership
functions.
a) Activity density index
As we pointed out above, it would be more relevant
to think about using a more exhaustive variable to
evaluate the influence of activity density on local
accessibility. In this regard, we have chosen to assess
the density exhaustively, considering all the existing
activities in the studied area (residential, jobs, other
activities, services, leisure facilities). Theoretically,
we cannot define the optimal distribution of each type
of activity that would lead to the ideal density (of
activities) in an area. Therefore, we will introduce a
reference area where the activity density is optimal.
Inspired by (Song et al 2013), and to have a
normalized variable, we have introduced a new
measure that will inform us about the degree of
dispersion of our study area compared to the
reference area. We call it the activity density index
(ADI). We assume that R is the reference area and k
is the number of activity types present in this area. For
each activity type i (from 1 to k), the density
percentage of each activity type i is 𝑟
with
∑
𝑟
1.
For a zone X with density percentages of each
type of activity 𝑥
(
∑
𝑥
1), we determine ADI by
measuring the dispersion of the density of X to R (the
average deviation from the reference). The ADI tells
us how much the activity density of area X deviates
from our reference area. We can calculate the activity
density index (ADI) of area X as follows:
𝐴𝐷𝐼
1 𝑟
|
𝑥
𝑟
|
1
In case of a wide deviation from the reference, the
value
|
𝑥
𝑟
|
is close to 1. Therefore, the activity
density index is close to 0. Assuming a density close
to the reference, the value
|
𝑥
𝑟
|
is close to 0.
Therefore, the activity density index is close to 1. For
this variable, we choose the following subset:
High activity density: when 𝐴𝐷𝐼 is high
than 0,8
Medium activity density: when the 𝐴𝐷𝐼 is
amount 0,6
Low activity density: when the 𝐴𝐷𝐼 is less
than 0,4
b) Land Use Mix
Based on (Song et al 2013), we choose to use the
entropy index, which is the most used measure to
evaluate the land use mix. Its formula is as follows:
𝐿𝑈𝑀 𝑃
ln𝑃
ln
𝑘
2
Where 𝑃
the percentage of each land-use type j in the
area, and 𝑘 is the number of land-use types
(categories of interest). The Entropy Index varies
from 0 (least mixed area) to 1 (most mixed area)
FUZZiFICATION
Transformingtheactual
variablestobestudied
(inputandoutput)into
linguisticvariablesby
assigningthemdegreesof
membershiptofuzzy
subsets
INFERENCE ENGINE
Consistofthe
inferenceruleswhich
isbuiltonexpert
knowledgebases
Allowgenerationof
thefuzzyoutputs
fromthefuzzyinputs
DEFUZZIFICATION
Transformthefuzzy
setresultofinference
enginetosinglenet
resultthatrepresents
theoutputofthe
fuzzysystem
Fuzzy Logic Framework for Local Accessibility Assessment based on Built Environment Characteristics
191
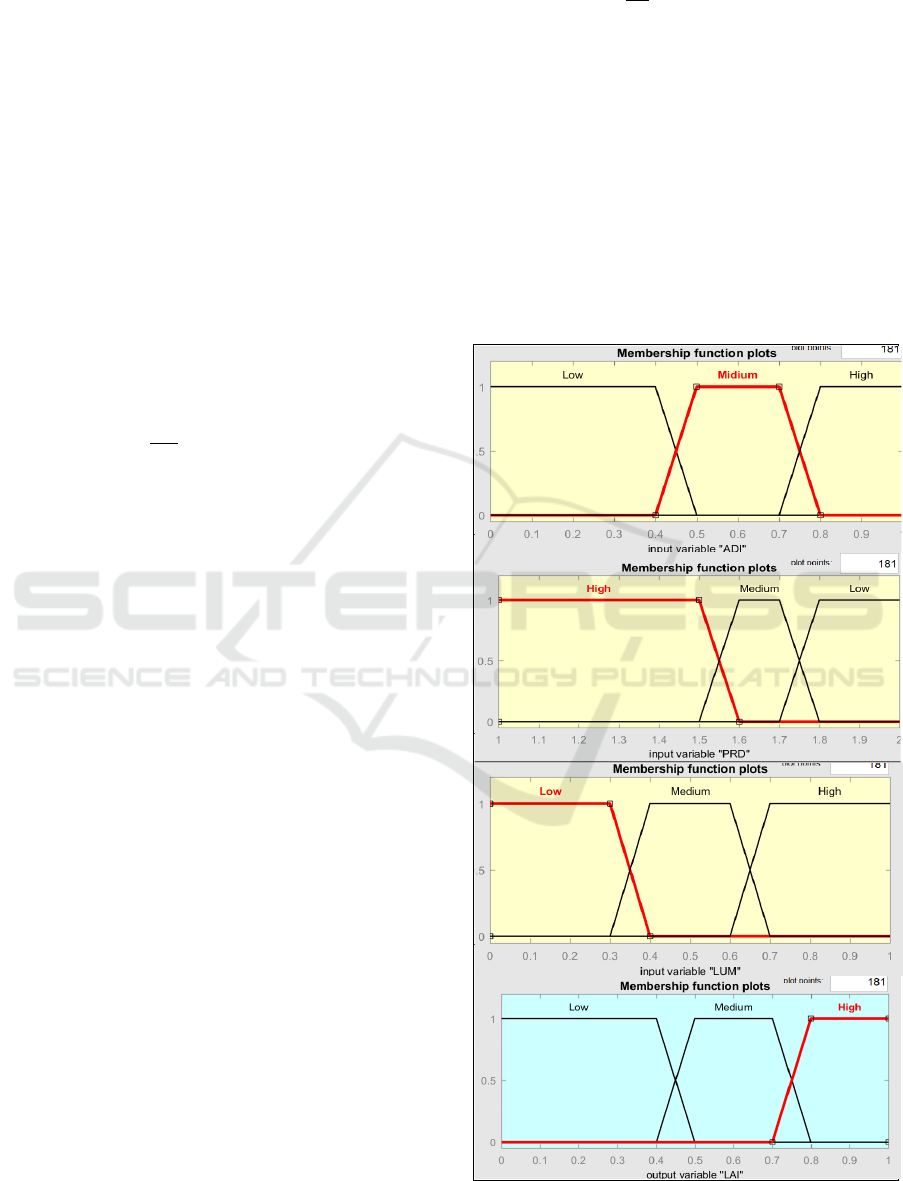
(Litman, 2021). According to (Litman, 2020), we
choose the following subset:
High Land use mix: when 𝐿𝑈𝑀 is high than
0,7
Medium Land use mix: when the 𝐿𝑈𝑀 is
between 0,5 and 0,7
Low Land use mix: when the 𝐿𝑈𝑀 is around
0,3
c) Street Design and Connectivity
For our study, since our objective is to see how the
built environment can improve local accessibility and
encourage active modes of transportation, we chose
to use Pedestrian Route Directness (PRD) to measure
street connectivity. As said above, it may be a better
measure that can inform the promotion of cycling and
walking than other measures. The PRD is obtained by
the ratio between the shortest Route distance (𝐷
) and
the Straight-line distance (𝐷
) for two selected points.
𝑃𝑅𝐷
𝐷
𝐷
3
The lowest possible value is 1, where the shortest
Route distance ( 𝐷
) is the same distance as the
Straight-line distance (𝐷
). Values further than one
(1) are not recommended because it indicates that the
route is not direct and there are several changes of
direction to reach the destination.
Based on (Dill et al., 2004), we define our subset for
connectivity index as follows:
High Street design & network connectivity:
when 𝑃𝑅𝐷 is less than 1,5
Medium Street design & network
connectivity: when the 𝑃𝑅𝐷 is between 1,5
and 1,8
Low Street design & network connectivity:
when the 𝑃𝑅𝐷 is higher than 1,8
d) Local Accessibility
We have noticed that there is no standard for
assessing local accessibility. Indeed, we can state
whether one area is more accessible than another by
comparing accessibility (regardless of the method
used for the calculation). But we certainly cannot
determine the perfect accessibility level for an area.
Therefore, we will introduce a reference area where
accessibility is optimal. We use the accessibility
value of this area as a baseline to assess the
accessibility of any studied zone.
We will assume that the accessibility of the
reference area is 𝐴
, and the accessibility of the
studied area is 𝐴
. We define a local accessibility
index (LAI) as the ratio between 𝐴
and 𝐴
.
𝐿𝐴𝐼
𝐴
𝐴
4
The highest possible value of LAI is 1, where the
accessibility of the studied area (𝐴
) is the same as
the reference zone (𝐴
). Small values than one (1) are
not recommended because it indicates that the studied
area is not well accessible. We define our subset for
local accessibility index as follows:
High accessibility when 𝐿𝐴𝐼 is high than 0,7
Medium accessibility when 𝐿𝐴𝐼 is between 0,5
and 0,7
Low accessibility when 𝐿𝐴𝐼 is less than 0,5
4.2.2 Membership Functions and Inference
Rules
Figure 3: Membership Functions.
BML 2021 - INTERNATIONAL CONFERENCE ON BIG DATA, MODELLING AND MACHINE LEARNING (BML’21)
192
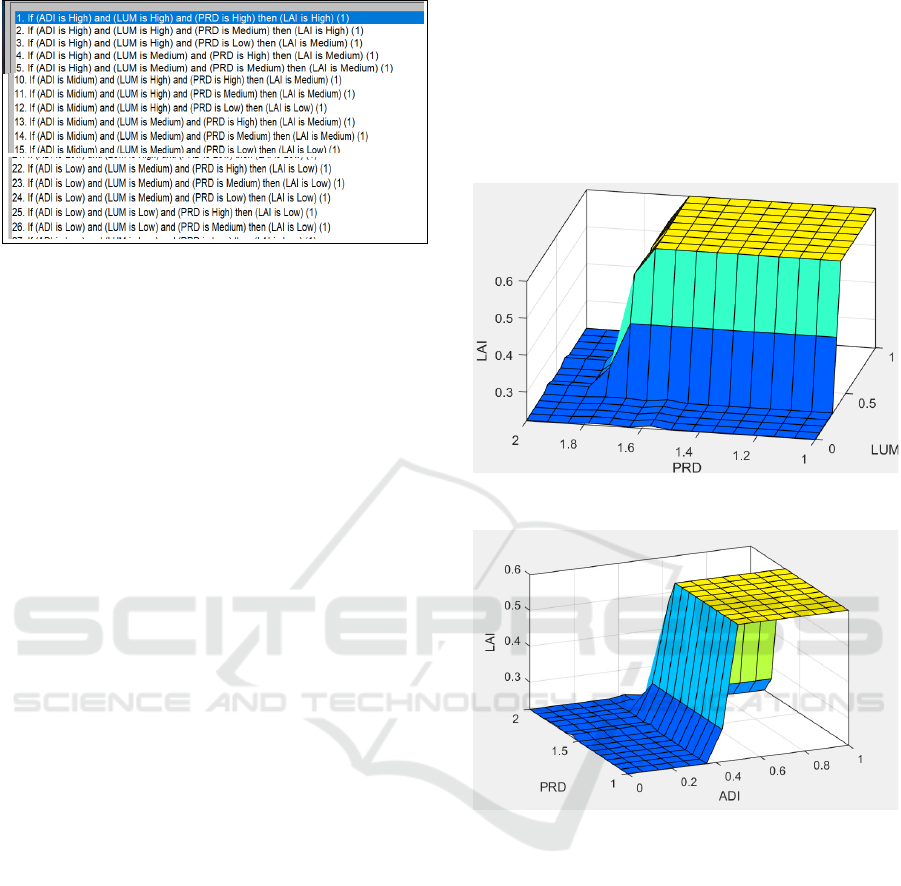
Figure 4: Example of Inference Rules.
Through the above section, we have built our fuzzy
system that measures accessibility in regards to three
variables, i. e. activity density, land-use mix and
street design. We define the universe of discourse, the
fuzzy subset (High, Medium and Low) and the
membership functions for each variable.
Figures 3 and 4 give an overview of our fuzzy
system for built-environment accessibility
measurement.
5 DISCUSSION
5.1 Result Interpretation
After the previous steps, our fuzzy system for
evaluating the local accessibility is now ready. We
proceed to the analysis and interpretation of the
defuzzification results. To do that, we will analyse the
surface graphs for three cases.
5.1.1 Case 1: Fixed ADI in an Average
Value
In this case, we set the density to an average value
(0.6), and we see how our system reacts.
We can see in Figure 5 that when the density is
medium, we can only expect a medium value of
accessibility. Therefore, when the PRD is low,
accessibility remains low whatever the value of the
LUM variable. This result shows that it is crucial to
consider ease of access when studying and plaining
local accessibility.
5.1.2 Case 2: Fixed LUM in an Average
Value
As per figure 6, when we set the LUM to a medium
value (0,5), we notice that this case presents the same
result as the previous one. The maximum
accessibility value we can expect is medium.
Therefore, when the PRD is low, accessibility
remains low whatever the value of the ADI variable,
which confirms the link between accessibility and the
ease of reaching a destination.
According to case 1 and case 2, we conclude that
the land-use mix has the same impact as the activity
density on local accessibility.
Figure 5: Surface View for the case N°1.
Figure 6: Surface View for the case N°2
5.1.3 Case 3: PRD Fixed in an Average
Value
As we can see in figure 7, in contrast to the two
previous cases, the most important remark is that
accessibility can reach high values but with one
crucial condition: both ADI and LUM must be
increased. In addition, this graph shows two main
findings:
- Local accessibility can be medium when at least one
of the two has a medium value;
- Local accessibility is low when at least one of the
two has a low value.
This result is consistent because when the density is
low, there is no reason to talk about the land-use mix.
Moreover, when the density is high, and the land use
Fuzzy Logic Framework for Local Accessibility Assessment based on Built Environment Characteristics
193
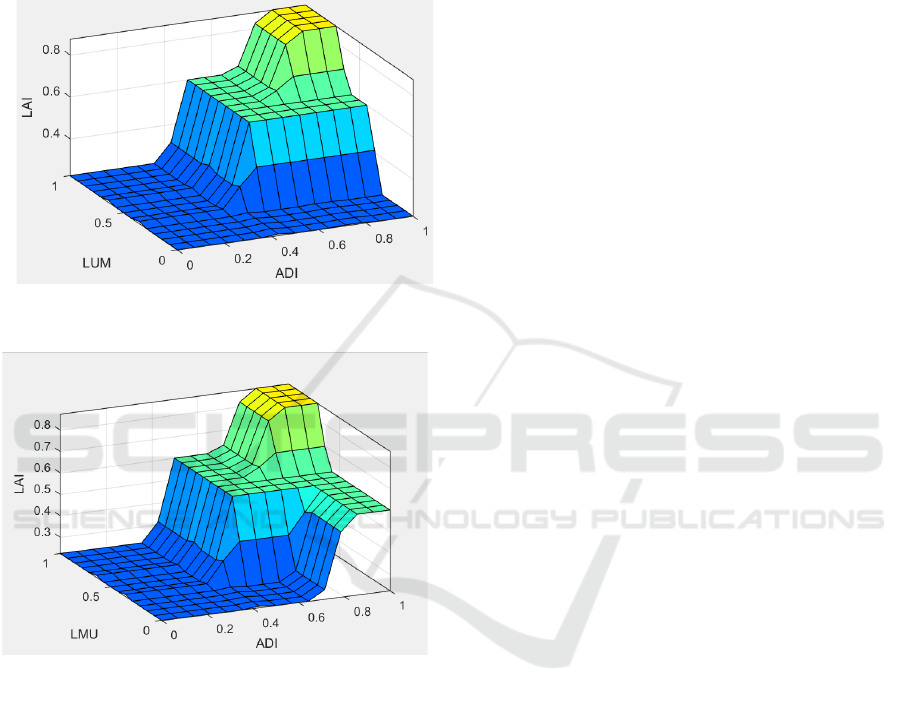
mix is down, we conclude that the area is mono-
activity. In both cases, the accessibility remains low,
except when PRD become high. In this case,
accessibility takes a medium value (figure 8).
Furthermore, we can conclude that a combination of
ADI and LUM characteristics are crucial and relevant
to achieve high local accessibility.
Figure 7: Surface View for the case N°3
Figure 8: Surface View for PRD high value
5.2 Contributions and Limitations
Although the commonly used method for measuring
local accessibility is the cumulative opportunity
method. In this paper, we chose to extend the scope
by considering the surrounding land use environment.
We decided to evaluate local accessibility using the
principles of the gravity method, incorporating an
impedance function capturing the access conditions
to each opportunity (PRD). This method allowed us
to consider the two main components of accessibility
(Karst et al., 2004): the ease of walking (or cycling)
to reach a destination and the quantity and spatial
distribution of opportunities. The first component is
represented, in our model, by the characteristic ‘Street
Design and Connectivity’ (PRD), and the second by
the combination of the two other urban
characteristics, i.e., Activity Density Index and the
Mixed-Use Index. We have suggested a model that
allows a high level of disaggregation to capture small-
scale design features (street scale), also evaluate non-
motorized trips. Therefore, our model can help city
decision-makers predict the full impacts of land use
management strategies on improving local
accessibility. Namely, densification of activities,
mixing activities and bringing them closer together by
improving walking and cycling conditions and
pedestrian-friendly environments.
To be relevant and practical, a model must be
exhaustive and consider all the factors and elements
that can influence accessibility. However, although
our model considers the two main components of
accessibility (opportunity and ease of access), it does
not consider how these two components are perceived
and used by individuals with different characteristics
(Páez et al. 2012). Therefore, our model deals only
with local accessibility, and it does not consider
regional accessibility. It only concerns active modes
of transport and not others.
6 CONCLUSIONS
It is widely recognised that accessibility is one of the
main effects of the transport system (Zondag et al.,
2015). However, this paper shows that accessibility is
also a matter of urban planning. In particular, we have
found that local accessibility can be defined by three
urban characteristics, i.e., activity’s density, land-use
mix and street design.
This paper presents a conceptual framework and a
new method to measure local accessibility. Based on
one of the tools of artificial intelligence, which is
fuzzy logic. This method is easy to understand and
interpret thanks to the use of linguistic variables and
human reasoning. It also showed that accessibility is
more affected by the two main characteristics, namely
activity density and land-use mix.
Furthermore, through this work, our objective is
to participate in the collective effort of researchers to
propose a model that allows transportation and land
use planners in cities to predict how their policies and
decisions can improve local (active) accessibility and
sustainable development.
In the perspectives, and to complete this work, we
intend to extend our model to treat the question of
accessibility globally and to consider the regional
dimension. Also, our work can be improved by
testing it with actual data to calibrate it.
BML 2021 - INTERNATIONAL CONFERENCE ON BIG DATA, MODELLING AND MACHINE LEARNING (BML’21)
194

REFERENCES
Brown, B.B., Werner, C.M., Amburgey, J.W. and Szalay,
C., 2007. Walkable route perceptions and physical
features: Converging evidence for en route walking
experiences Environment and Behavior Vol 39(1),
pages 34–61.
Choi, S., Choo, S. and Kim, S., 2020. Exploring the
influences of compact development on zone-based
travel patterns: a case study of the Seoul metropolitan
area, Transportation Letters, 12:5, 316-328,
Chris McCahill, Mary Ebeling, 2015. Tools for measuring
accessibility in an equity framework, Congress for the
New Urbanism 23rd Annual Meeting Dallas, Texas
April 29 – May 2.
Deepty. J, Geetam. T., 2019. Measuring density and
diversity to model travel behaviour in Indian context,
Land Use Policy, Volume 88, 104-199.
Dill, J., 2004, Measuring Network Connectivity for
Bicycling and Walking, TRB Annual Meeting.
Ewing, R. and Cervero, R., 2010. Meta Analyse: Travel and
the built environment, Journal of the American
Planning Association, Vol. 76, No. 3, pp. 265-294
Ewing. R., Hamidi. S. and Grace. JB., 2016. Compact
Development and VMT—Environmental Determinism,
Self-Selection, or Some of Both? Environment and
Planning B: Planning and Design, Vol 43, pp. 737-755
Frank, L.D., Schmid, T.L., Sallis, J.F., Chapman, J.,
Saelens, B.E., 2005. Linking objectively measured
physical activity with objectively measured urban form:
Findings from SMARTRAQ, American Journal of
Preventive Medicine, 28 (2 SUPPL. 2), pp. 117-125
Global Mobility Report, 2017.
https://sustainabledevelopment.un.org/content/docume
nts/2643Global_Mobility_Report_2017.pdf,
15/04/2021 22h30
Hanani, F., Soulhi, A., 2021 improving traffic congestion
assessment by using fuzzy logic approach. Journal of
Theoretical and Applied Information Technology,
Vol.99. No 3 pp 625-638.
Handy, S L, Niemeier, D A, 1997. Measuring accessibility_
an exploration of issues and alternatives, Environment
and Planning A, volume 29, pages 1175-1194.
Hirt, S. A., 2016. Rooting out mixed use: Revisiting the
original rationales, Land Use Policy, Volume 50, Pages
134-147,
Karst T. Geurs, Bert van Wee, 2004. Accessibility
evaluation of land-use and transport strategies: review
and research directions. Journal of Transport
Geography, Volume 12, Issue 2, Pages 127-140,
Litman, T., 2020. Evaluating Accessibility for Transport
Planning. https://www.vtpi.org/access.pdf, 23/04/2021,
13h30
Litman, T., 2021. Land Use Impacts on Transport,
https://www.vtpi.org/landtravel.pdf, 26/04/2021
15h30.
Manaugh, K., & Kreider, T., 2013. What is mixed use?
Presenting an interaction method for measuring land
use mix. Journal of Transport and Land Use, 6(1), 63-
72.
Miller, E., 2020, “Measuring Accessibility: Methods and
Issues”, International Transport Forum Discussion
Papers, No. 2020/25, OECD Publishing, Paris.
Naess, P., 2012. Urban form and travel behaviour:
experience from a Nordic context. Journal of Transport
and Land Use, 5(2)
Newman. P. W. G. and Kenworthy. J. R., 2006. Urban
Design to Reduce Automobile Dependence”, Opolis:
An International Journal of Suburban and Metropolitan
Studies, Vol. 2, No. 1, 2006, pp. 35-52.
Oakes JM, Forsyth A, Schmitz KH., 2007. The effects of
neighborhood density and street connectivity on
walking behavior: The Twin Cities walking
study. Epidemiol Perspect Innov.;4:16.
Ozbil. A., Peponis. J. and Stone. B., 2011. Understanding
the link between street connectivity, land use and
pedestrian flows, urban design International, vol 16},
pp 125-141
Páez, A, Scott, D. M., Morency, C, 2012. Measuring
accessibility: positive and normative implementations
of various accessibility indicators, Journal of Transport
Geography,Volume 25 , Pages 141-153,
Saghapour, T, Moridpour, S. & Thompson, R, 2016. Public
transport accessibility in metropolitan areas: A new
approach incorporating population density, Journal of
Transport Geography, Volume 54, Pages 273-285,
Saghapour, T, Moridpour, S. & Thompson, R, 2018.
Sustainable transport in neighbourhoods: effect of
accessibility on walking and bicycling.
Transportmetrica A: Transport Science
Song, Y., Merlin, L., Rodriguez, D., 2013. Comparing
measures of urban land use mix, Computers,
Environment and Urban Systems, Volume 42, Pages 1-
13,
Stevens, M. R., 2017. Does Compact Development Make
People Drive Less? Journal of the American Planning
Association, 83:1, 7-18,
Toward Sustainable Mobility, 2019.
https://www.sum4all.org/data/files/gra-
globalroadmapofaction-press.pdf, 10/04/2021, 12h20
Xia, C., Gar-On Yeh, A., Zhang, A. 2020. Analysing spatial
relationships between urban land use intensity and
urban vitality at street block level: A case study of five
Chinese megacities, Landscape and Urban Planning,
Volume 193, 103669,
Yang, B., Xu, T., Shi, L. 2017. Analysis on sustainable
urban development levels and trends in China's cities,
Journal of Cleaner Production, Volume 141, Pages 868-
880,
Zhang, C., Man, J., 2015. Examining Job Accessibility of
the Urban Poor by Urban Metro and Bus: A Case Study
of Beijing. Urban Rail Transit 1, 183–193.
Zondag, B., De Bok, M., Geurs, K. T., Molenwijk, E., 2015.
Accessibility modeling and evaluation: The TIGRIS
XL land-use and transport interaction model for the
Netherlands, Computers, Environment and Urban
Systems, Volume 49, Pages 115-125.
Fuzzy Logic Framework for Local Accessibility Assessment based on Built Environment Characteristics
195
