
A Trading Strategy in the Forex Market based on Linear and
Non-linear Machine Learning Algorithms
Nabil Mabrouk
a
, Marouane Chihab
b
and Younes Chihab
c
Computer Sciences Laboratory, Ibn Toufail University, Kenitra, Morocco
Keywords: forex, trading, machine learning, SVM, random forest, logistic regression, technical indicators
Abstract: In this article, we have compared two Forex trading strategies based on different machine learning algorithms.
We used an algorithm that generates technical indicators and technical rules. The technical indicators contain
information that may explain the movement of the stock price. The generated data was fed to a machine-
learning algorithm to learn and recognize price patterns. The first approach uses a linear classifier algorithm
to classify data into two classes by a line or a hyperplane (BUY or SELL Signal); the second approach, unlike
the first one, uses a non-linear classifier algorithm to predict the next day's stock movement. We have
evaluated the model's performance by different metrics generally used for machine learning algorithms,
another method used to profitability by comparing the strategy returns and the market returns.
1 INTRODUCTION
The foreign exchange market (FOREX or FX) is a
global market for trading currency. The forex is
known as the largest financial market in the world
(TANAMARTTAYARAT, 2018); investors can
make money by exchanging currency against another.
Still, the strong fluctuations of the prices make this
market a risky area for them. In the last few decades,
reducing the rate of risks and increasing the
profitability of investment in the forex using different
analyses such as the fundamental and the technical
analysis was a common researcher stream.
Many researchers proposed different strategies to
forecast the prices movement by applying technical
analysis; this type of analysis uses technical
Indicators that are mathematically calculated based
on historical data; although many practitioners use
technical indicators for trading, and they have not
received the same kind of attention in the literature
(Schwager, 1989; Lo, 2010). Technical indicators are
generally used to create a link between the past and
the future based on historical data (price and volume
patterns); those patterns are used to identify trends
believed to persist in the future (J. Neely, E. Rapach,
Tu, & Zhou, 2014). The traders use technical
a
https://orcid.org/0000-0001-8399-5581
b
https://orcid.org/0000-0001-5335-4329
c
https://orcid.org/0000-0003-0031-7609
indicators separately or combine some of them to get
the best result, such as the Relative Strength Index
(RSI); RSI is a commonly used oscillator in technical
analysis because of its ease of use and interpretation
(Moroșan, 2011).
Traditional programming could not solve
complicated real-life classification problems. Still,
Machine learning (ML) has shown impressive results
in solving such kinds of issues in many different areas
such as medicine (Di, 2007). The application of
machine-learning algorithms to predict trading on the
financial markets have become an area of interest of
a large group of traders; it shows a significant rate of
successful predicted trading, by transforming the
risky fluctuation into a source of information to
identify price patterns based on historical data; those
patterns are used to improve the profitability of the
strategy in the future.
Intelligent machine learning systems played an
important role and showed impressive performance in
modeling and forecasting data, such as Bitcoin high-
frequency price time series (Lahmiri & Bekiros,
2020). Numerous researchers have applied machine
learning to build trading strategies, among the
machine learning algorithms, such as Random Forest
(RF), support vector machine (SVM), Logistic
regression (LR), Neural Network (NN).
Mabrouk, N., Chihab, M. and Chihab, Y.
Trading Strategy in the Forex Market based on Linear and Non-linear Machine Learning Algorithms.
DOI: 10.5220/0010728800003101
In Proceedings of the 2nd International Conference on Big Data, Modelling and Machine Learning (BML 2021), pages 81-85
ISBN: 978-989-758-559-3
Copyright
c
2022 by SCITEPRESS – Science and Technology Publications, Lda. All rights reserved
81

In this article, we will compare two approaches
that use machine learning to predict the price
movement of a pair of currencies. The first approach
is a strategy built with a linear classifier algorithm,
and it tries to separate the classes by a line or
hyperplane like logistic regression. The second
approach is a different strategy built using a non-
linear classifier algorithm that does not use the
linearity of the data, like the decision tree, KNN.
2 ALGORITHMIC TRADING
Traders have developed numerous trading strategies
to avoid emotional investment and make profits from
the market. However, sticking to one trading strategy
will not necessarily lead always to good results, not
all successful trading strategies will stay helpful and
profitable in the future, the financial markets are
changing continuously with time due to various
factors that impact the state of the financial markets,
technical and fundamental analysis differentiate
and adapt their strategies for different situations.
Recently, Artificial intelligence (AI) Toke
advantage of the continuous changes of the financial
market to create a new type of trading based on Data
mining and machine learning. This type of trading
requires a complex analysis; the first step is feeding a
computer with a massive amount of past data sets,
then giving it enough time to execute complex
calculations; the computer learns price patterns by
itself and predicts them in the future. In the pre-
market-efficiency era (i.e., pre- 1960s), several
practitioners and researchers believed that predictable
patterns in stock returns might lead to "abnormal"
profits for trading techniques (Conrad & Kaul, 1998).
In (Chihab, Bousbaa, H., & Bencharef, 2019),
researchers have proposed a theoretical Multi-Agent
System for stock market Speculation. They used four
agents, the Metaheuristic Algorithm agent, technical
indicators, Text Mining agent, and Fundamental
Factor agent. The final decision is made based on the
combination of the four agent’s results.
2.1 Support Vector Machine (SVM)
In 1992 Vapnik and coworkers had introduced The
Support Vector Machine (SVM) as a computer
algorithm that learns by example to assign labels to
objects (M. Guyon, N. Vapnik, & E. Boser, 1992).
The SVM is a machine learning algorithm applied in
many different fields of business such as biology,
biomedical, recognizing handwritten digits,
fraudulent credit cards (Chihab, Bousbaa, Chihab,
Bencharef, & Ziti, 2019; S. Noble, 2006). To solve a
time-series forecasting problem, Cao (Juan Cao &
Eng Hock Tay, 2001) proposed a solution based on
two-stage neural network architecture constructed by
combining Support Vector Machines (SVMs) with a
self-organizing feature map (SOM). The backtest
showed an impressive result, not only in the
prediction performance but also in speed compared
with a single SVM model. In (Kim, 2003), Kyoung-
Jae proposed a promising alternative to predict the
stock market, by comparing the proposed method
with back-propagation neural networks and case-
based reasoning.
2.2 Logistic Regression
Logistic regression Is a commonly used machine
learning algorithm to model the chance of an event.
In (Sperandei, 2014) Sperandei, defined Logistic
regression as an algorithm that works very similar to
linear-regression, but with a binomial response
variable, which tries to model the logarithm of the
chance. (Kung-Yee & L. Zeger, 1988) proposed an
approach to solving multivariate time binary series
data; in this approach, the logistic regression eases the
computational burden of the maximum likelihood
method.
2.3 Random Forest
The Random Forest (RF) was Introduced in
(Breiman, 2001) as a combination of predictor trees.
It uses many trees to generate a predictive model. In
each node, a random selection of features is used to
identify the important predictors automatically.
Random forest (RF) is a non-linear machine
learning algorithm that can resolves classification
problems in many different fields of business; RF was
used to understand the financial markets and forecast
changes in prices. In (Booth, Gerding, & McGroarty,
2014), a trading strategy was built and developed
based on a Random Forest algorithm. The proposed
trading system forecasts the price return. The results
showed that random forests produce superior results
in terms of both profitability and prediction accuracy
compared with other ensemble techniques. Also, in
(Chihab, Bousbaa, Chihab, Bencharef, & Ziti, 2019),
another approach was proposed to forecast the future
price in the next week; the study showed impressive
results to improve the prediction accuracy by using
Random forest.
BML 2021 - INTERNATIONAL CONFERENCE ON BIG DATA, MODELLING AND MACHINE LEARNING (BML’21)
82
3 METHODOLOGY AND
RESULTS
3.1 Data
In this research, the used datasets are of the two most-
traded currencies in the world: the United States
Dollar and the Euro; the EUR/USD currency pair
represents the quotation of these two currencies EUR
and USD; the EUR is called the base currency, and
the USD is called the quote currency, when trading a
currency pair, the quote currency is used to buy the
base currency. The dataset covers the period from
January 01, 2014, until January 30, 2021. 80% of this
dataset was used for the training phase, the other 20%
of the dataset was used for the test phase; the data
segregation was done non-randomly to conserve the
temporal order. A time-series dataset is sequential
data obtained through repeated measurements over
time, hourly, daily, or weekly.
This work proposes two approaches for day
trading; the used dataset is an OLHCV data
indexed on the timestamp one day; each row is an
observation of five variables: Open, High, Low,
close, and Volume (OLHCV).
3.2 Feature Generation
3.2.1 Technical Indicators
Based on the existing OLHCV features, an algorithm
generates new features known as "technical
indicators"; this process adds additional information
based on mathematical calculations.
Technical analysts use technical indicators to analyze
and understand the price movement; they give an idea
of where the price might go next in a given market.
The datasets contain the most-used technical
indicators:
i) The Weighted Moving Average (WMA)
ii) The Exponential Moving Average
(EMA)
iii) The simple moving average (SMA)
iv) The Relatively Strength Index (RSI)
v) The average directional index (ADX)
vi) The Commodity Channel Index (CCI)
vii) The Rate-of-Change (ROC)
viii) The Bollinger Band (BB)
ix) The Moving Average Convergence
Divergence (MACD)
Each technical indicator is created on different
periods, as shown in Table 1; to give the algorithm
the ability to find the best combination of parameters
and select the best subset of relevant features
(predictors)
3.2.2 Feature Selection
Generating a large number of technical indicators on
different timeframes could lead to opposite effects on
the model performance due to noisy features; as a
solution, we decided to reduce the high
dimensionality of the datasets by selecting the
variables that contribute most to the prediction. In
(Guyon, 2017) Guyon determined the objective of
features selection in three parts: improving the data
speed prediction, facilitating the interpretation of
predictors, and providing a better understanding of
them, reducing the noise to improve the prediction
performance.
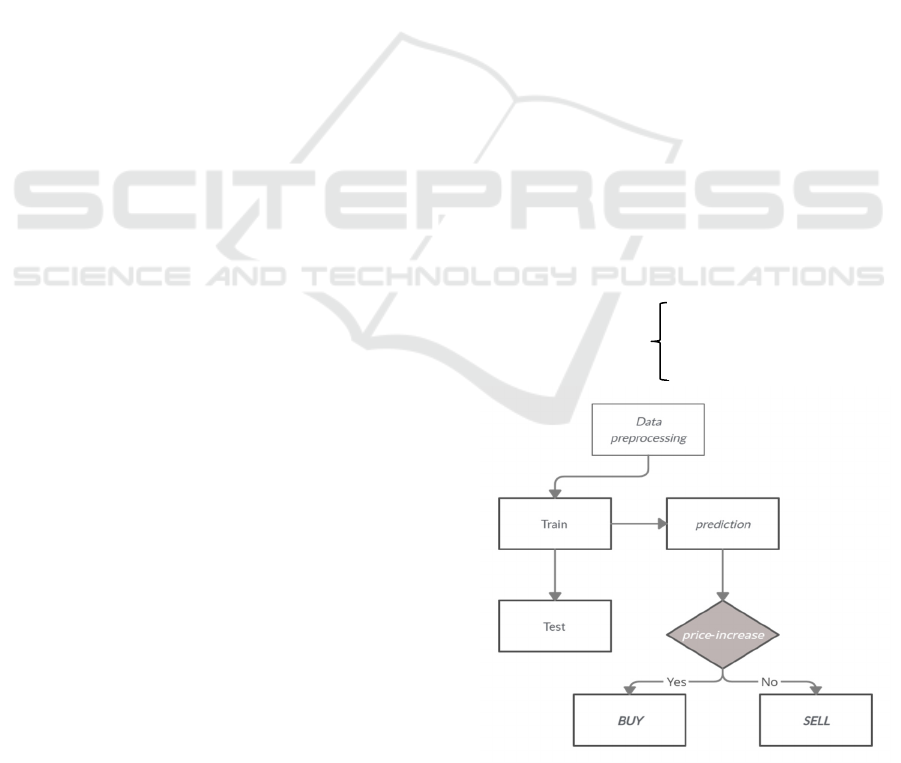
3.3 Our investment Strategy
The goal of our strategy is to buy when the price is
high and sell when the price is higher, which means
the machine learning model will predict the direction
of trade in the future. If the current day's closing price
is lower than the next day's closing price, it is a BUY
signal; otherwise, it is a SELL signal; the machine
learning algorithm will resolve a binary classification
problem. However, in the datasets, the dependent
variable will be coded “1” for a buy signal; and “0”
for a sell signal.
Y(t) = Signal (t+1)
Or Signal(t+1)
Figure 1: Investment strategy.
Buy (1), if price(t) < price(t+1)
Sell (0), otherwise
Trading Strategy in the Forex Market based on Linear and Non-linear Machine Learning Algorithms
83
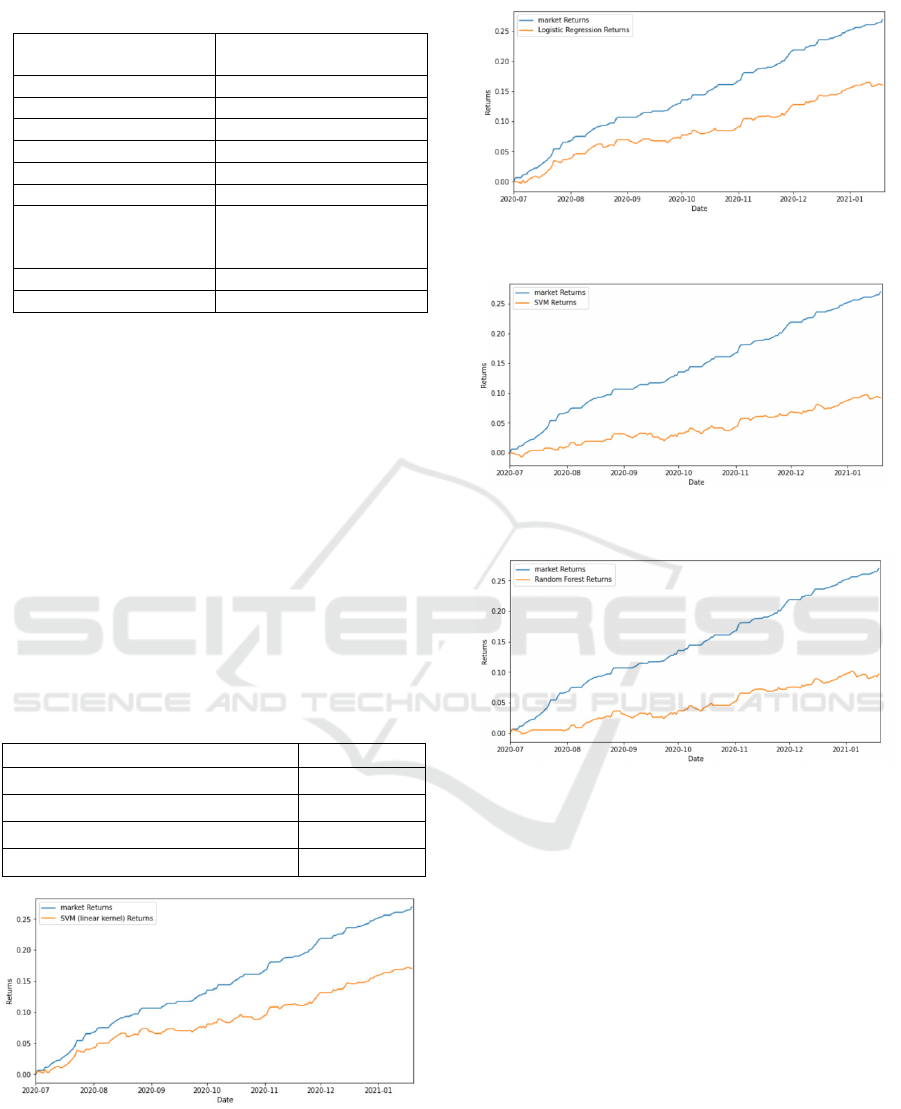
Table 1: Technical indicators used and their parameters
Technical Indicators
(TI)
Intervals for TI
p
arameters
SMA Period: [5, 30]
WMA Period: [5, 100]
EMA Period: [5, 100]
RSI Period: [5, 30]
ADX Period: [5, 30]
ROC Period: [15, 30]
MACD
Fast: [10, 20]
Slow: [20, 35]
Signal: [5, 10]
CCI Period: [5, 30]
BB Period: [5, 30]
3.4 Discussion and Results
Both the linear and non-linear algorithms achieved an
accuracy between 60% and 72%; the linear approach
was more performant than the non-linear as shown in
table 2. However, in forex trading, the machine
learning metrics are not enough to evaluate the
profitability of the strategy, we used another backtest
to evaluate it based on the log-returns as shown in
figures 2, 3, 4, and 5. The backtest showed that The
SVM with a linear Kernel gave the best results by
reaching 62% of total profits during the backtest
period, the non-linear approach also showed
promising results but it was not so impressive, it did
not exceed 34% of total profits.
Table 2: The performance of algorithms
Figure 2: SVM (linear Kernel) returns
Figure 3: Logistic regression returns
Figure 4: SVM (non-linear Kernel) returns
Figure 5: Random Forest returns
4 CONCLUSIONS
In the forex, many factors may impact the state of the
market in different ways, making it too complex to
develop the best trading strategy. In this study, we
have proposed a trading strategy to trade the
EUR/USD pair; this solution is developed and
backtested in a specific period, it may not stay helpful
and profitable in the future. In this case, our proposed
solution must be adapted to the current situation.
We hope that solution helps the traders to avoid
the emotional investment, and act without fear.
Algorithm Accuracy
Logistic regression
71%
SVM (linear Kernel)
72%
Random Forest
62%
SVM (non-linear Kernel)
60%
BML 2021 - INTERNATIONAL CONFERENCE ON BIG DATA, MODELLING AND MACHINE LEARNING (BML’21)
84

REFERENCES
Booth, A., Gerding, E., & McGroarty, F. (2014).
Automated trading with performance-weighted random
forests and seasonality. Expert Systems with
Applications, 41(8), 3651-3661.
Breiman, L. (2001). Random forests. Machine learning, 45,
5-32.
Chihab, Y., Bousbaa, Z., Chihab, M., Bencharef, O., & Ziti,
S. (2019). Algo-Trading Strategy for Intraweek Foreign
Exchange Speculation Based on Random Forest and
Probit Regression. Applied Computational Intelligence
and Soft Computing, 2019.
Chihab, Y., Bousbaa, Z., H., J., & Bencharef, O. (2019). An
approach based on a heterogeneous multiagent system
for stock market speculation. Journal of Theoretical
and Applied Information Technology, 835-845.
Conrad, J., & Kaul, G. (1998). An Anatomy of Trading
Strategies. The Review of Financial Studies, 11(3),
489–519.
Di, M. (2007). A survey of machine learning in Wireless
Sensor networks From networking and application
perspectives. 2007 6th International Conference on
Information, Communications & Signal Processing.
Guyon, I. (2017). Feature Selection: A Data Perspective.
ACM Computing Surveys, 50(6).
J. Neely, C., E. Rapach, D., Tu, J., & Zhou, G. (2014).
Forecasting the Equity Risk Premium: The Role of
Technical Indicators. Institute for Operations Research
and the Management Sciences.
Juan Cao, L., & Eng Hock Tay, F. (2001). Improved
financial time series forecasting by combining Support
Vector Machines with self-organizing feature maps.
Intelligent Data Analysis, 5(4), 339-354.
Kim, K.-j. (2003). Financial time series forecasting using
support. Neurocomputing, 55(1-2), 307-319.
Kung-Yee, L., & L. Zeger, S. (1988). A Class of Logistic
Regression Models for Multivariate Binary Time
Series. Journal of the American Statistical Association,
447-451.
Lahmiri, S., & Bekiros, S. (2020). Intelligent forecasting
with machine learning trading systems in chaotic
intraday Bitcoin market. Elsevier.
Lo, A. W. (2010). The Evolution of Technical Analysis:
Financial Prediction from Babylonian Tablets to
Bloomberg Terminals. Bloomberg Press.
M. Guyon, I., N. Vapnik, V., & E. Boser, B. (1992). A
training algorithm for optimal margin classifiers. COLT
'92: Proceedings of the fifth annual workshop on
Computational learning theory, 144–152.
Moroșan, A. (2011). The relative strength index was
revisited. African Journal of Business Management, 2.
S. Noble, W. (2006). What is a support vector machine? Nat
Biotechnol, 24, 1565–1567.
Schwager, J. D. (1989). Market Wizards. New York
Institute of Finance.
Sperandei, S. (2014). Understanding logistic regression
analysis. Biochem Med (Zagreb), 24(1), 12-18.
TANAMARTTAYARAT, K. (2018). THE WORLD’s
LARGEST FINANCIAL MARKET: FOREX. Social
Science Research Network, 2.
Trading Strategy in the Forex Market based on Linear and Non-linear Machine Learning Algorithms
85
