
Collecting Data for Machine Learning on Office Workers’ Attention,
Fatigue, Overload, and Stress during Computer Use
Rita Kovordanyi
a
Department og Computer and Information Science, Link
¨
oping University, Sweden
Keywords:
Cognitive State Prediction, Machine Learning, Office Work.
Abstract:
Predicting a computer user’s covert cognitive state, such as attention, has previously proven to be difficult, as
cognitive states are induced trough complex interaction of hidden brain processes that are difficult to capture
in a traditional rule-based methods. An alternative approach to modeling cognitive states is through machine
learning, which however, requires that a wide range of data is collected from the user. In this paper, we describe
our software for collecting a wide range of data from office workers’ during everyday computer work. The data
collection process is relatively unobtrusive, as it can be run as a background process on the user’s computer
and does not require extensive computational resources. We conclude by discussing practical issues, such as
data sample frequency, where one wants to strike a balance between good enough data quality for machine
learning and unobtrusiveness for the user.
1 INTRODUCTION
Data on gaze, heartrate, mouse actions, and key
presses, unobtrusively collected during computer use,
have a great potential to enable a range of applica-
tions in machine learning, such as human operator
monitoring, and performance or learning monitoring.
The application we target in this paper is an AI-based,
personalized productivity tool for computer work. To
assess the user’s potential to be productive, or con-
versly the user’s need for rest, the user’s cognitive
state, for example, if the user is mentally fatigued or
not, must be predicted. To predict the user’s cog-
nitive state, a wide range of data must be continu-
ously monitored and analyzed. Based on previous
studies (Rosengrant, 2013; Moreno-Esteva and Han-
nula, 2015; Hjortskov et al., 2004; Villon and Lisetti,
2007),and practical considerations, we have identified
a minimal set of variables to measure, which includes
the user’s heartrate, gaze direction (i.e., Eye Point of
Gaze, EPOG), and how the user interacts with the
computer using a mouse and keyboard.
Measuring these variables with high precision of-
ten entails the use of expensive and obtrusive sensing
devices to be warn by the user, such as chest straps
(for monitoring heartrate), or goggles or glasses (for
measuring EPOG). However, the use of such devices
a
https://orcid.org/0000-0003-2801-7050
would be too disruptive during continuous, everyday
computer work, and would also be economically un-
feasible for a typical end-user.
The present work takes a stance in the key real-
ization that the requirement for high-precision mea-
surements data can be relaxed if machine learning is
applied at a later step, so that the synergies between
multiple noisy data streams can be utilized. For ex-
ample, if EPOG is combined with other data, such
as where the currently active (foreground) window
is located on the user’s computer screen, an impor-
tant work-related dimension of the user’s visual at-
tention focus can be assessed. In this way, EPOG
and active window position in combination can help
to assess the user’s focus, without either measure be-
ing particularly accurate or highly informative on its
own. Likewise, low-frequency and noisy heartrate
measurements from a commonly available armband
device can be aligned to and complemented with other
data, to predict the user’s workload and stress level.
The long-term aim of this work is to develop ma-
chine learning techniques for monitoring user cogni-
tive state, to support user productivity. In the present
paper, we focus on describing the software suite for
data collection, while also touching briefly on our ma-
chine learning approach for cognitive state prediction.
The novelty of our approach lies in its unobtru-
siveness, as most part of the data collection can be
run as a background process on the user’s computer.
468
Kovordanyi, R.
Collecting Data for Machine Learning on Office Workers’ Attention, Fatigue, Overload, and Stress during Computer Use.
DOI: 10.5220/0010727800003063
In Proceedings of the 13th International Joint Conference on Computational Intelligence (IJCCI 2021), pages 468-476
ISBN: 978-989-758-534-0; ISSN: 2184-3236
Copyright © 2023 by SCITEPRESS – Science and Technology Publications, Lda. Under CC license (CC BY-NC-ND 4.0)

In addition, we collect a wide tange of data, to en-
sure that the cognitive states we aim to predict can be
assessed from the information we collect.
In the following sections, we will account for the
theoretical aspects of cognitive state enquiry and pre-
diction. We will in the Method section describe our
implementation of the software FocusBuddy used for
data collection. In the Results section, we discuss
practical caveats that can arise, considering that part
of the data collection process (the questionnaires) can
feel disruptive to users if they occur too frequently.
2 THEORY
We want to be able to predict the following cogni-
tive states: attention, mental fatigue, mental work-
load, and stress. The question is what type of infor-
mation should be collected and how, to reveal these
cognitive states in a user. Below, we focus on how
these states can be correctly elicited from the user via
various types of questionnaires, or scales.
2.1 Inattention and Distraction
Scales for assessing proneness to various forms of dis-
traction is not very useful in our case. We are in-
terested in a particular form of inattention, namely
when the user is engaged in non-work-related tasks
on his/her work computer, such as Googling. More
precisely, we want to assess whether the user is en-
gaged in non-work-related tasks. Only tasks that in-
volve the opening/re-activation of app windows on the
work computer can be detected by the system (Focus-
Buddy) – other forms of distraction, like talking on
the phone, will not be detected. Hence, only cases
when off-task activity on the computer has been de-
tected need to be confirmed by the user. Alternatively,
the user can take the opportunity to define the current
activity as being part of the ongoing work-activity.
Xu et al. (Xu, 2015) differentiate between con-
ventional distraction and tech-related distraction, and
have examined the validity of the Distraction Scale
for Chinese kindergarten teachers (Xu, 2015).
2.2 Work-related Momentary Stress
The Perceived Stress Scale-10 (PSS) is widely used
for measuring stress. The PSS scale measures global
stress over longer periods and comprises of 10 ques-
tions about how the subjects felt last month (Cohen
et al., 1983; Cohen et al., 1994). A study assessing
the possible biasing effect of gender, race and edu-
cation on the perceived stress scale-10, indicates that
in a larger population, no biases can be found (Cole,
1999).
Often, shortened versions of the PSS scale are
used: The Perceived Stress Scale-10 (PSS-10) in-
cludes questions 1, 2, 3, 6, 7, 8, 9, 10, 11 from
the original PSS, and has a maximum score of 40,
while the Perceived Stress Scale-4 (PSS-4) comprises
of only four questions: 2, 6, 7, 14, with a maximum
score of 16 (Cole, 1999). The questions used in PSS-4
are:
• Q2: You were unable to control the important
things in your life.
• Q6: You felt confident about your ability to handle
personal problems.
• Q7: You felt things were going your way.
• Q14: You felt difficulties were piling up so high
you could not overcome them.
Mitchell et al. (Mitchell et al., 2008) remark that
one underlying factor explains 45.6% of the variance
of the PSS-4 scale, which would mean that potentially
one question could be enough to get a reasonable as-
sessment of stress.
An alternative scale that focuses on work-related
stress in particular is the Brief Job Stress Question-
naire (BJSQ) (Inoue et al., 2014), used in Japan. The
BJSQ consists of 57 questions, regarding job, health,
and satisfaction.
2.3 Mental Workload
The NASA Task Load Index (NASA-TLX) has been
used for over 30 years to assess mental workload
(Hart, 2006). The scale is divided into six dimen-
sions. How these six dimensions should be weighted
into a total score for a particular task is determined on
the basis of how respondents judge the relative impor-
tance of each dimension given the possible 15 pairs of
subscales (Hart, 2006). The six dimensions are:
• Mental demand. How much mental and percep-
tual activity was required? Was the task easy or
demanding, simple or complex?
• Physical demand. How much physical activity
was required? Was the task easy or demanding,
slack or strenuous?
• Temporal Demand. How much time pressure did
you feel due to the pace at which the tasks or task
elements occurred? Was the pace slow or rapid?
• Overall performance. How successful were you
in performing the task? How satisfied were you
with your performance?
Collecting Data for Machine Learning on Office Workers’ Attention, Fatigue, Overload, and Stress during Computer Use
469

• Effort. How hard did you have to work (mentally
and physically) to accomplish your level of per-
formance?
• Frustration level. How irritated, stressed, and an-
noyed versus content, relaxed, and complacent
did you feel during the task?
An official computer implementation by NASA is
available for iOS or iPad from Apple’s App Store .
Over the years, simplifications have been developed
where only a subset of the six dimensions are used,
and/or only a subset of the questions in a dimension
are used. Following this line of development, a quick
work-related assessment of mental demand might be
achieved by using, for example, only the first subscale
of NASA-TLX: “How much mental and perceptual
activity was required? Was the task easy or demand-
ing, simple or complex?”
A more detailed scale for assessing mental work-
load is the Workload Profile (WP), which builds on
Wickens’ Multiple Resource Theory (MRT) (Wick-
ens, 2008). MRT identifies four main dimensions
where a task could tax the cognitive system: Stage
of processing, code of processing, input modality and
output modality. These can be further refined into two
categories each.
The Workload Profile (WP) measures the subjec-
tive workload associated with a task in the eight di-
mensions specified in MRT (Tsang and Velazquez,
1996). While it typically takes respondents about
half an hour to fill out a WP questionnaire, a much
quicker way to assess workload is by using a Bedford
scale, where the respondents are guided by a decision
tree structure consisting of simple yes/no questions,
starting with “Was it possible to complete the task?”
(Roscoe and Ellis, 1990) (see bottom-left in the flow-
chart below). The Bedford scale can be implemented
as a series of four simple Yes/No questions, that the
user can quickly go through.
2.4 Mental Fatigue
In a workplace setting, the type of mental fatigue we
are interested in has to do with time-on-task (TOT) af-
fects. Traditionally, fatigue was construed as the pro-
cess of depleting mental resources, so that the ability
to focus on a task diminished. Fatigue has also been
shown to disrupt sensorimotor gating (van der Linden
et al., 2006), indicating that fatigue might play a role
in the choice and enabling of the activity that the user
engages in. Hence, fatigue, might be part of a modu-
latory system that induces switching to another task.
In this way, fatigue seems to be closely related to at-
tention to a task.
In addition to time on task (TOT), other external
factors, such as heat, can also contribute to fatigue
(Qian et al., 2015). Mental fatigue is one of several
dimensions of the broader concept of fatigue.
The RAND SF-36 scale was developed as part
of the Medical Outcomes Study (Ware Jr and Sher-
bourne, 1992; Neuberger, 2003). The SF-36 scale
is free to use, under generous terms and conditions.
The mental fatigue subscale of SF-36 comprises four
items (two items are negative, two items positive):
23. Did you feel full of pep?
27. Did you have a lot of energy?
29. Did you feel worn out?
31. Did you feel tired?
2.5 Visual Analogue Scales
One way to administer psychological assessment
scales is by using a Visual Analogue Scale (VAS),
instead of the traditional category scale, such as the
Likert-scale. Category scales consist of discrete-step
choices, in a range from, for example, “constantly in
pain” to “never in pain”. A corresponding VAS-scale
would have a continuous line, possibly with simple
icons acting as “ticks” to simplify interpretation of
the continuous scale. Phan et al. (Phan et al., 2012))
compared VAS with Numerical Rating Scale (NRS)
and Verbal Rating Scale (VRS) in 471 patients. Re-
sults indicate a higher rate of missing values in VAS,
possibly due to a difficulty of patients to interpret the
two ends of the scale. Hence, it may be advantageous
to use explanatory emojis under the scale, to simplify
interpretation by the respondents.
3 METHOD: IMPLEMENTATION
OF THE DATA COLLECTION
SOFTWARE FocusBuddy
The software for collecting and handling user data
was written to run on both MacOS and Windows but
has only been tested on Windows (although, earlier
versions of the software have been tested and ran fine
on MacOS). We collect data and serve requests for
prediction using four software components:
1. A sensor part that runs locally on the user’s
desktop or laptop. Currently, this component is
platform-dependent, and runs on Windows.
2. A web app (Single Page App, SPA), where navi-
gation between pages is achieved in the browser,
in this way minimizing remote http-requests.
3. A backend server which ties together the other
components in the system.
SmartWork 2021 - 2nd International Workshop on Smart, Personalized and Age-Friendly Working Environments
470
4. A machine learning part, which is responsible for
data download preparation and training of user
models. Below, each of the four components is
described in more detail.
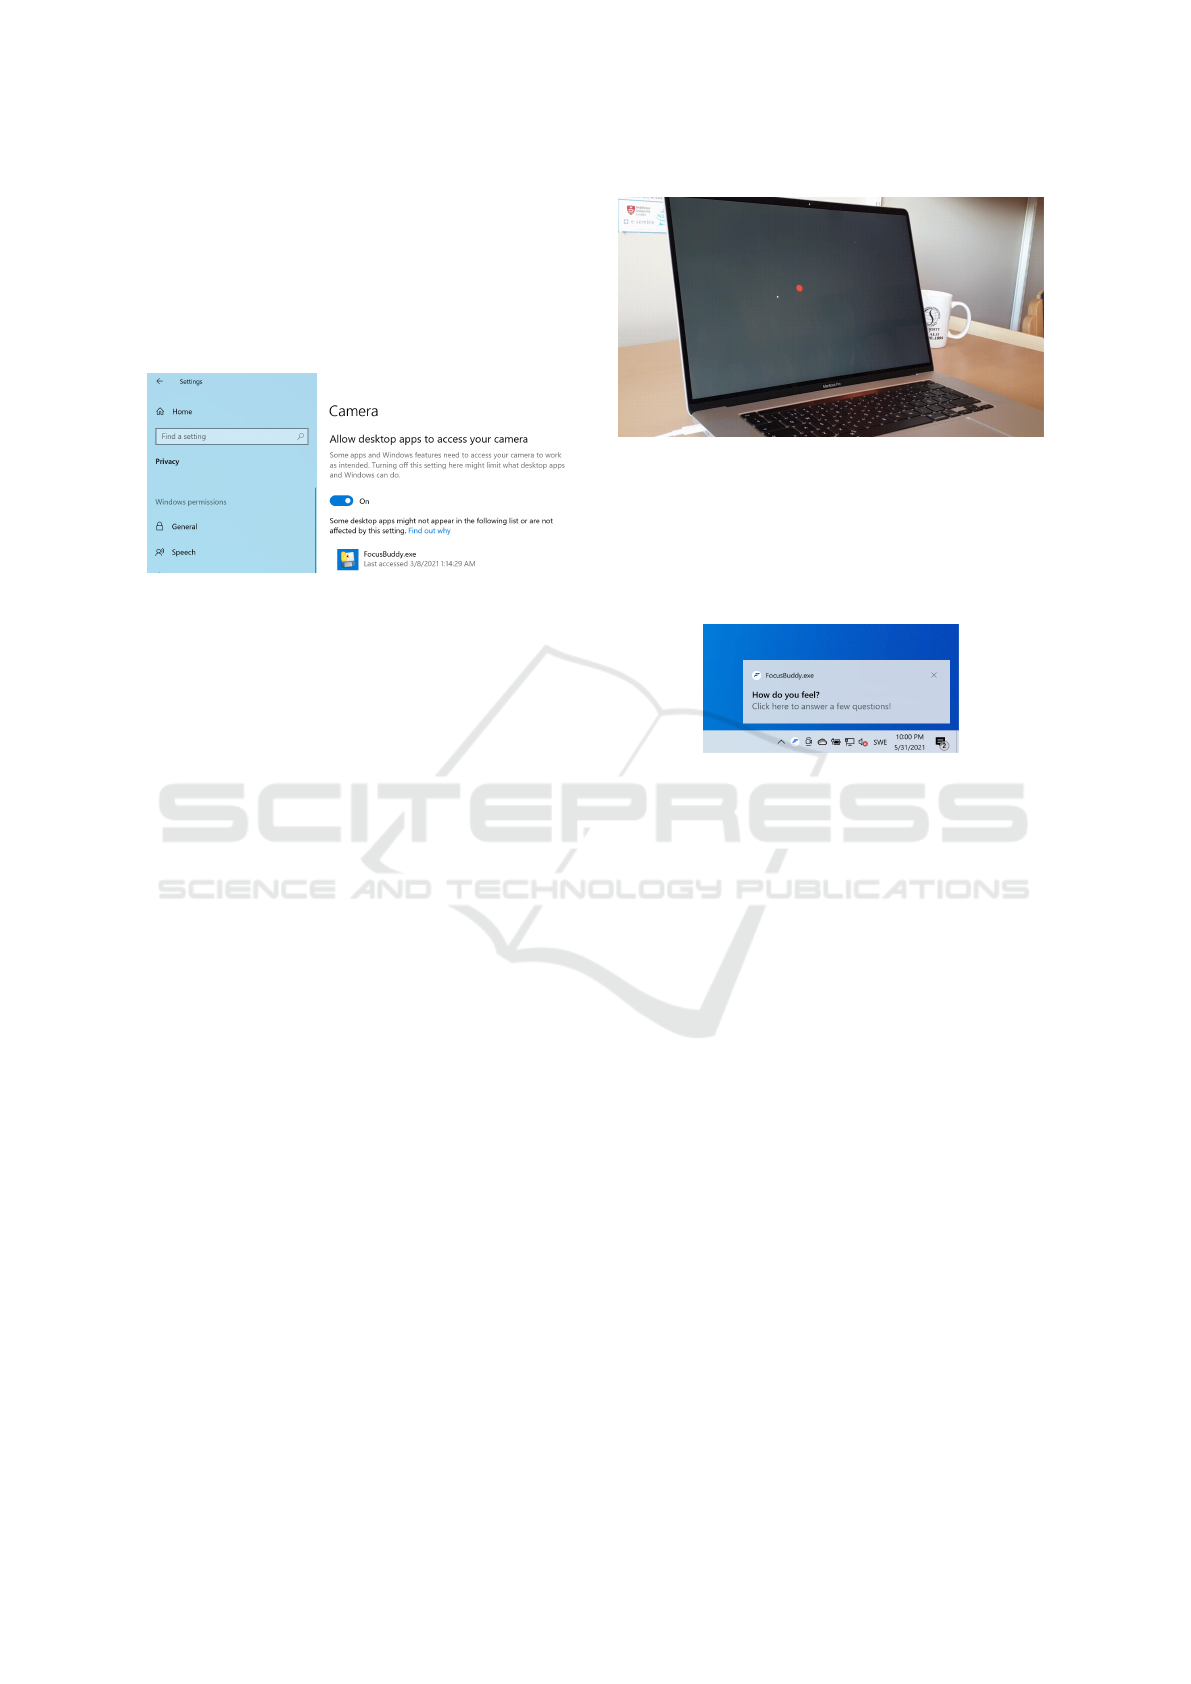
Upon installation of FocusBuddy the user needs
to give permission to FocusBuddy to use the webcam
connected to the user’s computer (Figure 1).
Figure 1: The user must explicitly allow FocusBuddy to
access the webcam. Without this, FocusBuddy will not be
able to record any gaze-related data (x, y)-coordinates of
where on the screen the user is looking.
Access to the webcam is needed in order to col-
lect data on where the user chooses to focus on the
work computer’s screen, more specifically, whether
the user chooses to look at the currently active win-
dow, or somewhere else.
Once started, FocusBuddy will first check the in-
ternet network availability, and will warn the user if
there is no network connection. (Network connection
is necessary for the operation of FocusBuddy, as all
collected data are sent to servers for storage and pro-
cessing. See below, as well as section 4 for further
details)
After network availability has been established,
the system starts up a gaze calibration process (Figure
2). The user is asked to fixate on a series of positions
on the screen. The fixations are prompted by red dots
displayed in consecutive locations on the screen (see
Figure 2). Based on where the user’s pupil is located
in the webcam image, and knowledge of where the
fixation points were prompted on the screen, a map-
ping is calculated which will later be used to translate
the user’s pupil location in the webcam image to cor-
responding screen coordinates on the user’s display.
When gaze calibration is finished, FocusBuddy
closes the calibration window and continues to run
in the background. This means that subprocesses are
started up, which collect information on where the
user looks, which window on the screen is currently
active, where the user moves the mouse, and whether
the user is typing or not.
After a predetermined interval (currently set to
15 minutes), FocusBuddy will display a notification
(Figure 3), prompting the user to describe how he/she
Figure 2: Snapshot of initial gaze calibration and testing.
The user is asked to fixate a series of red dots. At the end of
the calibration process, gaze tracking accuracy is measured
by running a few test points where the user is, again, fix-
ating on the red dot, and the system calculates the distance
between estimated gaze position and the known position of
the red dot. For illustration purposes, estimated gaze loca-
tion is marked with a small white dot.
Figure 3: Clickable notification that takes the user to a ques-
tionnaire about the user’s current cognitive state.
feels by asking him/her to fill out an online question-
naire 6. The questionnaire contains items on mental
fatigue, mental workload, momentary work-related
stress, distraction, and type of work task the office
worker has been occupied with during the last few
minutes.
In order to make the filling out of the question-
naire as smooth and quick as possible for the user,
Submit-buttons were omitted whenever possible. The
transition between question items were instead con-
trolled by the user’s click action on the sliders: When
the user has indicated a slider value, a transition was
triggered to the next question. In case the user wanted
to change his/her answer to a question, there was a
default back-button, which allowed backing up to any
previous question.
The last item on the questionnaire concerns the
user’s heartrate: The user is presented with an in-
struction video and asked to synchronize his/her Fitbit
armband with the Fitbit Android or iOS mobile app
(Figure 4). The Fitbit mobile app in turn communi-
cates the data to a Fitbit resource server in the cloud.
If this is the user’s first time, he/she is forwarded
(redirected) to a Fitbit login page in order to give
consent to share his/her heartrate data with Focus-
Buddy. Given the user’s consent, FocusBuddy re-
quests heartrate data from Fitbit for this user. The
Collecting Data for Machine Learning on Office Workers’ Attention, Fatigue, Overload, and Stress during Computer Use
471
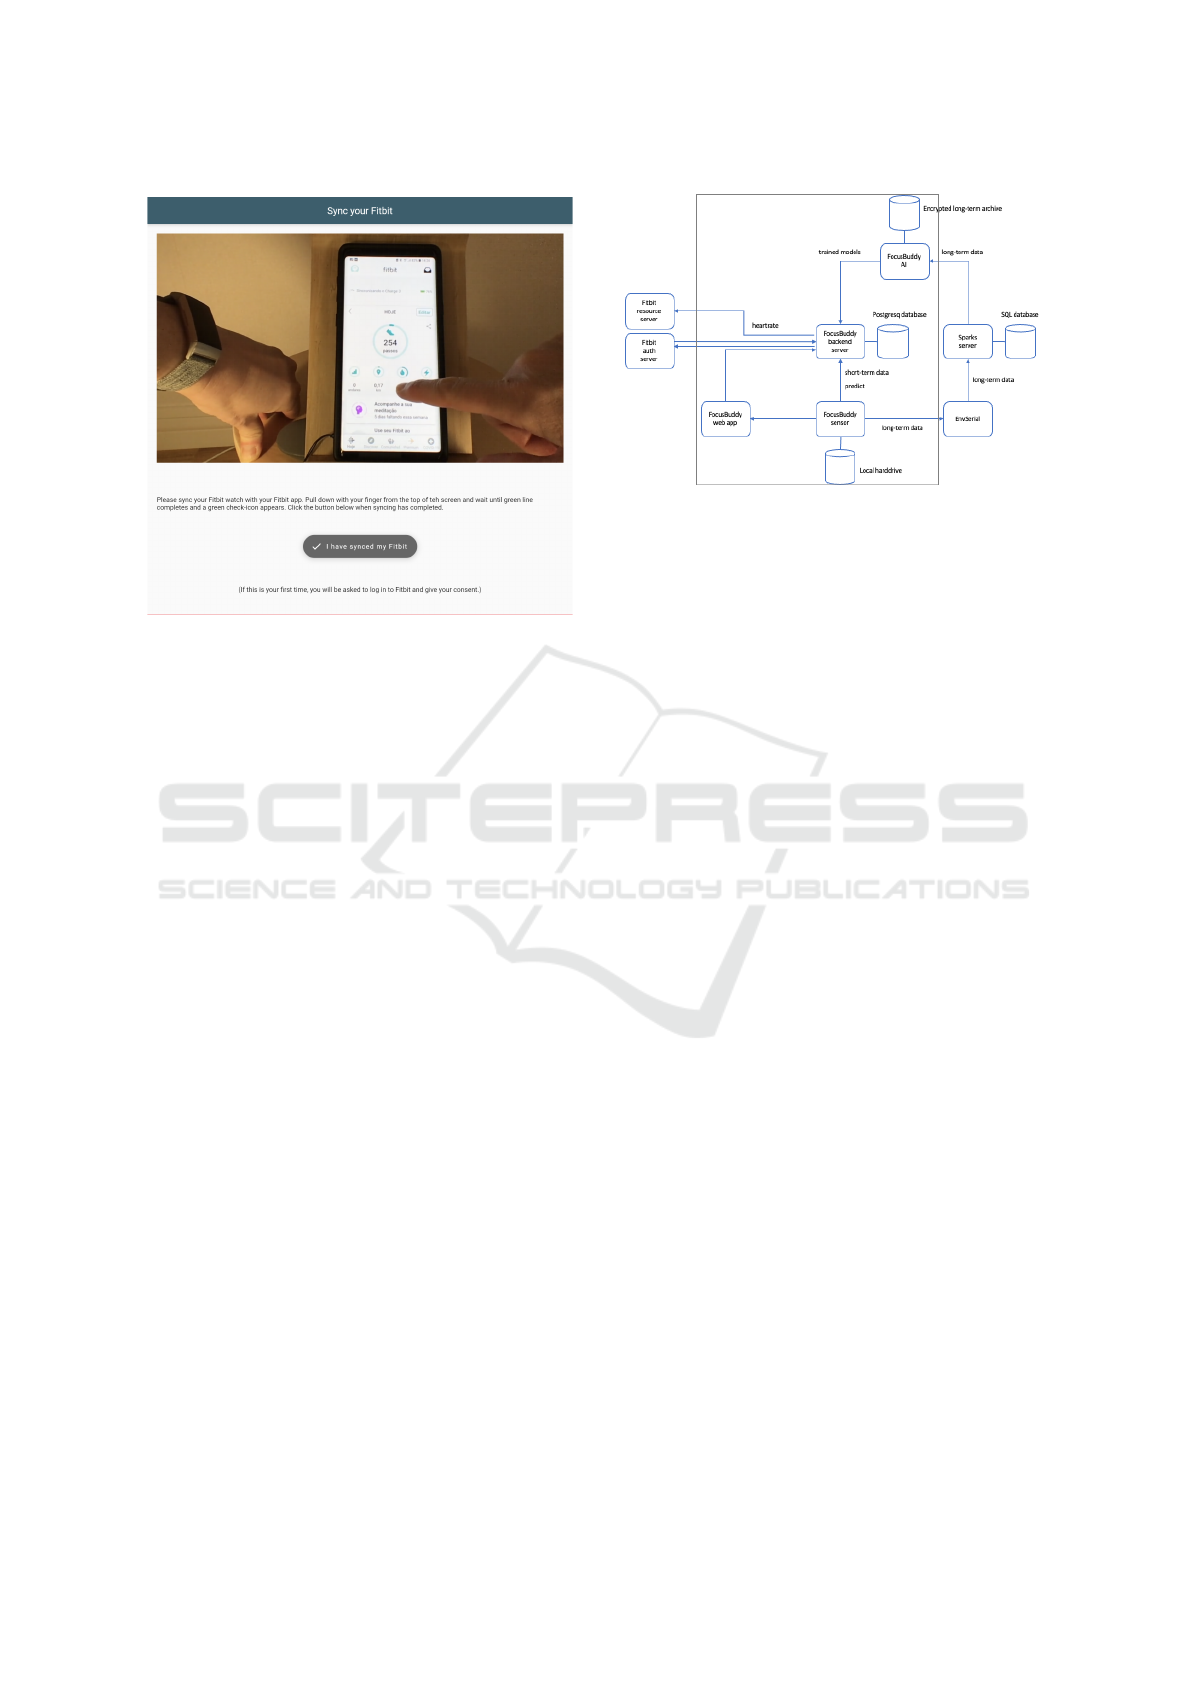
Figure 4: Last page of the questionnaire, where the user
is asked to synchronize his/her Fitbit watch with the Fitbit
app. This synchronization is needed, so that FocusBuddy
can fetch the user’s heartrate data from the Fitbit resource
server.
collected heartrate data is recorded by Fitbit at a sub-
second frequency and is therefore particularly useful
for predicting mental workload and momentary work-
related stress.
4 RESULTS
As mentioned previously, FocusBuddy consists of
four parts. These four parts communicate internally,
that is, between each other by requesting or sending
data and predictions (Figure 5).
4.1 Fetching Heartrate Data
The backend server and the web app collaborate in
fetching heartrate data from Fitbit. As a first step, the
web app sends an http request to the backend sever
to fetch heartrate data for the user. If this is the first
time for this user, the backend server authenticates to
the Fitbit authentication server, and requests an au-
thorization code from Fitbit (following the authoriza-
tion code flow). The authorization code is provided
by Fitbit to the FocusBuddy backend server by call-
ing a redirect URL. The redirect URL is “intercepted”
the FocusBuddy backend server, and an authorization
code is extracted from the URL. The authorization
code is then used to request and obtain an access to-
ken from Fitbit for the current user. With this access
Figure 5: Overview of the FocusBuddy architecture. Ar-
rows denote dependencies, with the arrow originating at the
caller and pointing at the called entity. Communication with
Fitbit is bi-directional due to the complex authentication
and user consent procedure. The roundish container shapes
denote data stores.
token, heartrate data is requested from Fitbit, and re-
turned to the initially requesting web app.
4.2 Sending Data for Long-term
Storage and Training
FocusBuddy sensor is regularly (at a sub-second fre-
quency) posting collected data to EnvSerial, which
forwards the data to the Sparks server. It is from this
server that the final training data is downloaded at the
end of each working day, to train the user models. As
a backup, that is, as a safety measure, all sensor data
is also saved locally, in the user’s Roaming directory,
and heartrate data and questionnaire answers are also
stored long-term on the FocusBuddy backend server.
4.3 Sending Data for Short-term
Storage and Prediction
All data that is collected by the sensor (running on
the user’s computer) is also posted to the FocusBuddy
backend server for short-term storage to be used for
prediction. These data are periodically cleared after
a prediction has been made, in this way only storing
data that is necessary for making the next prediction.
4.4 Requesting Predictions
As a default, FocusBuddy sensor requests a predic-
tion from the backend server every 10 seconds (this
interval can be adjusted through parameters sent by
the server in response to the prediction request). One
reason for the initially tight interval is that predic-
tions must be relevant and timely and therefore must
SmartWork 2021 - 2nd International Workshop on Smart, Personalized and Age-Friendly Working Environments
472

be made with short time delay after the observations
of the user activity pattern that could trigger a predic-
tion. A second reason for the tight prediction request
interval is that the server’s response to these requests
is also used as a control signal to the sensor: the back-
end sever sends back information on preferred notifi-
cation intervals, suggested intervention, URL to open
in connection with an intervention, and the cognitive
state dimensions that should be elicited in the next
questionnaire. In this way, the sensor part of Focus-
Buddy can be adapted to user needs, without having
to reinstall it on the user’s computer.
4.5 Implementation Details
In the following sections, we describe the internal
workings of each of the four parts of FocusBuddy,
providing technical details, and the frameworks, li-
braries and SDK:s used for their implementation.
4.5.1 FocusBuddy Sensor
FocusBuddy sensor is implemented in Python 3, us-
ing a large number of libraries, ranging from OpenCV
for image processing, used to extract gaze from web-
cam images, to win10toast-click, used in FocusBuddy
to display notifications (toasts) in the Windows sys-
tem tray .
The sensor software is divided into three pro-
cesses: gaze monitoring, active window monitoring,
and mouse and key monitoring. The advantage of us-
ing multiprocessing, rather than threading, is that in
this way, the individual processes are each capable of
running on their own separate CPU-core. The down-
side is that these subprocesses cannot communicate in
between them, and cannot be synchronized, for exam-
ple, logging to a common log file.
Hence, in the FocusBuddy sensor, each spawned
subprocess writes data to its own log-file. Also,
subprocesses cannot communicate with the spawning
parent process. And in the other direction, communi-
cation from the parent process to the spawned subpro-
cesses is cumbersome, as all subprocesses run inde-
pendently in parallel, and there is no way to interrupt
for synchronous communication. Instead, communi-
cation from parent to spawned process is achieved in-
directly, by sharing an event instance, which can be
unset or set. By setting a dedicated exit-event, the
parent process has a means of asking subprocesses to
finish processing, flush all waiting output (e.g., writ-
ing to a log file, and terminate).
One of the subprocesses, the one monitoring ac-
tive windows, is also responsible for displaying inter-
ventions and notifications prompting the user to fill
out a questionnaire. Interventions are triggered from
the backend server, when responding to a prediction
request from the sensor. Interventions and notifica-
tions that should be displayed are enqueued in a pri-
ority queue and popped according to their assigned
priority one at a time, so that only one toast is dis-
played at a time.
4.5.2 FocusBuddy Web App
The questionnaire is implemented as a web app us-
ing Flutter, where the same code base can be com-
piled to a web app (Javascript), an Android app, and
an iOS app. The questionnaire is divided into six di-
mensions, each of which in turn consists of individual
pages, where each page displays one question. The
user is automatically moved to the next page when
the answer to the current question has been indicated
by the user.
Most of the questions use a Likert scale, and the
answers can be indicated by dragging a slider (see
Figure 6). A few questions use radio buttons, where
the user has to choose one alternative, and tick boxes,
where several alternatives can be chosen (for further
details, see Error! Reference source not found.).
Figure 6: The first item on the questionnaire eliciting the
user’s own feeling of his/her cognitive state. The user can
indicate an answer by clicking on a position on the slider.
As soon as the user indicates an answer, the user is taken to
the next question. Hence, there is no Submit button, how-
ever, the user has the possibility to navigate back to a previ-
ous question to change his/her answer.
The last page of the questionnaire concerns
heartrate data. The user is shown a demonstration
video on how to synchronize their Fitbit watches with
their Fitbit mobile phone app. After the user has done
that, he/she is taken to a Fitbit login page, where the
user needs to log in, and give consent to Fitbit sharing
the user’s heartrate data with FocusBuddy.
The six questionnaire dimensions each concern a
particular cognitive state:
1. Mental fatigue
2. Mental workload
3. Momentary work-related stress
4. Distraction
5. Task-type (what type of work task the user has
been engaged in)
Collecting Data for Machine Learning on Office Workers’ Attention, Fatigue, Overload, and Stress during Computer Use
473

6. Heartrate elicitation (through a Fitbit armband)
Each of the six dimensions can be started up in-
dividually and can be administered in an arbitrary se-
quence. This allows for a flexible administration of
questions, removing cognitive state dimensions that
can already be predicted with high accuracy. In this
way, the user is only asked questions that are needed
for continued training of the cognitive model for this
particular user.
The questionnaire (the web app) is started up by
the active window monitoring subprocess of the sen-
sor, when the user has clicked a notification asking the
user to answer a few questions (Figure 3). The web
can be run in dark mode and with adapted font size,
depending on system settings, or controlled through
request parameters used to start up the web app.
These adaptations are envisaged to be part of more
extensive system-wide interventions, where the user’s
computer environment is adapted to his/her cognitive
needs.
4.5.3 FocusBuddy Server
We wanted to keep the server side as simple and
lightweight as possible. Hence, we used the micro
framework Flask with SQAlchemy as an ORM for
handling a PostgresQ database. The server accepts re-
quests for a prediction. Predictions are made by first
retrieving data from the internal SQL database, then
preprocessing these data, and finally feeding the data
into the user’s cognitive model to make a prediction.
Trained models for each user are stored on disk
server-side using the Tensorflow SavedModel format.
For each prediction request for a particular user, an
individual model is loaded using the Keras backend
library, the model is fed recent data and a prediction
is made. Upon updating the model’s internal state (ac-
tivations for LSTM cell and hidden state), the model
is stored on disk. The stored models can be easily
updated after training using git push.
4.5.4 AI-part: Machine Learning to Predict the
User’s Cognitive State
The AI-part of FocusBuddy utilizes individual mod-
els, one model for each user, maintained and trained
separately for each user, using that user’s data. In this
way, each user is served with a personalized model
adapted to his/her work style and computer activity
habits, as well as predictions being geared toward the
individual user’s self-reported cognitive states.
The models are based on Long Short-Term Mem-
ory (LSTM) networks, implemented using Tensor-
flow with Keras as frontend. We use LSTM as a main
component in the models, as we are dealing with a se-
quence of data, where there is a temporal dependency
between consecutive data points.
The models are temporarily stored and accessed in
the backend server, for the purpose of making predic-
tions of the user’s cognitive state when requested.
4.5.5 ML Operations
During operation of the predictive models (when run
on the backend server), there is a sequence of internal
model states that need to be remembered in order to
correctly process the next set of sensor data. For ex-
ample, an office worker’s mental fatigue is a cognitive
state that develops gradually over time. This means
that the cognitive model capturing this gradual evo-
lution must be able to remember its internal state, so
that new information can be put into context of what
was observed previously from this user.
There is one natural break-off in the stream of in-
coming data, and that is at the end of the working day.
Hence, the individual cognitive models served by the
backend server are trained off-line, at the end of each
working day. Data for each user is downloaded from
the Sparks server, the data is preprocessed, and ran-
domly divided into train, validation and test data sets.
The training set is used for adjusting the weights of
the user cognitive models, by subjecting the model to
the training set over and over again. Between these
epochs, model performance is evaluated on the vali-
dation set. In addition, validation data is used to ad-
just the models’ hyperparameters. Finally, the mod-
els are evaluated using the test data set. This final
evaluation is useful for monitoring the day-to-day im-
provement of the models. The trained models are up-
loaded (pushed using Git) periodically to the Focus-
Buddy backend server, where they are used for the
next period’s predictions. One period is typically one
day.
5 DISCUSSION
A particular issue that has arisen during initial data
collection concerns the frequency with which ques-
tionnaires are administered to the user. A couple of
our pilot users have reported that filling out a ques-
tionnaire every 15 minutes is too disruptive to their
ongoing work. We address this issue by letting the
frequency of questionnaires be dynamically altered
at runtime. The idea behind this is that question-
naire frequency can be gradually decreased as the user
model is trained and becomes better at predicting the
user cognitive states.
SmartWork 2021 - 2nd International Workshop on Smart, Personalized and Age-Friendly Working Environments
474

Of course, the upside frequent data elicitation is
that the user gets support with managing his/her men-
tal resources during work, and this support becomes
more accurate the more data is fed into the system.
Another concern is intrusion to privacy when an-
alyzing webcam video streams of the user. It is,
however, important to note that only the screen co-
ordinates denoting the location of the user’s gaze are
logged. No other video data is analyzed or stored.
In general, the use of the software is entirely vol-
untary. The aim with colleting the data in the first
place is to support the user, and the software con-
tributes a major benefit for the user through the in-
dividually adapted advice that can be offered to users
to help them become more efficient at their work and
find a better balance between working and resting.
6 CONCLUSIONS
We have presented a tailored software suite for data
collection for machine learning. Using this software
data collection can be run unobtrusively as a back-
ground process on the user’s desktop or laptop. The
software continuously monitors and logs a vast array
of data, ranging from gaze, where the active window
is located on the computer screen, and key and mouse
actions. In addition, the software also queries the
user’s heartrate (with the user’s permission) from a
FitBit server.
In connection to data storage, a machine learning
operations flow has been set up, where data are pre-
processed and used for training individually adapted
user models, with the aim to predict the user’s cogni-
tive state.
The data collection software seems to be relatively
lightweight, so that it can be run on the user’s com-
puter without too much increase in CPU or memory
load. Also, the sensor part of the software has been di-
vided into multiple subprocesses, each of which can
be run on a separate CPU core, which allows for full
optimization on an operating system level.
A major outstanding question is if training of In-
dividual models, using only data from that user works
as expected. Specifically, it remains to be seen if the
data collected from each user is enough, that is the
data set is large enough, for learning a useful model
for each user.
ACKNOWLEDGEMENTS
This work was supported by the SmartWork project
(GA 826343), EU H2020, SC1-DTH-03-2018 -
Adaptive smart working and living environments sup-
porting active and healthy ageing.
REFERENCES
Cohen, S., Kamarck, T., and Mermelstein, R. (1983). A
global measure of perceived stress. Journal of health
and social behavior, pages 385–396.
Cohen, S., Kamarck, T., and Mermelstein, R. (1994). Per-
ceived stress scale. Measuring stress: A guide for
health and social scientists. 10:5.
Cole, S. R. (1999). Assessment of differential item func-
tioning in the Perceived Stress Scale-10. Journal
of Epidemiology and Community Health, 53(5):319–
320.
Hart, S. G. (2006). Nasa-Task Load Index (NASA-TLX);
20 Years Later. Proceedings of the Human Factors
and Ergonomics Society Annual Meeting, 50(9):904–
908.
Hjortskov, N., Riss
´
en, D., Blangsted, A. K., Fallentin, N.,
Lundberg, U., and Søgaard, K. (2004). The effect of
mental stress on heart rate variability and blood pres-
sure during computer work. European journal of ap-
plied physiology, 92(1-2):84–89.
Inoue, A., Kawakami, N., Shimomitsu, T., Tsutsumi, A.,
Haratani, T., Yoshikawa, T., Shimazu, A., and Oda-
giri, Y. (2014). Development of a Short Version of
the New Brief Job Stress Questionnaire. Industrial
Health, 52(6):535–540.
Mitchell, A. M., Crane, P. A., and Kim, Y. (2008). Perceived
stress in survivors of suicide: Psychometric properties
of the Perceived Stress Scale. Research in Nursing &
Health, 31(6):576–585.
Moreno-Esteva, E. G. and Hannula, M. S. (2015). Us-
ing gaze tracking technology to study student visual
attention during teacher’s presentation on board. In
Krainer, K. and Vondrov
´
a, N., editors, CERME 9 -
Ninth Congress of the European Society for Research
in Mathematics Education, Proceedings of the Ninth
Congress of the European Society for Research in
Mathematics Education, pages 1393–1399, Prague,
Czech Republic. Charles University in Prague, Fac-
ulty of Education and ERME.
Neuberger, G. B. (2003). Measures of fatigue: The Fa-
tigue Questionnaire, Fatigue Severity Scale, Multi-
dimensional Assessment of Fatigue Scale, and Short
Form-36 Vitality (Energy/Fatigue) Subscale of the
Short Form Health Survey. Arthritis Care & Research,
49(S5):S175–S183.
Phan, N. Q., Blome, C., Fritz, F., s, J. G., Reich, A., Ebata,
T., Augustin, M., Szepietowski, J. C., and St
¨
ander, S.
(2012). Assessment of pruritus intensity: Prospective
study on validity and reliability of the visual analogue
scale, numerical rating scale and verbal rating scale
in 471 patients with chronic pruritus. Acta dermato-
venereologica, 92(5):502–507.
Qian, S., Li, M., Li, G., Liu, K., Li, B., Jiang, Q., Li, L.,
Yang, Z., and Sun, G. (2015). Environmental heat
Collecting Data for Machine Learning on Office Workers’ Attention, Fatigue, Overload, and Stress during Computer Use
475

stress enhances mental fatigue during sustained atten-
tion task performing: Evidence from an ASL perfu-
sion study. Behavioural Brain Research, 280:6–15.
Roscoe, A. H. and Ellis, G. A. (1990). A Subjective Rat-
ing Scale for Assessing Pilot Workload in Flight: A
decade of Practical Use. Technical Report RAE-TR-
90019, Royal Aerospace Establishment Farnborough
(United Kingdom).
Rosengrant, D. (2013). Using eye-trackers to study student
attention in physical science classes. Bull. Am. Phys.
Soc, 58.
Tsang, P. S. and Velazquez, V. L. (1996). Diagnosticity and
multidimensional subjective workload ratings. Er-
gonomics, 39(3):358–381.
van der Linden, D., Massar, S. A. A., Schellekens, A. F. A.,
Ellenbroek, B. A., and Verkes, R.-J. (2006). Disrupted
sensorimotor gating due to mental fatigue: Prelimi-
nary evidence. International Journal of Psychophysi-
ology, 62(1):168–174.
Villon, O. and Lisetti, C. (2007). A user model of
psycho-physiological measure of emotion. In Interna-
tional Conference on User Modeling, pages 319–323.
Springer.
Ware Jr, J. E. and Sherbourne, C. D. (1992). The MOS 36-
item short-form health survey (SF-36): I. Conceptual
framework and item selection. Medical care, pages
473–483.
Wickens, C. D. (2008). Multiple Resources and Mental
Workload. Human Factors, 50(3):449–455.
Xu, J. (2015). Investigating factors that influence conven-
tional distraction and tech-related distraction in math
homework. Computers & Education, 81:304–314.
SmartWork 2021 - 2nd International Workshop on Smart, Personalized and Age-Friendly Working Environments
476
