
Sleep Quality Monitoring with Human Assisted Corrections
Ioannis Konstantoulas, Otilia Kocsis, Elias Dritsas, Nikos Fakotakis and Konstantinos Moustakas
Department of Electrical and Computer Engineering, University of Patras, Greece
Keywords:
Automated Sleep Quality Monitoring, Human Assisted Automation, Wearable Devices, Work Ability
Sustainability, Older Office Workers.
Abstract:
Quality of life and wellness are heavily affected by sleep health, especially for older people who choose to
remain active in the workforce. Work ability and efficiency are correlated to sleep quality. Several non-
automated sleep assessment tools have been used by professionals in the healthcare industry. These tools
may rely on the user report of sleep quality perception. There also are objective tools that can diagnose sleep
disorder only for a limited amount of time in a hospital setting due to increased cost and heavy being very
unwieldy in a house setting. This paper aims to present the SmartWork project approach for human assisted
automated sleep quality assessment. The suggested method emphasizes the triggering mechanisms based
on behavioural and lifestyle routine to assist an automated system in correcting the results for personalized
scoring for each user. This work aims to guide older people in adopting a healthier sleep habit to enhance their
sleep quality and increase satisfaction.
1 INTRODUCTION
In modern workplaces, many people suffer from sleep
problems and struggle for achieving good sleep qual-
ity (
˚
Akerstedt et al., 2002). The sleep of poor qual-
ity impacts health and quality of life (Lucena et al.,
2020). Besides, small reductions in sleep duration
or increase in sleep interruptions can impact signifi-
cantly, especially older adults. It is shown in literature
that sleep problems can have serious implications, es-
pecially in the case of older people (ROEHRS et al.,
1983)(Cohen-Zion et al., 2001), including feelings of
tiredness, chronic pathologic exhaustion, sleep disor-
ders and potentially contributing to other health con-
ditions (e.g., depression). These pathologies create
even more complications by affecting work efficiency,
work ability and productivity (Nebes et al., 2009).
Having a lower ability to work or succeed, in turn,
disturbs a person’s emotional state and creates stress
and disappointment, that can burden sleep quality. As
a result, it can create a negative feedback loop that de-
grades an individual’s wellness, health and quality of
life (Nebes et al., 2009), (Knudsen et al., 2007).
In the last decade, the assessment of sleep quality
has attracted the interest of the research community.
Such an interest stems from the need for medical pro-
fessionals to reliably monitor and measure sleep qual-
ity. Sleep quality monitoring helps in the diagnosis of
sleep disorders, chronic conditions and many times
monitoring symptoms that cause bad sleep resulted
from other conditions (e.g., cough at night due to poor
management of chronic respiratory conditions) (Koc-
sis et al., 2015), (Khusial et al., 2019). There exists
a number of self-reported sleep quality tools, one of
them being the Pittsburgh Sleep Quality Index (PSQI)
(Smyth, 1999). The PSQI is one of the most used
self-report assessment tools, however, it is impacted
by the subjective feelings of the individual. An unob-
trusive approach to monitoring sleep is to use hand-
worn devices that monitor sleep like smartwatches
(GalaxyFit
1
, AppleSmartwatch
2
, FitBit
3
). In hospital
settings, there are a number of methods of objective
sleep assessment that are either already in use or are
being developed actively. Nonetheless, these methods
aren’t utilized in practice due to the need for machin-
ery and specialized personnel to operate it. One of the
most crucial parameters, for the users, in selecting or
even using any of said systems is unobtrusiveness and
comfort (Nakamura et al., 2017). Especially for older
people the ease of use is even more important.
This paper is part of work in the context of the
Smartwork project (Kocsis et al., 2019), which aims
1
https://www.samsung.com/uk/support/mobile-devices/
how-to-monitor-my-sleep-on-the-galaxy-fit-e/
2
https://www.apple.com/apple-watch-series-5/
3
http://www.fitbit.com.
Konstantoulas, I., Kocsis, O., Dritsas, E., Fakotakis, N. and Moustakas, K.
Sleep Quality Monitoring with Human Assisted Corrections.
DOI: 10.5220/0010727100003063
In Proceedings of the 13th International Joint Conference on Computational Intelligence (IJCCI 2021), pages 435-444
ISBN: 978-989-758-534-0; ISSN: 2184-3236
Copyright © 2023 by SCITEPRESS – Science and Technology Publications, Lda. Under CC license (CC BY-NC-ND 4.0)
435

to provide sustainability of work ability in the case of
older office workers and gives them a better chance in
competing for jobs through the improvement of their
work performanceand quality of life. In the literature,
there is a well-documented relation between sleep
quality and work ability (Eriksen et al., 2001)(Lian
et al., 2015). It demonstrates the correlation between
bad health and work ability reduction, failure to ac-
quire and sustain a steady job, perform well in de-
manding or even mundane tasks and, in general, be
satisfied with the productivity of one’s self. In pre-
vious work, we presented an ongoing approach for
continuous sleep quality assessment thar will be inte-
grated in the Smartwork system. This system supports
triggering mechanisms for behavioural and lifestyle
interventions in order to guide older people adopt
healthier sleep habits and increase their sleep quality
and satisfaction. The aim of this paper is to enhance
our previous approach (Konstantoulas et al., 2020)
considering human assistance in correcting the sys-
tem perception on how to score sleep quality person-
ally tailored to each person.
2 METHODS AND
EXPERIMENTAL SETUP
In this section, we will analyze in detail the sys-
tems and methodology for assessing the quality of
users’ sleep. In addition, in the context of the Smart-
Work system, we will discuss the purpose of sleep as-
sessment and the proposed approach to this problem.
Challenges arising from our approach and related so-
lutions will also be presented.
2.1 Selection of Sleep Assessment
Methods
In an attempt to identify the appropriate monitor-
ing/assessment device to use, we researched the pos-
sibilities of small to large-scale setups with obtrusive
and unobtrusive methods to qualify sleep patterns in
data form.
One of the most used self-reported questionnaires
by medical professionals is the Pittsburgh Sleep Qual-
ity Index (PSQI) (Smyth, 1999), with a demonstrated
long history compared to other sleep measurement
systems (Smith and Wegener, 2003). It can differenti-
ate poor from good sleep based on seven distinct cat-
egories: subjective sleep quality, sleep latency, sleep
duration, habitual sleep efficiency, sleep disturbances,
use of sleep medication, and daytime dysfunction
over the last month. Nevertheless, the accuracy of any
self-reported questionnaire is limited by the subjec-
tive perception of the reporter and does not qualify the
sleep quality of the person objectively. This paved the
way to objective sleep assessment, that many meth-
ods already provide. These methods include, on one
hand, costly hospice systems that assess sleep disor-
ders (e.g., polysomnography),and, on the other hand,
less expensive in-home systems for unobtrusive mon-
itoring, such as e-health applications (Corral et al.,
2017). For any system, the use of unobtrusive afford-
able solutions is one of the main concern tied to any
scalability concern (Nakamura et al., 2017). In the
marketplace, there exists a number of wearable phys-
iological monitoring devices such as smartwatches,
that allow for monitoring of sleep-related physiologi-
cal signals over many years in an unobtrusive and af-
fordable manner.
Another method is Ear-ElectroEncephaloGraphy
(EEG), that can even be used in a home setting (Naka-
mura et al., 2017). The performance of this method is
assessed by comparing a manually scored hypnogram
to a predicted label based on the in-ear sensor data.
Ear-ElectroEncephaloGraphy (EEG) as a method is
very precise and can predict sleep stages with high
accuracy (Mporas et al., 2013), (Mporas et al., 2015),
but as a disadvantage this method is unwieldy for per-
sonal use and obtrusive in a casual everyday setting.
Another method is using radio signals to monitor in-
somnia and sleep at home. This method measures ra-
dio signals that bounce off of the user’s body (Hsu
et al., 2017). Finally, in the market, the acceptance of
smartwatches and smartphones is increasing as they
are less obtrusive, affordable and easy to use methods
(GalaxyFit, FitBit).
For smart devices, especially, there is room for
evolution. Though the smartwatch data collection
methods are good enough, their companion back-end
data analysis, calculations and estimations are not uti-
lized to their best potential yet. These devices are ac-
cessible by everyone and can help in the development
of a large scale health assistance system for sleep as-
sessment and an integrated approach for matters that
deter or promote sleep quality. For instance, in a spe-
cific user’s life, bad sleep could be caused by poor
nutrition leading to tiredness that flares up some other
pathological condition. In this case, an integrated sys-
tem with unobtrusive and easy to use smart devices
can inform the user fora series of events that can pre-
vent their health deterioration by switching out some
poor nutrition options.
To our problem, in the scope of the SmartWork
project (Kocsis et al., 2019), we combine a self-
reported questionnaire with a quantitative objective
method to calculate the relevant scores through a
SmartWork 2021 - 2nd International Workshop on Smart, Personalized and Age-Friendly Working Environments
436
smartwatch. We aim to increase the accuracy of the
objective method, give feedback to the user when
their perception differentiates from reality, and ren-
der the user able to correct the underlying score when
the objective system is misconfigured.
2.2 The SmartWork System
The SmartWork is a Worker-Centric AI system, in
the context of the SmartWork project (Kocsis et al.,
2019). Its purpose is to integrate unobtrusive sensing
and modelling of the worker state considering a set
of novel services for the support of the context and
worker-aware adaptive work. The target groups of
the SmartWork system comprise of the office work-
ers, their employer and their carers. Motivated by
the fact that the health, behaviour, cognitive and emo-
tional status of the office worker is impacted, indi-
rectly, by their sleep quality, the proposed approach
will be implemented as a service of SmartWork.
2.2.1 An Overview of the Sleep Assessment
System
Our past work in (Konstantoulas et al., 2020) intro-
duced the design and implementation of the system
that monitors and assesses sleep quality. Its design
was based on a combination of an implementation of
the PSQI self-reported questionnaire and an objec-
tive scoring system for daily sleep data gathered by
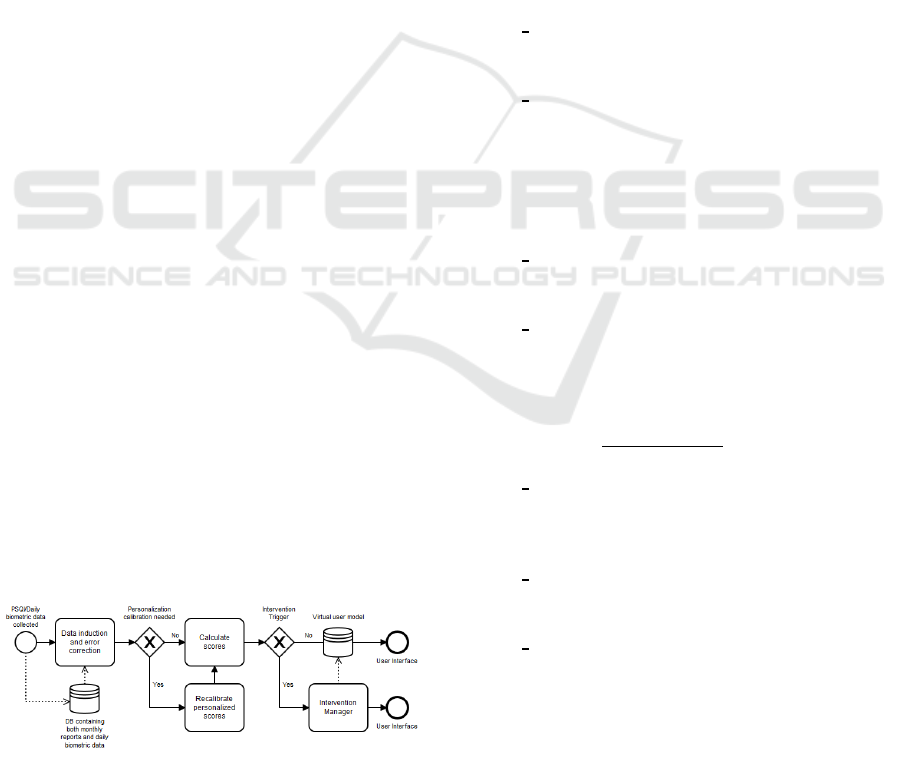
a smartwatch. This system (see Figure 1) is part of
a larger interconnected system (namely, SmartWork)
that predicts or analyses data from multiple sources
for a more holistic understanding of the user.
The system is fed with daily sleep data gathered
from a smartwatch, commercially available and easy
to use (FitBit). It is biometric data related to sleep,
daily physical activity implied from steps and heart
rate over the day and others. After data collection, a
pre-processing step is applied using classical methods
from data science to handle the potential uncertainty
of the devices. Notice that missing values are imputed
by a machine learning model but with unsatisfactory
accuracy yet.
Figure 1: Asynchronous process design for sleep data col-
lection.
2.2.2 User-perceived Sleep Quality
The user-perceived sleep quality is based on self-
reported data derived by a questionnaire similar to the
one in our previous work (Konstantoulas et al., 2020).
The underlying process for sleep quality assessment
is implemented in the SmartWork project using the
PSQI sleep assessment tool. For each user, a gen-
eral sleep quality score is acquired by the received
answers on a number of qualitative and quantitative
questions (Smyth, 1999) (Global PSQI score), with
values between 0 and 21. The 0 value corresponds to
no sleep problems at all, while values equal to 5 or
higher concern a “poor” sleeper. This score is defined
as the sum of 7 different scores (with values between
0 to 3) which are calculated by a unique formula. The
PSQI survey implemented as part of the user profile
initialization interface in SmartWork. The main com-
ponents of the PSQI survey are as follows:
PSQI
C1: Subjective Sleep is based on PSQI ques-
tion #9 which directly links the user’s answers to a
score from 0 to 3.
PSQI
C2: Sleep Latency is based on questions #2
and #5a of PSQI. More specifically, Question #2 cap-
tures the time in minutes the user needs to fall asleep,
while question #5a refers to how often the user was
unable to fall asleep within 30 minutes of lying-in
bed. The final score for this component is the aver-
age of the 2 questions.
PSQI
C3: Sleep Duration captures the upper per-
ceived amounts of hours of sleep each night (
PSQI
#4
).
PSQI C4: Habitual Sleep Efficiency calculates the
total hours in bed as the ratio of bedtime (
PSQI #1
) to
wake time (
PSQI #3
), then total hours of sleep (
PSQI
#4
) to calculate total rest time.
hours of sleep
time in bed
100% (1)
PSQI
C5: Sleep Disturbance denotes the number of
sleep disturbances in a week level. The final score is
derived by summing up the individual scores assigned
to each of the questions from #5b to #55j.
PSQI
C6: Use of Sleep Medication represents the
user’s assessment on how often they need medication
to fall asleep.
PSQI
C7: Daytime Dysfunction. The user reports
mid-day sleepiness (
PSQI #7
) and general enthusi-
asm about activities (
PSQI #8
). The score for this
component is the average one acquired from PSQI
questions #7 and #8.
In the following subsection, the automatic sleep
scores estimation will be presented.
Sleep Quality Monitoring with Human Assisted Corrections
437

2.2.3 Automatic Sleep Scores Estimation
In this section, we present the automatic sleep score
estimation made by an objective viewpoint. Know-
ing that objectivity may be not the best approach for
wellness optimization of the user, in the next section
we present the intervention-based feedback system
for correcting the objective benchmark values (objec-
tive in the sense that these mark values are backed
by usual healthy estimates of researchers in the lit-
erature) (Knudsen et al., 2007)(Smyth, 1999)(Hir-
shkowitz et al., 2015)(
˚
Akerstedt et al., 2002).
During the lifetime of a person, sleep duration
fluctuates and it is highly affected by their age. To im-
plement the proper guidance or intervention systems
towards enhancement of sleep quality, internationally
established recommendations, such as the Sleep Du-
ration Recommendations established by the National
Sleep Foundation (Hirshkowitz et al., 2015), are con-
sidered. In particular, in the case of SmartWork target
users (office workers aged between 50 and 65 years
old), the expected normal sleep duration is between 7
to 9 hours. Note that, 6 or 10 hours are also as ac-
ceptable. Exploiting the smartwatch device, the sleep
stages are identified and used to estimate, on a daily
level, the total and actual hours of sleep, respectively.
Also, the amount and duration of sleep interruptions
are recorded. Then, relevant scores are assigned to
the collected data, in a similar way as the one adopted
by the user self-reported sleep quality using the PSQI
tool. The automatic sleep quality components are the
following:
Auto
C3: Daily Sleep Duration uses the rec-
ommended sleep duration by medical professionals
(
˚
Akerstedt et al., 2002) as a ground truth. Accord-
ing to the age group a user belongs to and the rec-
ommended sleep duration, minutes deviation (
md
) is
calculated. The formula for scoring is the same as in
the calculation of
PSQI C3
.
if
md
≤ 120 then score =
md
60
if
md
> 120 then score = 2+
md
− 120
360
if score > 3 then score = 3
Auto C4: Habitual Sleep Efficiency (
Auto C4
) is
defined by
pr
as percentile rest over time in bed. Its
formula is based on the
PSQI C4
formula with mini-
mal changes to account for user misconceptions.
if
pr
> 90% then score = 0
if
pr
≥ 60% and
pr
≤ 90% then score = 3−
pr
− 60
10
if
pr
< 60% then score = 3
Auto C5a: Daily Sleep Interruptions (
Auto #5b
)
are calculated in minutes using the data collected by
the smartwatch. We define as
sim
the duration of
sleep interruptions in minutes, overnight, during the
rest time. Its formula is based on matching subject
data to the score they reported that month (
PSQI #5b
)
and may change with a larger data sample and could
be unique to each user.
if
sim
< 20 then score = 0
if
sim
≥ 20 and
sim
< 60 then score =
sim
− 20
40
if
sim
≥ 60 then score = 1+
sim
− 60
60
if score > 3 then score = 3
Auto
C5b: Daily Sleep Interruptions. (
Auto #5b
discrete) As for the absolute number of sleep inter-
ruptions using the data collected by the smartwatch,
si
captures the absolute number of sleep interrup-
tions during time rest overnight. Its formula is based
on matching user-perception of sleep interruptions to
results automatically calculated based on their FitBit
data (as
Auto C5a
).
if
si
< 10 then score = 0
if
si
≥ 10 and
sim
< 20 then score =
sim
− 10
10
if
si
≥ 20 then score = 1+
si
− 20
20
if score > 3 then score = 3
Auto
C7: Daytime Dysfunction. (
Auto C7
). We
define
mds
as the minutes of mid-day sleep events.
These events are classified as mid-day sleep if their
duration is small enough and that are not categorized
as actual secondary actual sleep in a day. The for-
mula is based on aligning the daily data of users with
the self-reports of users for question #7 (
PSQI #7
).
if
mds
< 5 then score =
mds
5
if
mds
> 5 and
mds
≤ 30 then score =
mds
− 5
25
if
mds
> 30 then score = 2+
mds
− 30
30
if score > 3 then score = 3
Auto
C8: Daily Bedtime has no clear analogous
score in the PSQI, thus, we use the answers of ques-
tion #1 (
PSQI #1
) for a “usual” time of reference.
Concerning the bedtime,
bd
represents the deviation
in minutes from the usual bedtime. The usual bed-
time of a user is a composite mean of the last 5 days
SmartWork 2021 - 2nd International Workshop on Smart, Personalized and Age-Friendly Working Environments
438
of sleeping whose contribution is smaller as we move
away from “today”.
if
bd
≤ 240 then score =
bd
120
if
bd
> 240 then score = 2+
bd
− 240
480
if score > 3 then score = 3
Auto
C1: Daily Overall Sleep Quality is calculated
as the average score of
Auto C3
,
Auto C4
,
Auto C5
,
Auto C7
and
Auto C8
. Notice that this component is
compared to the user’s self-reported subjective sleep
quality component of the PSQI (
PSQI C1
) and not the
Global PSQI score.
Automatically Calculated Monthly Scores are de-
rived as mean values of the daily scores.
In the next subsection, we will present the contri-
bution of the current study which is founded in Sec-
tions 2.2.2 and 2.2.3. In particular, the proposed ap-
proach aims to correct the automatically calculated
sleep quality scoring taking into account the user per-
ception.
2.2.4 Human Assisted Corrections
An intervention is triggered for a specific event, such
as a suddenly worse or better sleep quality than usual.
In this intervention, the user is asked if the scoring
was corrected or informed that they could see a doctor
based on the data. Also, the user can decide to bypass
the data and claim that the triggered intervention was
false. Focusing on the latter case, the correction sys-
tem has been implemented for exceptions in the cal-
culation of sleep quality scores. The system corrects
scoring methods based on the user’s feedback in the
moment of the intervention based on their answers in
the PSQI questionnaire each month. The main com-
ponents of the human assisted approach are the fol-
lowing:
Corr
C3: Corrected Daily Sleep Duration. We de-
fine
ard
as the adjusted recommended sleep duration,
rd as the recommended sleep duration,
md
as minutes
deviation from adjusted recommended sleep duration
and
msd
as the median sleep duration which is calcu-
lated as the median of the last 30 days of sleep and
relu, which is a function that sets as 0 any negative
values. The subtraction of
PSQIC3
from
AutoC3
is
divided by 10 to normalize the multiplication of this
modifier with the modified recommendation for sleep,
this is a number we reached after experimentation.
For the corrected score the recommended sleep du-
ration is adjusted as follows.
ard
=
rd
+ (
rd
−
msd
) ·
relu(
AutoC3
−
PSQIC3
)
10
md
= |
sleep duration
−
ard
|
if
md
≤ 120 then score =
md
60
if
md
> 120 then score = 2 +
md
− 120
360
if score > 3 then score = 3
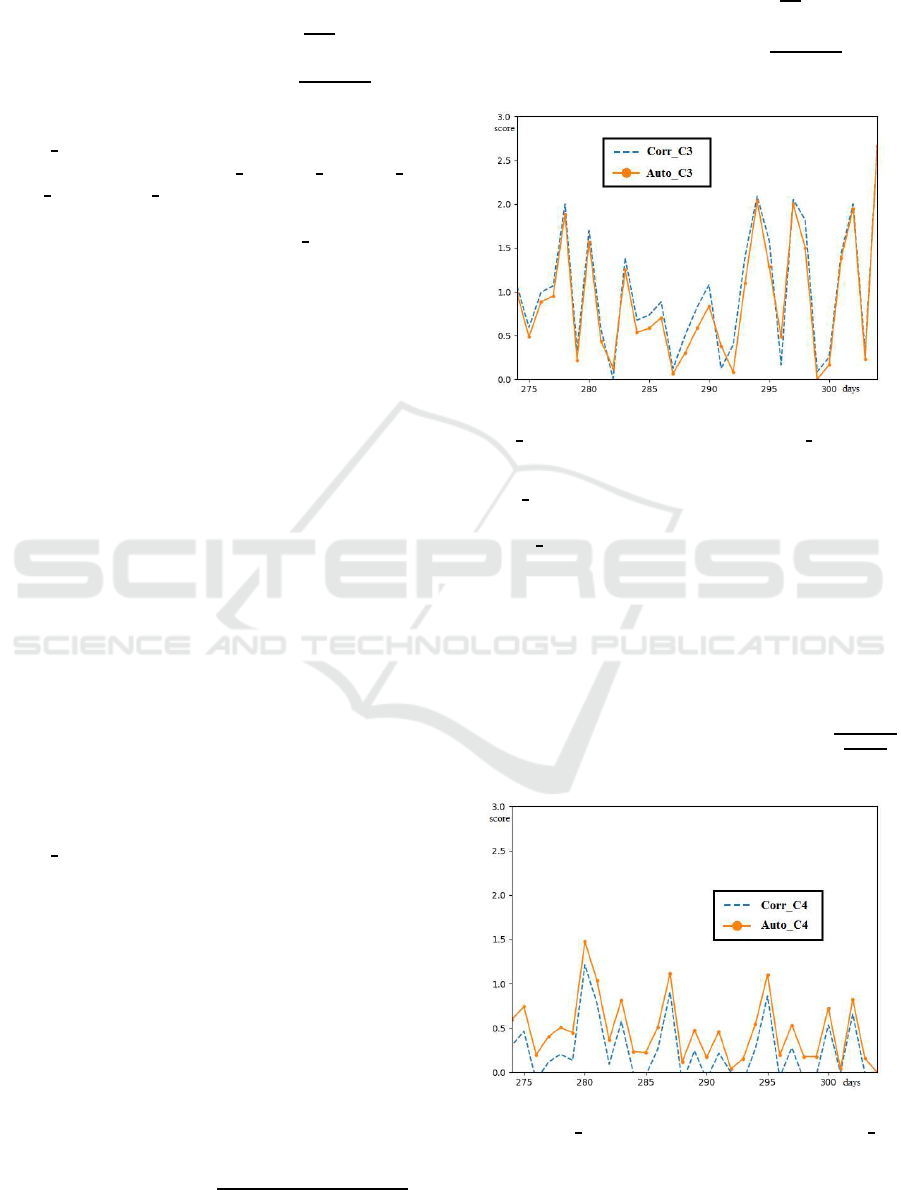
Figure 2: Sleep duration score automatically calculated
(
Auto C3
) and user-assisted correction (
Corr C3
) over 31
days.
Corr
C4: Habitual Sleep Efficiency. We define
hm
as the high mark of scoring and
lm
as the low mark, as
in
Auto C4
we define
pr
as percentile rest over time
in bed, and all relevant calculations are done the same
way, except scoring is calculated as follows.
hm
= 90+ 3 ∗ (
PSQIC4
−
AutoC4
)
lm
= 60+ 12 ∗ (
PSQIC4
−
AutoC4
)
if
pr
>
hm
% then score = 0
if
pr
≥
lm
% and
pr
≤
hm
% then score = 3−
pr
−
lm
hm
−
lm
3
if score > 3 then score = 3
Figure 3: Habitual sleep efficiency score automatically cal-
culated (
Auto C4
) and user-assisted correction (
Corr C4
)
over 31 days.
Sleep Quality Monitoring with Human Assisted Corrections
439
Corr C5a: Daily Sleep Interruptions. (minutes)
We define hm as the high mark of scoring and lm as
the low mark, as in
Auto C5
a we define sim as min-
utes of sleep interruptions over nighttime rest.
hm
= 40+ 6 ∗ (
AutoC5a last month
−
PSQI#4
)
lm
= 20+ 6 ∗ (
AutoC5a last month
−
PSQI#4
)
if
sim
<
lm
then score = 0
if
sim
≥
lm
and
sim
<
hm
then score =
sim
−
lm
lm
if
sim
≥
hm
then score = 1+
sim
− (
hm
+
lm
)
hm
+
lm
if score > 3 then score = 3
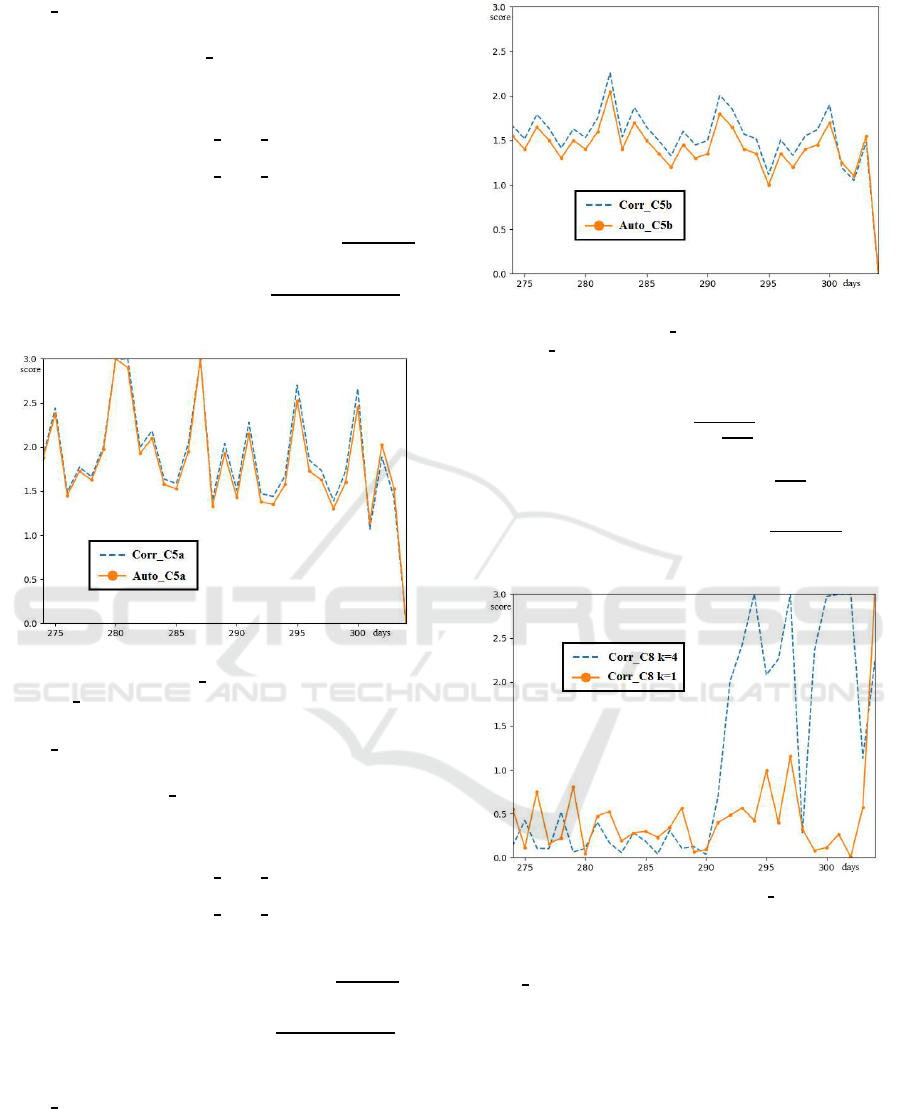
Figure 4: Daily sleep interruptions in minutes score auto-
matically calculated (
Auto C5a
) and user-assisted correc-
tion(
Corr C5b
) over 31 days.
Corr C5b: Daily Sleep Interruptions. (Discrete)
We define
hm
as the high mark of scoring and
lm
as the
low mark, as in
Auto C5b
we define
si
as the number
of sleep interruptions over nighttime rest.
hm
= 20+ 3 ∗ (
AutoC5a last month
−
PSQI#4
)
lm
= 10+ 3 ∗ (
AutoC5a last month
−
PSQI#4
)
if
si
<
lm
then score = 0
if
si
≥
lm
and
si
<
hm
then score =
si
−
lm
lm
if
sim
≥
hm
then score = 1+
si
− (
hm
+
lm
)
hm
+
lm
if score > 3 then score = 3
Corr
C8: Daily Bedtime. For bedtime correction,
we adjust the scale by which we measure usual bed-
time. We use a weighted median of the last k sleep
nights to calculate usual sleep time. We define
ust
as usual sleep time,
st
as sleep time since 00:00 that
day and
bd
as bedtime distance in minutes from usual
sleep time(
ust
) for that day.
Figure 5: Number of daily sleep interruptions score auto-
matically calculated (
Auto C5b
) and user-assisted correc-
tion (
Corr C5b
) over 31 days.
ust
=
∑
α
i
·
st
N ·
N+1
2
if
bd
≤ 240 then score =
bd
120
if
bd
> 240 then score = 2 +
bd
− 240
480
if score > 3 then score = 3
Figure 6: Corrected bedtime score (
Corr C8
) over 31 days,
for k = 1 (number of consecutive previous days attributed
for median bedtime used for calculation) and k = 4.
Corr
C1: Daily Overall Sleep Quality. As total
score is calculated as the median of other scores, to-
tal score for the user assisted corrections is plainly the
median of the individual scores on each of these cate-
gories.
2.2.5 Test Data Set
The test data derived from a volunteer group of office
workers in the age group of 40-55 and, specifically,
in this work in 50-65 group. Due to the dynamic na-
ture of the system, good results are expected in all age
SmartWork 2021 - 2nd International Workshop on Smart, Personalized and Age-Friendly Working Environments
440
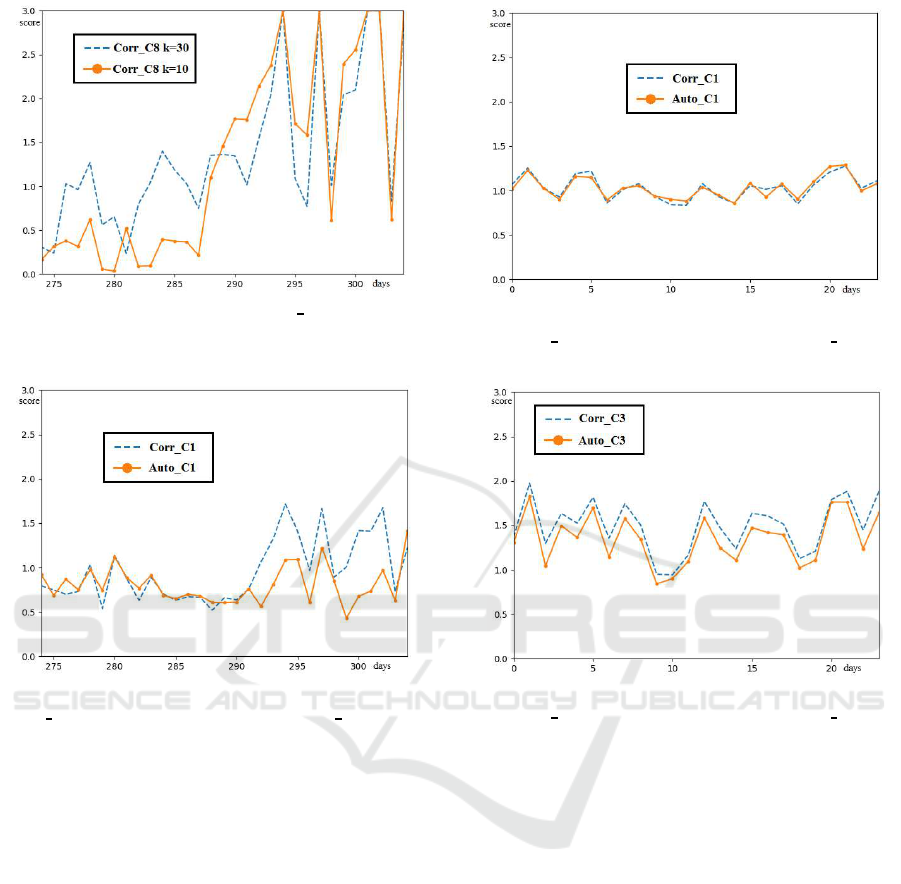
Figure 7: Corrected bedtime score (
Corr C8
) over 31 days,
for k = 10 (number of consecutive previous days attributed
for median bedtime used for calculation) and k = 30.
Figure 8: Total sleep quality score automatically calculated
(
Auto C1
) and user-assisted correction (
Corr C1
) over 31
days.
groups as it is mainly based on perception and infor-
mation of the user on their own health status. Data is
being actively collected in the SmartWork project for
participants in our pilots. The results will be demon-
strated in the next section and concern a user with 2
years data who slept regularly with the smartwatch on
and have completed the PSQI questionnaire for these
years. According to the profile of this user, it is an of-
fice worker, female, aged 46-50, diagnosed with high
cholesterol, mild asthma and allergic rhinitis.
3 RESULTS
Fig. 9 shows the automatically calculated objective
score, compared to that calculated after the user input
that corrects the values. As it is shown, the overall
score for the sleep quality remains mainly the same,
although, in what follows, it is observed that the indi-
vidual corrections in scores vary.
Fig. 10 illustrates the monthly aggregate of sleep
Figure 9: Total sleep quality score automatically calcu-
lated(
Auto C1
) and user-assisted correction(
Corr C1
) over
24 months.
Figure 10: Sleep duration score automatically calcu-
lated(
Auto C3
) and user-assisted correction(
Corr C3
) over
24 months.
duration daily score calculations over a period of two
years. In the figure we can see that the user assisted
corrected score is worse than the previous objectively
calculated one, as the user reports worse sleep than is
objectively calculated.
Fig. 11 depicts the habitual sleep efficiency score
calculations over a period of two years. We can see
in the figure that the correction scores better than
the non-corrected one, the reason is the user reports
very good sleep efficiency even though the objective
data calculate it worse, we can assume either that the
smartwatch is miscalculating interruptions or sleep
times, or that the user is satisfied with their sleep effi-
ciency regardless of the objective qualification of their
sleep efficiency.
Figs. 12 and 13 show sleep interruption score ag-
gregates over a period of two years for automatically
calculated and corrected values. For months the user
reports more interruptions and months that user re-
ports less interruptions we can see the corrected cal-
culations vary based on that.
Sleep Quality Monitoring with Human Assisted Corrections
441
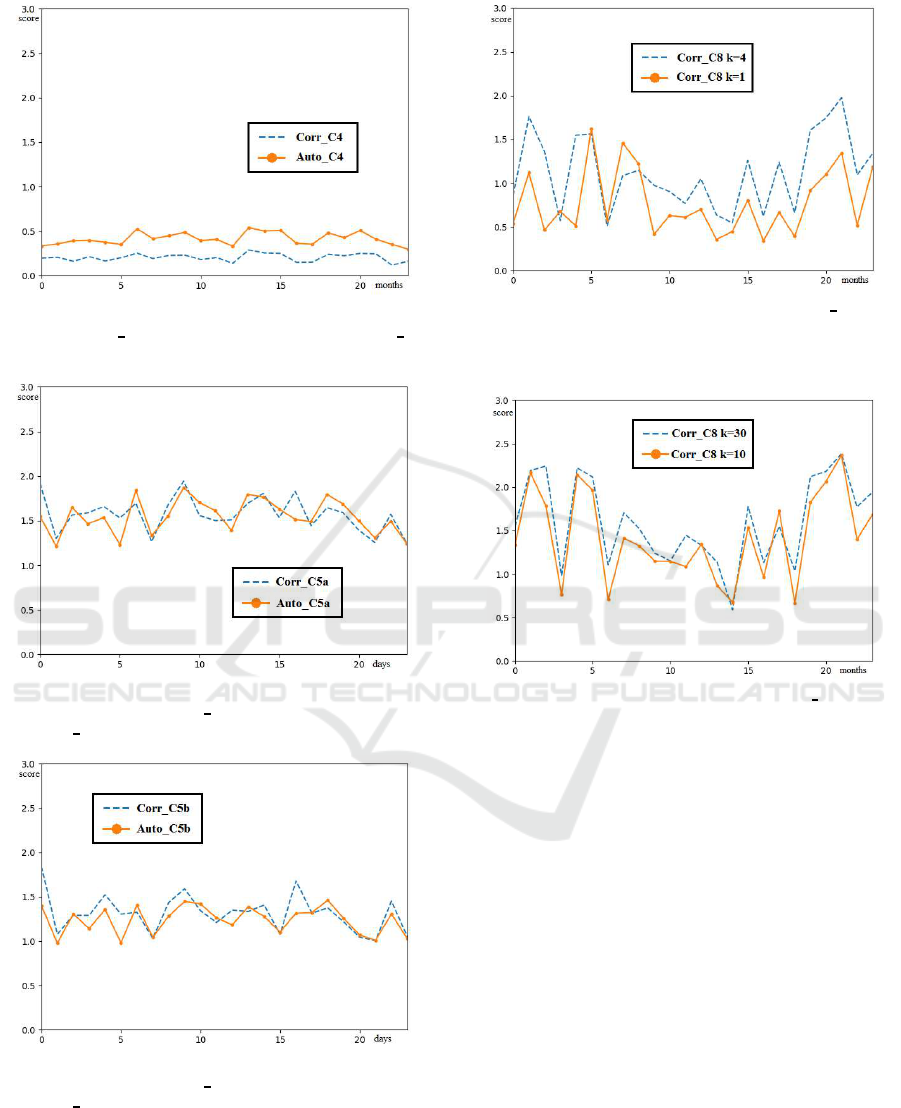
Figure 11: Habitual sleep efficiency score automatically
calculated(
Auto C4
) and user-assisted correction(
Corr C4
)
over 24 months.
Figure 12: Daily sleep interruptions in minutes score au-
tomatically calculated(
Auto C5a
) and user-assisted correc-
tion(
Corr C5b
) over 24 months.
Figure 13: Number of daily sleep interruptions score au-
tomatically calculated(
Auto C5b
) and user-assisted correc-
tion(
Corr C5b
) over 24 months.
Figs. 14 and 15 display bedtime score aggregates
over a period of two years for automatically calcu-
lated and corrected values. The correction for these
scores is calculated based on the usual sleep time of
Figure 14: Daily corrected bedtime score (
Corr C8
) over
24 months, for k = 1 (number of consecutive previous days
attributed for median bedtime used for calculation) and k =
4.
Figure 15: Daily corrected bedtime score (
Corr C8
) over 24
months, for k = 10 (number of consecutive previous days
attributed for median bedtime used for calculation) and k =
30.
the k previous days. From this, we can see that for
k = 1 (versus k = 4) the user scores better, and as
k increases the user’s scores become worse, indicat-
ing that the user has a very unstable sleep schedule,
with little sleep difference from one day to the other.
But, compared to all the previous days, the user sleep
schedule moves a lot.
4 DISCUSSION AND
CONCLUSIONS
An advantage of this approach is that, due to its inte-
gration into the SmartWork system, it can get meta-
data from different datasets, such as dietary prefer-
ences or galvanic skin response from a smart mouse,
that can help in creating a more comprehensive and
holistic system that factors in minor data entries, such
as the user of their daily routine and prior circum-
SmartWork 2021 - 2nd International Workshop on Smart, Personalized and Age-Friendly Working Environments
442

stances, that would be very laborious to factor in a
health professional. A limitation of this work con-
cerns scalability due to the fact that many people dis-
like wearing watches during their sleep, or just dislike
being monitored.
As a future work, our goal is to finalize the inte-
gration and interconnectivity of different datasets to
assist each other. A system that can predict poor or
bad sleep quality at a specific night based on the user
activities that morning or evening it can warn the user
about the habits/activities that contributed to that pre-
diction (e.g., knowing a specific dietary preference
and eating habits of the user that causes bad sleep).
In conclusion, the correction system shows value,
as it can be used by the user more actively and effec-
tively to personalize their sleep monitoring with better
resolution than in our previous work.
ACKNOWLEDGEMENTS
This work has been partially supported by the Smart-
Work project (GA 826343), EU H2020, SC1-DTH-
03-2018 - Adaptive smart working and living envi-
ronments supporting active and healthy ageing.
REFERENCES
˚
Akerstedt, T., Knutsson, A., Westerholm, P., Theorell, T.,
Alfredsson, L., and Kecklund, G. (2002). Sleep distur-
bances, work stress and work hours: a cross-sectional
study. Journal of psychosomatic research, 53(3):741–
748.
Cohen-Zion, M., Stepnowsky, C., Shochat, T., Kripke,
D. F., and Ancoli-Israel, S. (2001). Changes in cogni-
tive function associated with sleep disordered breath-
ing in older people. Journal of the American Geri-
atrics Society, 49(12):1622–1627.
Corral, J., S´anchez-Quiroga, M.-
´
A., Carmona-Bernal, C.,
S´anchez-Armengol,
´
A., de la Torre, A. S., Dur´an-
Cantolla, J., Egea, C. J., Salord, N., Monasterio, C.,
Ter´an, J., et al. (2017). Conventional polysomnog-
raphy is not necessary for the management of most
patients with suspected obstructive sleep apnea. non-
inferiority, randomized controlled trial. American
journal of respiratory and critical care medicine,
196(9):1181–1190. PMID: 28636405.
Eriksen, W., Natvig, B., and Bruusgaard, D. (2001). Sleep
problems: a predictor of long-term work disability? a
four-year prospective study. Scandinavian journal of
public health, 29(1):23–31. PMID: 11355713.
Hirshkowitz, M., Whiton, K., Albert, S. M., Alessi, C.,
Bruni, O., DonCarlos, L., Hazen, N., Herman, J.,
Katz, E. S., Kheirandish-Gozal, L., et al. (2015). Na-
tional sleep foundation’s sleep time duration recom-
mendations: methodology and results summary. Sleep
health, 1(1):40–43.
Hsu, C.-Y., Ahuja, A., Yue, S., Hristov, R., Kabelac, Z.,
and Katabi, D. (2017). Zero-effort in-home sleep and
insomnia monitoring using radio signals. Proceedings
of the ACM on Interactive, mobile, wearable and ubiq-
uitous technologies, 1(3):1–18.
Khusial, R., Honkoop, P., Usmani, O., Soares, M., Biddis-
combe, M., Meah, S., Bonini, M., Lalas, A., Koop-
mans, J., Snoeck-Stroband, J., et al. (2019). myair-
coach: mhealth assisted self-management in patients
with uncontrolled asthma, a randomized control trial.
Knudsen, H. K., Ducharme, L. J., and Roman, P. M. (2007).
Job stress and poor sleep quality: data from an amer-
ican sample of full-time workers. Social science &
medicine, 64(10):1997–2007.
Kocsis, O., Moustakas, K., Fakotakis, N., Vassiliou, C.,
Toska, A., Vanderheiden, G. C., Stergiou, A., Amaxi-
latis, D., Pardal, A., Quintas, J., et al. (2019). Smart-
work: designing a smart age-friendly living and work-
ing environment for office workers. In Proceedings
of the 12th ACM International Conference on PErva-
sive Technologies Related to Assistive Environments,
pages 435–441.
Kocsis, O., Vasilopoulou, M., Tsopanoglou, A., Papaioan-
nou, A., and Vogiatzis, I. (2015). Telemonitoring
system for home rehabilitation of patients with copd.
In 2015 E-Health and Bioengineering Conference
(EHB), pages 1–4. IEEE.
Konstantoulas, I., Kocsis, O., Fakotakis, N., and Moustakas,
K. (2020). An approach for continuous sleep qual-
ity monitoring integrated in the smartwork system.
In 2020 IEEE International Conference on Bioinfor-
matics and Biomedicine (BIBM), pages 1968–1971.
IEEE.
Lian, Y., Xiao, J., Liu, Y., Ning, L., Guan, S., Ge, H., Li,
F., and Liu, J. (2015). Associations between insom-
nia, sleep duration and poor work ability. Journal of
psychosomatic research, 78(1):45–51.
Lucena, L., Polesel, D. N., Poyares, D., Bittencourt, L., An-
dersen, M. L., Tufik, S., and Hachul, H. (2020). The
association of insomnia and quality of life: Sao paulo
epidemiologic sleep study (episono). Sleep health,
6(5):629–635.
Mporas, I., Efstathiou, A., and Megalooikonomou, V.
(2015). Improving sleep stage classification from
electroencephalographic signals by fusion of contex-
tual information. In 2015 IEEE 15th International
Conference on Bioinformatics and Bioengineering
(BIBE), pages 1–4. IEEE.
Mporas, I., Korvesis, P., Zacharaki, E. I., and Mega-
looikonomou, V. (2013). Sleep spindle detection in
eeg signals combining hmms and svms. In Inter-
national Conference on Engineering Applications of
Neural Networks, pages 138–145. Springer.
Nakamura, T., Goverdovsky, V., Morrell, M. J., and
Mandic, D. P. (2017). Automatic sleep monitoring us-
ing ear-eeg. IEEE journal of translational engineering
in health and medicine, 5:1–8.
Nebes, R. D., Buysse, D. J., Halligan, E. M., Houck, P. R.,
Sleep Quality Monitoring with Human Assisted Corrections
443

and Monk, T. H. (2009). Self-reported sleep qual-
ity predicts poor cognitive performance in healthy
older adults. The Journals of Gerontology: Series B,
64(2):180–187.
ROEHRS, T., ZORICK, F., SICKLESTEEL, J., ROTH, T.,
and WITTIG, R. (1983). Age-related sleep—wake
disorders at a sleep disorder center. Journal of the
American Geriatrics Society, 31(6):364–370.
Smith, M. T. and Wegener, S. T. (2003). Measures of sleep:
the insomnia severity index, medical outcomes study
(mos) sleep scale, pittsburgh sleep diary (psd), and
pittsburgh sleep quality index (psqi). Arthritis Care
& Research: Official Journal of the American College
of Rheumatology, 49(S5):S184–S196.
Smyth, C. (1999). The pittsburgh sleep quality index (psqi).
SmartWork 2021 - 2nd International Workshop on Smart, Personalized and Age-Friendly Working Environments
444
