
Low-invasive Neurophysiological Evaluation of Human Emotional
State on Teleworkers
Vincenzo Ronca
1,2 a
, Gianluca Di Flumeri
2,3
, Andrea Giorgi
2
, Alessia Vozzi
1,2
, Pietro Aricò
2,3
,
Nicolina Sciaraffa
2,3
, Luca Tamborra
1,2,4
, Ilaria Simonetti
1,2,4
, Antonello Di Florio
2
,
Fabio Babiloni
2,3,5
and Gianluca Borghini
2,3
1
Department of Anatomical, Histological, Forensic and Orthopaedic Sciences, Sapienza University, Rome 00185, Italy
2
BrainSigns srl, Rome 00185, Italy
3
Department of Molecular Medicine, Sapienza University of Rome, Rome 00185, Italy
4
People Advisory Services Department, Ernst & Young, Rome 00187, Italy
5
Department of Computer Science, Hangzhou Dianzi University, Hangzhou, China
{vincenzo.ronca, gianluca.diflumeri, alessia.vozzi, pietro.arico, nicolina.sciaraffa, luca.tamborra, ilaria.simonetti,
Keywords: Facial Video, Neurophysiological Assessment, Signal Processing, Heart Rate, Electrodermal Activity,
Emotional State Evaluation.
Abstract: Human emotions decoding and assessment is a hot research topic since its implications would be relevant in
a huge set of clinical and social applications. Current emotion recognition and evaluation approaches are
usually based on interactions between a “patient” and a “specialist”. However, this methodology is
intrinsically affected by subjective biases and lack of objectiveness. Recent advancements in neuroscience
enable the use of traditional biosensors and maybe commercial wearable devices, which lead to a certain grade
of invasiveness for the subject. The proposed study explored an innovative low-invasive hybrid method, based
on the use of video data and smart bracelet, to overcome such technological limitations. In particular, we
investigated the capability of an Emotional Index (EI), computed by combining the Heart Rate (HR) and the
Skin Conductance Level (SCL) estimated through video-based and wearable technology, in discriminating
Positive and Negative emotional state during interactive webcalls. The results revealed that the computed EI
significantly increased during the Positive condition compared to the Negative one (p = 0.0008) and the
Baseline (p = 0.003). Such evidences were confirmed by the subjective data and the classification performance
parameters. In this regard, the EI discriminated between two emotional states with an accuracy of 79.4%.
1 INTRODUCTION
The wide field of emotion recognition and emotion
evaluation is approached through different
methodologies. The present work is related to the
neurophysiological characterization of the emotional
state. In this regard, different works widely explored
the emotional state evaluation through the
computation of an Emotional Index (EI) (Vecchiato
et al., 2014), deriving information from the Heart
Rate (HR), usually extracted from the
Electrocardiographic (ECG) or
Photoplethysmographic (PPG) signals, and the Skin
Conductance Level (SCL), one of the two component
of the Electrodermal Activity (EDA). In this context,
a
https://orcid.org/0000-0002-7174-6331
the emotional state was evaluated both in one
(Bustamante, Lopez Celani, Perez, & Quintero
Montoya, 2015; Samadiani et al., 2020) and in two
dimensions (Brouwer, van Dam, van Erp, Spangler,
& Brooks, 2018; Guo et al., 2016; Moharreri,
Dabanloo, & Maghooli, 2018). In particular, the
neurophysiological changes associated to the
emotional state were evaluated in terms of valence
and arousal. Regarding the unidimensional emotional
state evaluation, Ho Choi and colleagues (Choi et al.,
2017) proposed a method to discriminate between
positive and negative states in a controlled
environment through the HR and Heart Rate
Variability (HRV) analysis, while Vecchiato and
colleagues successfully explored the bidimensional
Ronca, V., Di Flumeri, G., Giorgi, A., Vozzi, A., Aricò, P., Sciaraffa, N., Tamborra, L., Simonetti, I., Di Florio, A., Babiloni, F. and Borghini, G.
Low-invasive Neurophysiological Evaluation of Human Emotional State on Teleworkers.
DOI: 10.5220/0010726700003063
In Proceedings of the 13th International Joint Conference on Computational Intelligence (IJCCI 2021), pages 427-434
ISBN: 978-989-758-534-0; ISSN: 2184-3236
Copyright © 2023 by SCITEPRESS – Science and Technology Publications, Lda. Under CC license (CC BY-NC-ND 4.0)
427

emotional state evaluation during TV commercials
through the EDA and PPG signals analysis
(Vecchiato et al., 2014).
However, these works required the physical
contact between the sensors and the participants. In
scientific literature, different studies were conducted
by using professional and laboratory devices, such as
the Shimmer GSR3+ (Fiorini, Mancioppi, Semeraro,
Fujita, & Cavallo, 2020; Giorgi et al., 2021; Girardi,
Lanubile, & Novielli, 2018; Laureanti et al., 2020) or
the Biopac BSL-HOME (Flagler, Tong, Allison, &
Wilcox, 2020; Villar, Viñas, Turiel, Carlos Fraile
Marinero, & Gordaliza, 2020) for the EDA and PPG
measurements, or more commercial wearable
devices, such as the Empatica E4 (Giorgi et al., 2021;
Ragot, Martin, Em, Pallamin, & Diverrez, 2018). The
present study explored an innovative approach in this
assessing the reliability of a partial video-based EI
evaluation, computed by combining the HR, remotely
evaluated through the participant’s face video
analysis, and the SCL evaluated through a wearable
device, the Empatica E4. The video-based
methodology for the HR evaluation does not require
any physical contact between the sensor and the
participants, as it does not require any technical
support to manage the signal collection. The proposed
methodology for HR evaluation was already explored
in prior works with promising results (Borghini et al.,
2020; Rahman, Ahmed, & Begum, 2020; Rahman,
Uddin Ahmed, Begum, & Funk, n.d.; Ronca et al.,
2021), and it is based on the modulation of the
reflected ambient light from the skin by the
absorption spectrum of haemoglobin in the
participant’s blood (Rahman et al., 2017). In other
words, such analysis is based on the extraction and
processing of the Red component of the participant’s
facial video. The minute - colour variations on the
skin are created by blood circulation, and they module
the Red component of the video signal along the time.
In particular, this video-based methodology was
already assessed in terms of reliability in telemedicine
and mental workload evaluation (Ronca et al., 2021,
2020), and it could gain great potential in emotional
state evaluation context, especially in real-world
applications (Samadiani et al., 2020). This
methodology is also compliant with social distancing
practices and scenarios in which the physical contacts
between people must be avoided or mitigated, such as
in health emergency situations (Robb et al., 2020), as
well as in applications where some non-contact user’s
monitoring systems could improve safety (e.g.
measuring the stress of a car driver, in fact some
modern cars are already equipped with interior
cameras to monitor driver’s ocular behaviour (Di
Flumeri et al., 2018; Ji & Yang, 2002). In summary,
the present work aimed at addressing the following
experimental question:
• Is the considered video-based EI capable of
discriminating between a Positive and a Negative
emotional state?
2 MATERIAL AND METHODS
2.1 Participants
The informed consent for study participation,
publication of images, and to use the video material
were obtained from a group of 14 students, seven
males and seven females (30.2 ± 3.3 years old) from
the Sapienza University of Rome (Italy) after the
description of the study. The experiments were
conducted following the principles outlined in the
Declaration of Helsinki of 1975, as revised in 2000.
The study protocol received the ethical board
approval by the Ethical Committee of the Sapienza
University of Rome (protocol n. 2507/2020 approved
on the 04/08/2020). The study involved only healthy
participants, recruited on a voluntary basis.
Furthermore, the students were free to accept or not
to take part to the experimental protocol, and all of
them have accepted to participate to the study. Only
aggregate information will be presented while no
individual information were or will be diffused in any
form.
2.2 Experimental Protocol
To elicit two different emotional levels during the
experimental protocol, two interactive web calls
(WEB) were performed by the participants with the
support of one experimenter. The calls consisted in
three conditions: i) Baseline condition, in which the
participants looked at the web platform interface
without reacting; ii) Positive condition, in which the
participants were asked to report the most positive
memory of their life; iii) Negative condition, in which
the test persons were asked to report the most
negative memory of their life.
The Positive condition of the task was always
performed before the Negative one to avoid transients
due to strong negative memories. The Baseline lasted
60 seconds, while the other two conditions lasted 120
seconds.
The experimental protocol also included other
two tasks, i.e. the n-Back and the Doctor Game tasks,
which were included in the presented study
SmartWork 2021 - 2nd International Workshop on Smart, Personalized and Age-Friendly Working Environments
428
exclusively for the classification procedure. More
details are provided in Classification performance
evaluation sub-paragraph.
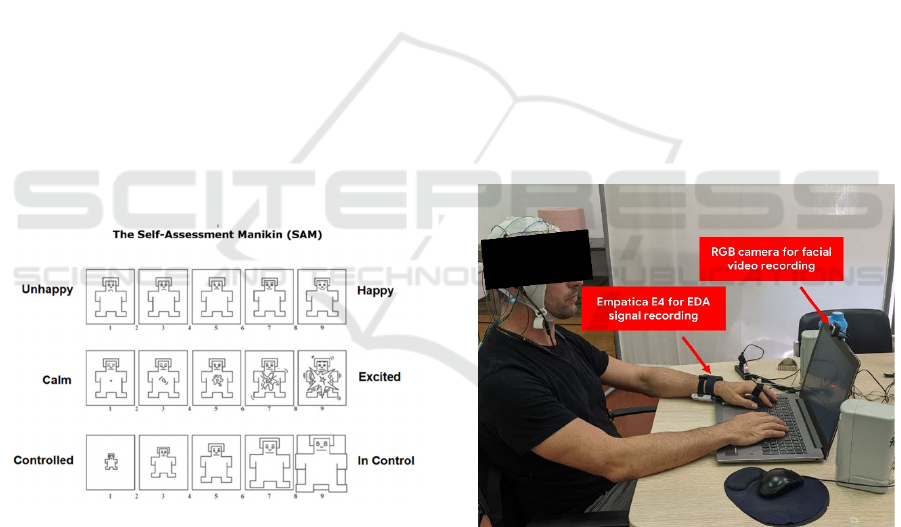
2.2.1 Subjective Data: SAM Questionnaire
In order to validate EI computed by the
neurophysiological data, the Self-Assessment
Manikin (SAM) questionnaire (Lang, Bradley, &
Cuthbert, 2008) was included in the experimental
protocol. The SAM consists in a picture-oriented
(Figure 1) questionnaire specifically developed to
measure three parameters: i) the valence/pleasure
(from unhappy to happy); ii) the perceived arousal
(from calm to excited) and iii) the perceptions of
dominance/control (from low to high levels)
associated with a person's emotional reaction to a
variety of stimuli. In particular, the participants were
asked to fill the SAM after each experimental
condition (Baseline, Positive, and Negative). by
providing three simple responses along each
emotional dimension (on a scale from 1 to 9) that best
described how they felt during the condition just
executed. This questionnaire was selected to have a
subjective indication about the current state of the
participants in terms of pleasure, arousal and control
with the respect of each experimental condition of
WEB task (Bynion & Feldner, 2017).
Figure 1: The Self-Assessment Manikin questionnaire.
2.2.2 Heart Activity Recording and Analysis
The HR was estimated by means of the video – based
methodology. The participant’s facial video was
recorded through a PC webcam placed in front of the
participant (Figure 2). The RGB camera was set to a
resolution of 640 × 480 (pixel) at a frame rate of 30
(fps). and the video was analysed offline. Firstly, 68
visual facial feature required for the facial recognition
were identified using the Dlib Python library (King,
2009) coupled with the adaBoost classifier (Yu, Yun,
Chen, & Cheng, 2018). The classifier performed the
facial recognition and it was based on the YCbCr
Color model (King, 2009). This model is capable of
performing facial features identification according
with the luminance and chrominance variations of the
video. Secondly, the Fast Fourier Transform (FFT)
was used to select and extract the Red (R) component
from the raw signal, while the Principal Component
Analysis (PCA) was also applied for fluctuations
removal from the R component, technically
implemented in the sklearn.decomposition.PCA
Python library included in the Scikit-Learn Python
library (“sklearn.decomposition.PCA — scikit-learn
0.23.1 documentation,” 2014). The considered signal
was collected within the participant’s cheeks frame
by frame and referenced to the participant’s eyes and
nose (Rahman et al., n.d.). Then, the R component
was detrended using the method proposed by
Tarvainen (Tarvainen, Ranta-aho, & Karjalainen,
2002). Subsequently, Hamming filtering (128 point,
0.6 – 2.2 Hz) was applied to the R detrended
component. Finally, the z-score normalization was
applied on the filtered signal (Tarvainen et al., 2002).
The HR values were computed every 60 seconds for
each experimental condition. The main steps of the
described video - signal processing for HR estimation
are presented in Figure 3.
Figure 2: Overview of the experimental settings. The
Empatica E4 was placed on the participant's wrist while the
RGB camera in front of the participant. Other acquisition
devices were present although they were not used for the
purposes of this study.
Low-invasive Neurophysiological Evaluation of Human Emotional State on Teleworkers
429
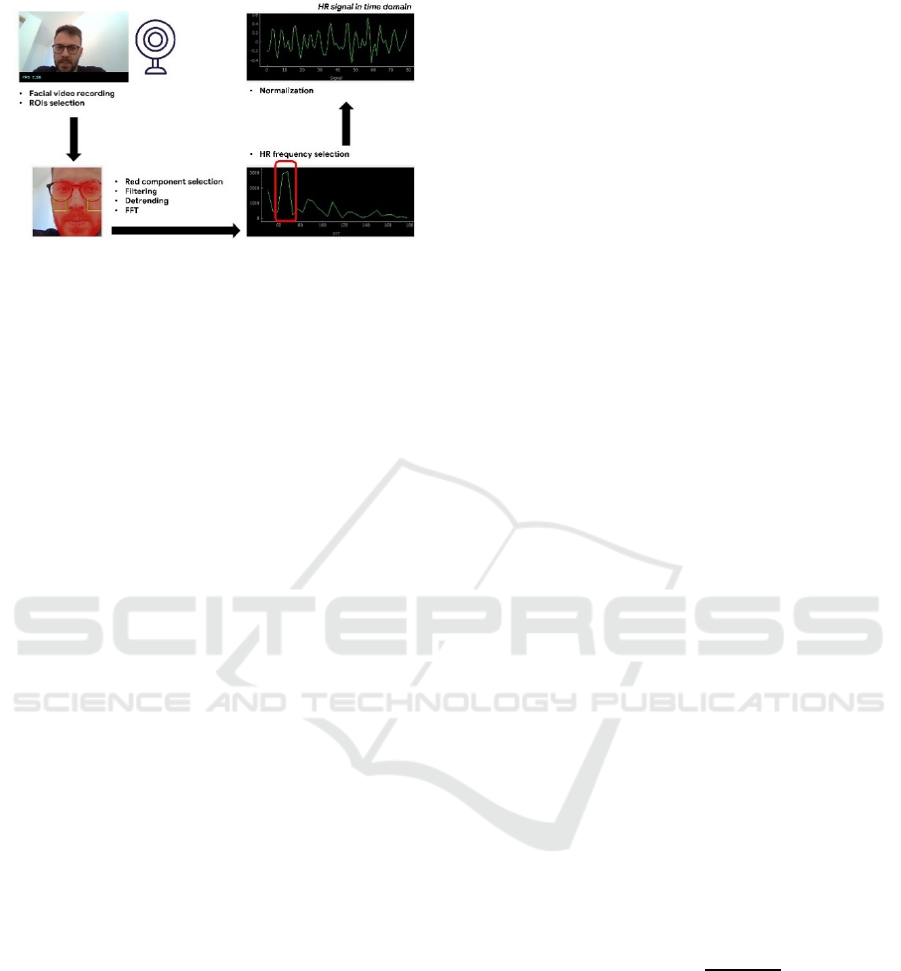
Figure 3: Main steps of the video-signal processing for
heart rate (HR) estimation. Starting from the bottom left,
the facial video is recorded by mean of a PC webcam and
the regions of interest (ROIs) are selected. Then, the R, G
and B components are selected by mean of Principal
Component Analysis (PCA) algorithm. The Heart Rate
(HR) frequency is extracted after detrending, filtering and
fast Fourier transformation. Finally, the HR values in time
domain are obtained after z-score normalization.
2.2.3 EDA Recording and Analysis
The EDA was recorded employing the Empatica E4
(Empatica, Milan, Italy) wearable device, with the
sampling frequency of 4 (Hz). The Empatica E4 was
placed on the participant’s wrist, according to the
position of the two electrodes, placed on the bottom
part of the wrist. The EDA was firstly low-pass
filtered with a cut-off frequency of 1 (Hz) and then
processed by using the Ledalab suite (Bach, 2014), a
specific open-source toolbox implemented within
MATLAB environment for EDA processing. Then
the SCL component was extracted from the EDA. As
described by Vecchiato et al. (Vecchiato et al., 2014),
this component is associated with the the activity of
the sweat glands on the hands and, therefore, with the
participant’s arousal (Gatti, Calzolari, Maggioni, &
Obrist, 2018; Wang et al., 2018). The SCL, as well as
the HR parameter, was evaluated as the average
within each experimental condition.
2.2.4 Emotional Index
Subsequently, the HR and SCL parameters were
combined to compute a synthetical index for the
emotional state evaluation. In particular, an
Emotional Index (EI) was defined as follows
(Vecchiato et al., 2014):
𝐸𝐼 = |𝑆𝐶𝐿
|∗𝐻𝑅
(1)
where SCL
mad
and HR
mad
are the mad-normalised
(Kappal, 2019) values of the SCL and HR,
respectively, averaged within the considered
experimental conditions.
2.2.5 Statistical Analysis
The Shapiro–Wilk test was used to assess the
normality of the distributions related to each of the
considered neurophysiological parameters. In case of
normal distribution, Student’s t-test would have been
performed to pairwise compare the conditions (e.g.,
‘Positive vs. Negative’). In case of non-normal
distribution, the Wilcoxon signed-rank test was
performed. For all tests, statistical significance was
set at α = 0.05.
2.2.6 Classification Performance Evaluation
In order to assess the efficiency of the proposed EI in
discriminating between the two elicited emotional
state, i.e. Positive and Negative, the classification
performance were computed. First, a threshold
related to the EI was computed for each participant
within all the tasks designed in the experimental
protocol, including the other two experimental tasks
and excluding the Positive and Negative conditions of
the WEB task, as follows (Hernández-Orallo & Flach
PETERFLACH, 2012):
𝑇ℎ𝑟𝑒𝑠ℎ𝑜𝑙𝑑 = 𝑚𝑒𝑑𝑖𝑎𝑛
𝑋
(2)
where, the X was the distribution of the EI averaged
within all the tasks.
Secondly, the classification capability of the EI
during the WEB task was evaluated by computing
three parameters:
• Classification sensitivity, defined as the
proportion of true Positive conditions that are
correctly identified. This parameter refers to the
ability of the method in terms of correct detection
of a specific condition on the tested distribution.
For example, in clinical context the sensitivity of
a test is the ability in to correctly classifying an
individual as “diseased”. The sensitivity was
calculated as follows:
𝑆𝑒𝑛𝑠𝑖𝑡𝑖𝑣𝑖𝑡𝑦 =
𝑇𝑃
𝑇𝑃 + 𝐹𝑁
(3)
• Classification specificity, defined as the
proportion of true Negative conditions that are
correctly identified. This parameter tells how well
the classification method predicts the true
negative case. In other words, high specificity
means a low rate of false positive. For example, in
clinical context the specificity of a test is the
ability in correctly classifying an individual as
disease-free. The specificity was calculated as
follows:
SmartWork 2021 - 2nd International Workshop on Smart, Personalized and Age-Friendly Working Environments
430
𝑆𝑝𝑒𝑐𝑖𝑓𝑖𝑐𝑖𝑡𝑦 =
𝑇𝑁
𝑇𝑁 + 𝐹𝑃
(4)
• Classification accuracy, defined as the fraction of
the correct predictions on the total number of
predictions. This parameter combines both the
sensitivity and the specificity. Therefore, the
accuracy can provide more general information
about the classification performance than the
abovementioned parameters. The accuracy was
calculated as follows:
𝐴
𝑐𝑐 =
𝑇𝑃 + 𝑇𝑁
𝑇𝑃+𝑇𝑁+𝐹𝑃+𝐹𝑁
(5)
The three above presented classification performance
parameters were selected according with the perfect
balance between the two classes, i.e. Positive and
Negative, in terms of presentation frequency within
the experimental task (Gupta, Rawal, Narasimhan, &
Shiwani, 2017).
3 RESULTS
3.1 Subjective Results
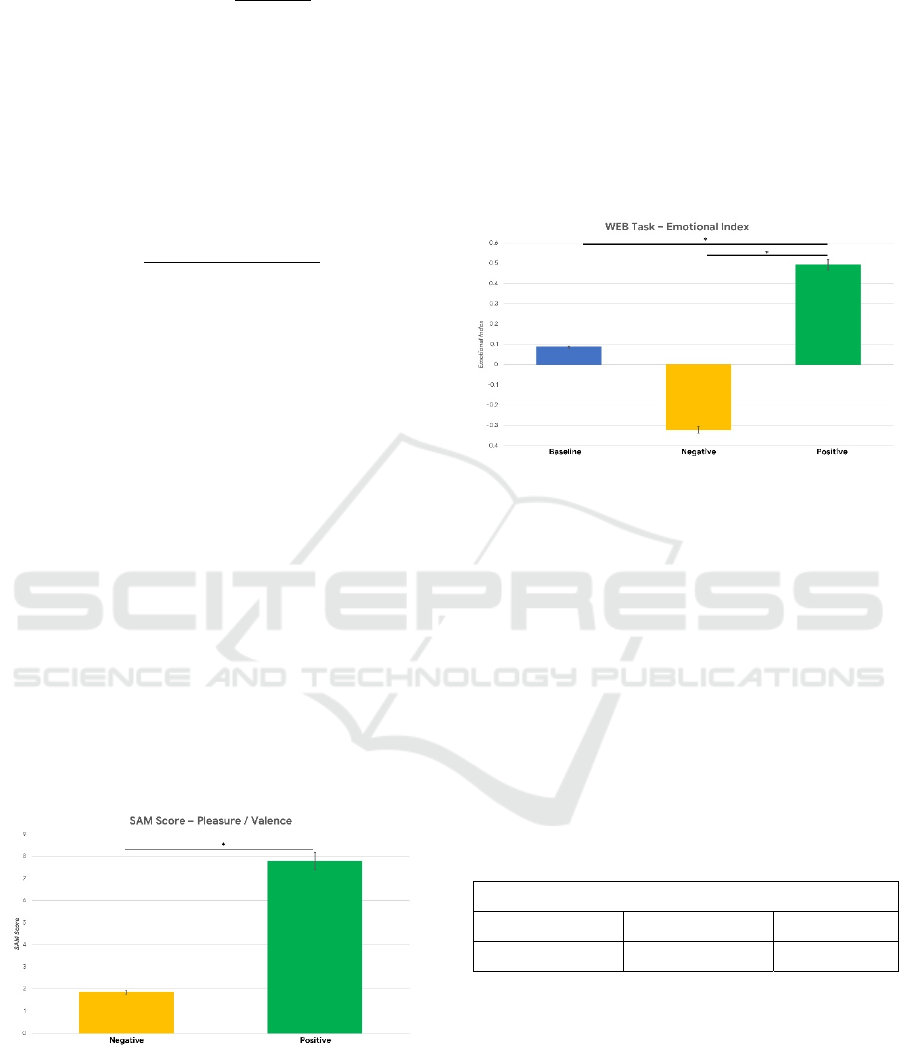
The Wilcoxon signed-rank test performed on the
SAM score showed a significant increase in terms of
valence during the Positive condition of the WEB
task compared to the Negative one (p = 0.003). The
SAM score in terms of dominance and perceived
arousal did not significantly differ (SAM dominance:
p = 0.5; SAM perceived arousal: p = 0.6) between the
Positive and Negative conditions of the WEB task
(Figure 4).
Figure 4: The average SAM Score in terms of Pleasure /
Valence during the Negative (yellow bar) and the Positive
(green bar) conditions of the Webcall (WEB) task. *
indicates a statistical difference between the represented
parameter.
3.2 Emotional State Evaluation
The Wilcoxon signed-rank test performed on the EI
estimated during the WEB task revealed a significant
increase of the index during the Positive condition
compared to the Negative one (p = 0.0008) and the
Baseline (p = 0.003). The EI evaluated during the
Negative condition did not statistically differ from the
one evaluated during the Baseline ( p = 0.1) (Figure
5).
Figure 5: The average Emotional Index (EI) during the
Baseline (blue bar), the Negative (yellow bar) and the
Positive (green bar) conditions of the WEB task. * indicates
a statistical difference between the represented parameter.
3.3 Classification Results
The classification performance parameters, i.e. the
Sensitivity, Specificity and the Accuracy, were
evaluated within the two experimental conditions
(Positive and Negative) of the WEB task. The Table
1 presents such classification performance
parameters.
Table 1: Classification performance parameters describing
how the Emotional Index (EI) discriminated between the
Positive and the Negative conditions of the Webcall (WEB)
task.
Classification Parameter
S
ensitivity
S
pecificity Accuracy
86.2% 72.7% 79
,
4%
4 DISCUSSION
The presented results revealed that the proposed EI
permitted to correctly discriminate between the
Positive and Negative conditions of the WEB task.
Furthermore, the statistical analysis demonstrated
that the proposed EI was significantly higher during
the Positive condition compared to the Negative one
Low-invasive Neurophysiological Evaluation of Human Emotional State on Teleworkers
431

and the Baseline, while no significant differences
were found in terms of EI between the Negative
condition and the Baseline. These evidences are
supported by the subjective measures, i.e. the SAM
questionnaire, which demonstrated that the Positive
and Negative conditions of the WEB task were
actually different in terms of perceived pleasure and
valence.
Although the promising results, there are some
limitations to be discussed. Supporting this, it can be
observed in Table 1 how the proposed partial video-
based EI was more capable in discriminating the true
Positive conditions than the true Negative ones. Even
if the classification parameters demonstrated the
general reliability of the proposed EI, since they were
all above 72%, the Specificity was lower than the
Sensitivity, revealing that the proposed EI was more
sensitive to the Positive conditions than the Negative
ones, as it can be derived by observing Equations (3)
and (4). This could be explained by the fact that the
Negative condition of the WEB task was not
sufficiently well-designed for eliciting a measurable
neurophysiological change in the participant’s
emotional states, especially because of the interaction
with a non-familiar person during the simulated
webcall. It can be argued that it was easier for the
participants speaking about happy and positive
memories, while negative memories may often be
very private. Future works will be directed to better
investigate such an aspect, possibly designing more
structured Negative experimental conditions. The
proposed EI was only partially video-based, since the
SCL was gathered by mean of the Empatica E4
wearable device. In this regard, further studies will
aim at exploring the video-based methodology in
estimating other neurophysiological parameters, such
as the respiration rate, which could lead to a full
video-based EI (Hameed, Sabir, Fadhel, Al-Shamma,
& Alzubaidi, 2019; Kantono et al., 2019).
The presented results are consistent with prior
works (Cartocci et al., 2017; Ragot et al., 2018;
Zupan, Buskas, Altimiras, & Keeling, 2016) and they
pave the way for applying the video-based
methodology for the neurophysiological parameters
evaluation, already successfully explored in mental
workload estimation and telemonitoring applications
(Ronca et al., 2021, 2020), also in emotional states
evaluation.
5 CONCLUSIONS
The presented study explored the reliability of a very
low-invasive approach to evaluate the emotional state
of participants while performing a simulated working
task. This approach was based on the evaluation of
the participant’s SCL through the Empatica E4, a
wearable and portable device, and the participant’s
HR, evaluated through an innovative and contactless
methodology based on the video analysis.
The promising results permit to hypothesize a
further development of the proposed low-invasive
methodologies. In particular, a remote approach will
be explored to evaluate neurophysiological
parameters positively correlated with the SCL, such
as the respiration rate, to compute a full-contactless
tool to evaluate the emotional status.
REFERENCES
Bach, D. R. (2014). A head-to-head comparison of
SCRalyze and Ledalab, two model-based methods for
skin conductance analysis. Biological Psychology,
103(1), 63–68. https://doi.org/10.1016/
j.biopsycho.2014.08.006
Borghini, G., Bandini, A., Orlandi, S., Di Flumeri, G.,
Arico, P., Sciaraffa, N., Babiloni, F. (2020). Stress
Assessment by Combining Neurophysiological Signals
and Radio Communications of Air Traffic Controllers.
Proceedings of the Annual International Conference of
the IEEE Engineering in Medicine and Biology Society,
EMBS, 2020-July, 851–854. https://doi.org/10.1109/
EMBC44109.2020.9175958
Brouwer, A.-M., van Dam, E., van Erp, J. B. F., Spangler,
D. P., & Brooks, J. R. (2018). Improving Real-Life
Estimates of Emotion Based on Heart Rate: A
Perspective on Taking Metabolic Heart Rate Into
Account. Frontiers in Human Neuroscience, 12, 284.
https://doi.org/10.3389/fnhum.2018.00284
Bustamante, P. A., Lopez Celani, N. M., Perez, M. E., &
Quintero Montoya, O. L. (2015). Recognition and
regionalization of emotions in the arousal-valence
plane. Proceedings of the Annual International
Conference of the IEEE Engineering in Medicine and
Biology Society, EMBS, 2015-Novem, 6042–6045.
https:// doi.org/10.1109/EMBC.2015.7319769
Bynion, T.-M., & Feldner, M. T. (2017). Self-Assessment
Manikin. In Encyclopedia of Personality and Individual
Differences (pp. 1–3). https://doi.org/10.1007/978-3-
319-28099-8_77-1
Cartocci, G., Caratù, M., Modica, E., Maglione, A. G.,
Rossi, D., Cherubino, P., & Babiloni, F. (2017).
Electroencephalographic, Heart Rate, and Galvanic
Skin Response Assessment for an Advertising
Perception Study: Application to Antismoking Public
Service Announcements. Journal of Visualized
Experiments: JoVE, (126).
Choi, K. H., Kim, J., Kwon, O. S., Kim, M. J., Ryu, Y. H.,
& Park, J. E. (2017). Is heart rate variability (HRV) an
adequate tool for evaluating human emotions? – A
focus on the use of the International Affective Picture
SmartWork 2021 - 2nd International Workshop on Smart, Personalized and Age-Friendly Working Environments
432

System (IAPS). Psychiatry Research, 251, 192–196.
https://doi.org/10.1016/j.psychres.2017.02.025
Di Flumeri, G., Borghini, G., Aricò, P., Sciaraffa, N., Lanzi,
P., Pozzi, S., … Babiloni, F. (2018). EEG-Based
Mental Workload Neurometric to Evaluate the Impact
of Different Traffic and Road Conditions in Real
Driving Settings. Frontiers in Human Neuroscience,
12, 509. https://doi.org/10.3389/fnhum.2018.00509
Fiorini, L., Mancioppi, G., Semeraro, F., Fujita, H., &
Cavallo, F. (2020). Unsupervised emotional state
classification through physiological parameters for
social robotics applications. Knowledge-Based
Systems, 190, 105217. https://doi.org/10.1016/
j.knosys.2019.105217
Flagler, T., Tong, J., Allison, R. S., & Wilcox, L. M. (2020).
Validity Testing the NeuLog Galvanic Skin Response
Device. IEEE Transactions on Systems, Man, and
Cybernetics: Systems, 2020-Octob, 3964–3968.
https://doi.org/10.1109/ SMC42975.2020.9283465
Gatti, E., Calzolari, E., Maggioni, E., & Obrist, M. (2018).
Data Descriptor: Emotional ratings and skin
conductance response to visual, auditory and haptic
stimuli. Scientific Data, 5(1), 1–12. https://doi.org/
10.1038/sdata.2018.120
Giorgi, A., Ronca, V., Vozzi, A., Sciaraffa, N., di Florio,
A., Tamborra, L., … Borghini, G. (2021). Wearable
Technologies for Mental Workload, Stress, and
Emotional State Assessment during Working-Like
Tasks: A Comparison with Laboratory Technologies.
Sensors, 21(7), 2332. https://doi.org/10.3390/
s21072332
Girardi, D., Lanubile, F., & Novielli, N. (2018). Emotion
detection using noninvasive low cost sensors. 2017 7th
International Conference on Affective Computing and
Intelligent Interaction, ACII 2017, 2018-Janua, 125–
130. https://doi.org/10.1109/ACII.2017.8273589
Guo, H. W., Huang, Y. S., Lin, C. H., Chien, J. C.,
Haraikawa, K., & Shieh, J. S. (2016). Heart Rate
Variability Signal Features for Emotion Recognition by
Using Principal Component Analysis and Support
Vectors Machine. Proceedings - 2016 IEEE 16th
International Conference on Bioinformatics and
Bioengineering, BIBE 2016, 274–277. https://
doi.org/10.1109/BIBE.2016.40
Gupta, N., Rawal, A., Narasimhan, V. L., & Shiwani, S.
(n.d.). Accuracy, Sensitivity and Specificity
Measurement of Various Classification Techniques on
Healthcare Data.
Hameed, R. A., Sabir, M. K., Fadhel, M. A., Al-Shamma,
O., & Alzubaidi, L. (2019). Human emotion
classification based on respiration signal. ACM
International Conference Proceeding Series, 239–245.
https://doi.org/10.1145/3321289.3321315
Hernández-Orallo, J., & Flach PETERFLACH, P. (2012).
A Unified View of Performance Metrics: Translating
Threshold Choice into Expected Classification Loss C`
esar Ferri. In Journal of Machine Learning Research
(Vol. 13).
Ji, Q., & Yang, X. (2002). Real-time eye, gaze, and face
pose tracking for monitoring driver vigilance. Real-
Time Imaging, 8(5), 357–377. https://doi.org/10.1006/
rtim.2002.0279
Kantono, K., Hamid, N., Shepherd, D., Lin, Y. H. T.,
Skiredj, S., & Carr, B. T. (2019). Emotional and
electrophysiological measures correlate to flavour
perception in the presence of music. Physiology and
Behavior, 199, 154–164. https://doi.org/10.1016/
j.physbeh.2018.11.012
Kappal, S. (2019). Data Normalization using Median &
Median Absolute Deviation (MMAD) based Z-Score for
Robust Predictions vs. Min-Max Normalization.
King, D. E. (2009). Dlib-ml: A Machine Learning Toolkit.
In Journal of Machine Learning Research (Vol. 10).
Lang, P., Bradley, M., & Cuthbert, B. (2008). International
affective picture system (IAPS): Affective ratings of
pictures and instruction manual.
Laureanti, R., Bilucaglia, M., Zito, M., Circi, R., Fici, A.,
Rivetti, F., Russo, V. (2020). Emotion assessment using
Machine Learning and low-cost wearable devices.
Proceedings of the Annual International Conference of
the IEEE Engineering in Medicine and Biology Society,
EMBS, 2020-July, 576–579. https://doi.org/10.1109/
EMBC44109.2020.9175221
Moharreri, S., Dabanloo, N. J., & Maghooli, K. (2018).
Modeling the 2D space of emotions based on the
poincare plot of heart rate variability signal.
Biocybernetics and Biomedical Engineering, 38(4),
794–809. https://doi.org/10.1016/j.bbe.2018.07.001
Ragot, M., Martin, N., Em, S., Pallamin, N., & Diverrez, J.
M. (2018). Emotion recognition using physiological
signals: Laboratory vs. wearable sensors. Advances in
Intelligent Systems and Computing, 608, 15–22. https://
doi.org/10.1007/978-3-319-60639-2_2
Rahman, H., Ahmed, M. U., & Begum, S. (2020). Non-
Contact Physiological Parameters Extraction Using
Facial Video Considering Illumination, Motion,
Movement and Vibration. IEEE Transactions on
Biomedical Engineering, 67(1), 88–98. https://doi.org/
10.1109/TBME.2019.2908349
Rahman, H., Uddin Ahmed, M., Begum, S., & Funk, P.
(n.d.). Real Time Heart Rate Monitoring From Facial
RGB Color Video Using Webcam. Retrieved from
http://stressmedicin.se/neuro-psykofysilogiska-
matsystem/cstress-
Robb, C. E., de Jager, C. A., Ahmadi-Abhari, S.,
Giannakopoulou, P., Udeh-Momoh, C., McKeand, J.,
Middleton, L. (2020). Associations of Social Isolation
with Anxiety and Depression During the Early COVID-
19 Pandemic: A Survey of Older Adults in London,
UK. Frontiers in Psychiatry, 11. https://doi.org/
10.3389/fpsyt.2020.591120
Ronca, V., Giorgi, A., Rossi, D., Di Florio, A., Di Flumeri,
G., Aricò, P., … Borghini, G. (2021). A Video-Based
Technique for Heart Rate and Eye Blinks Rate
Estimation: A Potential Solution for Telemonitoring
and Remote Healthcare. Sensors, 21(5), 1607. https://
doi.org/10.3390/s21051607
Ronca, V., Rossi, D., Di Florio, A., Di Flumeri, G., Aricò,
P., Sciaraffa, N., … Borghini, G. (2020). Contactless
Physiological Assessment of Mental Workload During
Low-invasive Neurophysiological Evaluation of Human Emotional State on Teleworkers
433

Teleworking-like Task. Communications in Computer
and Information Science, 1318, 76–86. https://
doi.org/10.1007/978-3-030-62302-9_5
Samadiani, N., Huang, G., Luo, W., Chi, C.-H., Shu, Y.,
Wang, R., & Kocaturk, T. (2020). A multiple feature
fusion framework for video emotion recognition in the
wild. Concurrency and Computation: Practice and
Experience, e5764. https://doi.org/10.1002/cpe.5764
sklearn.decomposition.PCA — scikit-learn 0.23.1
documentation. (n.d.). Retrieved June 10, 2020, from
https://scikit-learn.org/stable/modules/
generated/sklearn.decomposition.PCA.html
Tarvainen, M. P., Ranta-aho, P. O., & Karjalainen, P. A.
(2002). An advanced detrending method with
application to HRV analysis. IEEE Transactions on
Biomedical Engineering, 49(2), 172–175. https://
doi.org/10.1109/ 10.979357
Vecchiato, G., Cherubino, P., Maglione, A. G., Ezquierro,
M. T. H., Marinozzi, F., Bini, F., … Babiloni, F. (2014).
How to Measure Cerebral Correlates of Emotions in
Marketing Relevant Tasks. Cognitive Computation,
6(4), 856–871. https://doi.org/10.1007/s12559-014-
9304-x
Villar, B. F., Viñas, P. F., Turiel, J. P., Carlos Fraile
Marinero, J., & Gordaliza, A. (2020). Influence on the
user’s emotional state of the graphic complexity level
in virtual therapies based on a robot-assisted neuro-
rehabilitation platform. Computer Methods and
Programs in Biomedicine, 190, 105359. https://doi.org/
10.1016/j.cmpb.2020.105359
Wang, C. A., Baird, T., Huang, J., Coutinho, J. D., Brien,
D. C., & Munoz, D. P. (2018). Arousal Effects on Pupil
Size, Heart Rate, and Skin Conductance in an
Emotional Face Task. Frontiers in Neurology, 9, 1029.
https:// doi.org/10.3389/fneur.2018.01029
Yu, M., Yun, L., Chen, Z., & Cheng, F. (2018). Research
on video face detection based on AdaBoost algorithm
training classifier. 1st International Conference on
Electronics Instrumentation and Information Systems,
EIIS 2017, 2018-Janua, 1–6. https://doi.org/10.1109/
EIIS.2017.8298627
Zupan, M., Buskas, J., Altimiras, J., & Keeling, L. J.
(2016). Assessing positive emotional states in dogs
using heart rate and heart rate variability. Physiology
and Behavior, 155, 102–111. https://doi.org/10.1016/
j.physbeh.2015.11.027
SmartWork 2021 - 2nd International Workshop on Smart, Personalized and Age-Friendly Working Environments
434
