
Smar tWork: An IoT Enabled Unobtrusive Worker Health, Well-being
and Functional Ability Monitoring Framework
Dimitrios Amaxilatis
1 a
, Nikolaos Tsironis
1
, George Papoulias
2
, Dennis Hofs
3
, Rita Kovordanyi
4 b
,
Hugo Marcos
5 c
, Jo
˜
ao Jord
˜
ao
5 d
and Jo
˜
ao Quintas
5 e
1
SparkWorks ITC Ltd, Derbyshire, DE11 8HS, U.K.
2
Department of Electrical and Computer Engineering, University of Patras, Rion, Greece
3
Roessingh Research and Development, Enschede, The Netherlands
4
Department of Computer and Information Science, Link
¨
oping University, Link
¨
oping, Sweden
5
Instituto Pedro Nunes, Coimbra, Portugal
Keywords:
Office Workers, Internet of Things, Sensor Network, Unobtrusive Sensing.
Abstract:
Staying healthy in our workplaces is one of the most important priorities both for employers and employees,
especially after the recent COVID-19 pandemic. Especially for older workers, that are more vulnerable, not
only due to COVID-19 but also due to their chronic conditions that may be affecting their performance and
productivity. This is more prevalent in western societies where populations are aging and people and govern-
ments start to consider staying at work longer to stay as active members of the society and live independently
in better conditions. In this paper we present the SmartWork software suite that aims at building a worker-
centric Internet of Things enabled system for workability sustainability, integrating unobtrusive sensing and
modeling of the worker state with a suite of novel services for context and worker-aware adaptive work sup-
port. SmartWork is a ready to use, software suite tested in real-world installations that combines off-the-shelf
and novel software and hardware components to provide workers with guidance on how to improve both their
personal and professional lives.
1 INTRODUCTION
Governments and enterprises spend every year a lot
of time, effort, and money to train and increase their
workforce’s abilities, knowledge, and expertise. Life-
long learning is the cornerstone of maintaining the
best performance and highest productivity in any po-
sition either related to high-tech positions or not. If
we include in this picture the aging of the world-
wide population the cost of losing workers due to
early retirement at a time where they have gathered
all this knowledge and experience is extremely high.
Such workers are of high value, if not in their origi-
nal (on the field) positions, at least as consultants or
trainers for younger workers, to facilitate the trans-
a
https://orcid.org/0000-0001-9938-6211
b
https://orcid.org/0000-0003-2801-7050
c
https://orcid.org/0000-0002-7393-9962
d
https://orcid.org/0000-0002-4443-0892
e
https://orcid.org/0000-0002-8513-2664
fer of knowledge and expertise to the younger gen-
erations. Most advanced countries employ strategies
to increase the presence of older employees in work
environments and to reduce the early retirement rates
and unemployment amongst older people. Especially
within the European Union with the employment rate
of 50-64-year-olds reaching only 66% as of 2020
(Commission, 2020) in the 27 member states.
A person can be characterized as an “older
worker” in most cases due to physical changes asso-
ciated with older ages that may have resulted in de-
creased performance in specific physical or mental ac-
tivities, like the decline in vision or hearing, but this
definition does not apply to everyone. Age-related
conditions, such as the ones described above can start
as early as the age of 50 (Liang et al., 2008). Simi-
larly, chronic health conditions are more common in
people aged over 50, especially in the western world,
with almost 50% of the population suffering from
hypertension, high cholesterol, heart disease, mental
398
Amaxilatis, D., Tsironis, N., Papoulias, G., Hofs, D., Kovordanyi, R., Marcos, H., Jordão, J. and Quintas, J.
SmartWork: An IoT Enabled Unobtrusive Worker Health, Well-being and Functional Ability Monitoring Framework.
DOI: 10.5220/0010722800003063
In Proceedings of the 13th International Joint Conference on Computational Intelligence (IJCCI 2021), pages 398-408
ISBN: 978-989-758-534-0; ISSN: 2184-3236
Copyright © 2023 by SCITEPRESS – Science and Technology Publications, Lda. Under CC license (CC BY-NC-ND 4.0)
illness, diabetes, arthritis, back problems or asthma
(Busse and Bl
¨
umel, 2010) mainly due to the office
worker lifestyles followed.
These workers may have diminished performance
in physical activities but as we mentioned before
their knowledge and experience give them an impor-
tant value for their employers. Their younger col-
leagues can benefit from their help in experience-
based tasks and duties (Ortet et al., 2019), thus, keep-
ing these workers around can be of a huge benefit
so that youngers can learn more pragmatically. It
is then of paramount importance to provide work-
ers with an age-friendly working and living environ-
ment through novel technologies such as the Internet
of Things (IoT), body or wearable sensors, artificial
intelligence (AI), and machine learning (ML). Smart-
Work (Kocsis et al., 2019; Amaxilatis et al., 2019)
aims to build such an environment through the uti-
lization of an IoT-enabled unobtrusive and ubiquitous
sensor network that monitors the health and work con-
ditions of workers at all times, provides suggestions
for their performance and safety, and facilitates the
knowledge and experience transfer between workers
of different ages. We base our design on novel, scal-
able and viable architectures, and business models,
using also the feedback from large-scale and multi-
country pilot installations of the system under devel-
opment.
The project created a Worker-Centric AI Sys-
tem for workability sustainability, integrating multi-
ple sensing devices and modeling the worker’s state
with a suite of novel services for context and worker-
aware adaptive work support. The unobtrusive and
pervasive monitoring of the health, behavior, cogni-
tive and emotional status of the worker enables the
functional and cognitive decline risk assessment. To
achieve these goals, our system is built upon existing
reference architectures and well-defined practices es-
pecially in the domain of AAL. Basing our work on
the Reference Architecture for open AAL platforms
of universAAL (which has also been built on exist-
ing solutions from previous AAL projects, e.g., IN-
LIFE) and by adopting extensions to support cloud-
based solutions we can provide a robust, extensible,
and privacy-respecting system. The SmartWork archi-
tecture takes advantage of all the interoperability fea-
tures and capabilities of modern software and hard-
ware solutions towards enabling the seamless integra-
tion of existing or developed web services, applica-
tions, and hardware solutions.
The rest of the paper is structured as follows: In
Section 2 we showcase the SmartWork sensing net-
work architecture. Section 3 provides more infor-
mation on the sensing devices used, the applications
developed and the data collected. In Section 4 we
present the post-collection data processing and ana-
lytics capabilities of our system and in Section 5 we
discuss how the whole system is tested in two real-
world installations. Finally, in Section 7 we present
our conclusions and take-away messages.
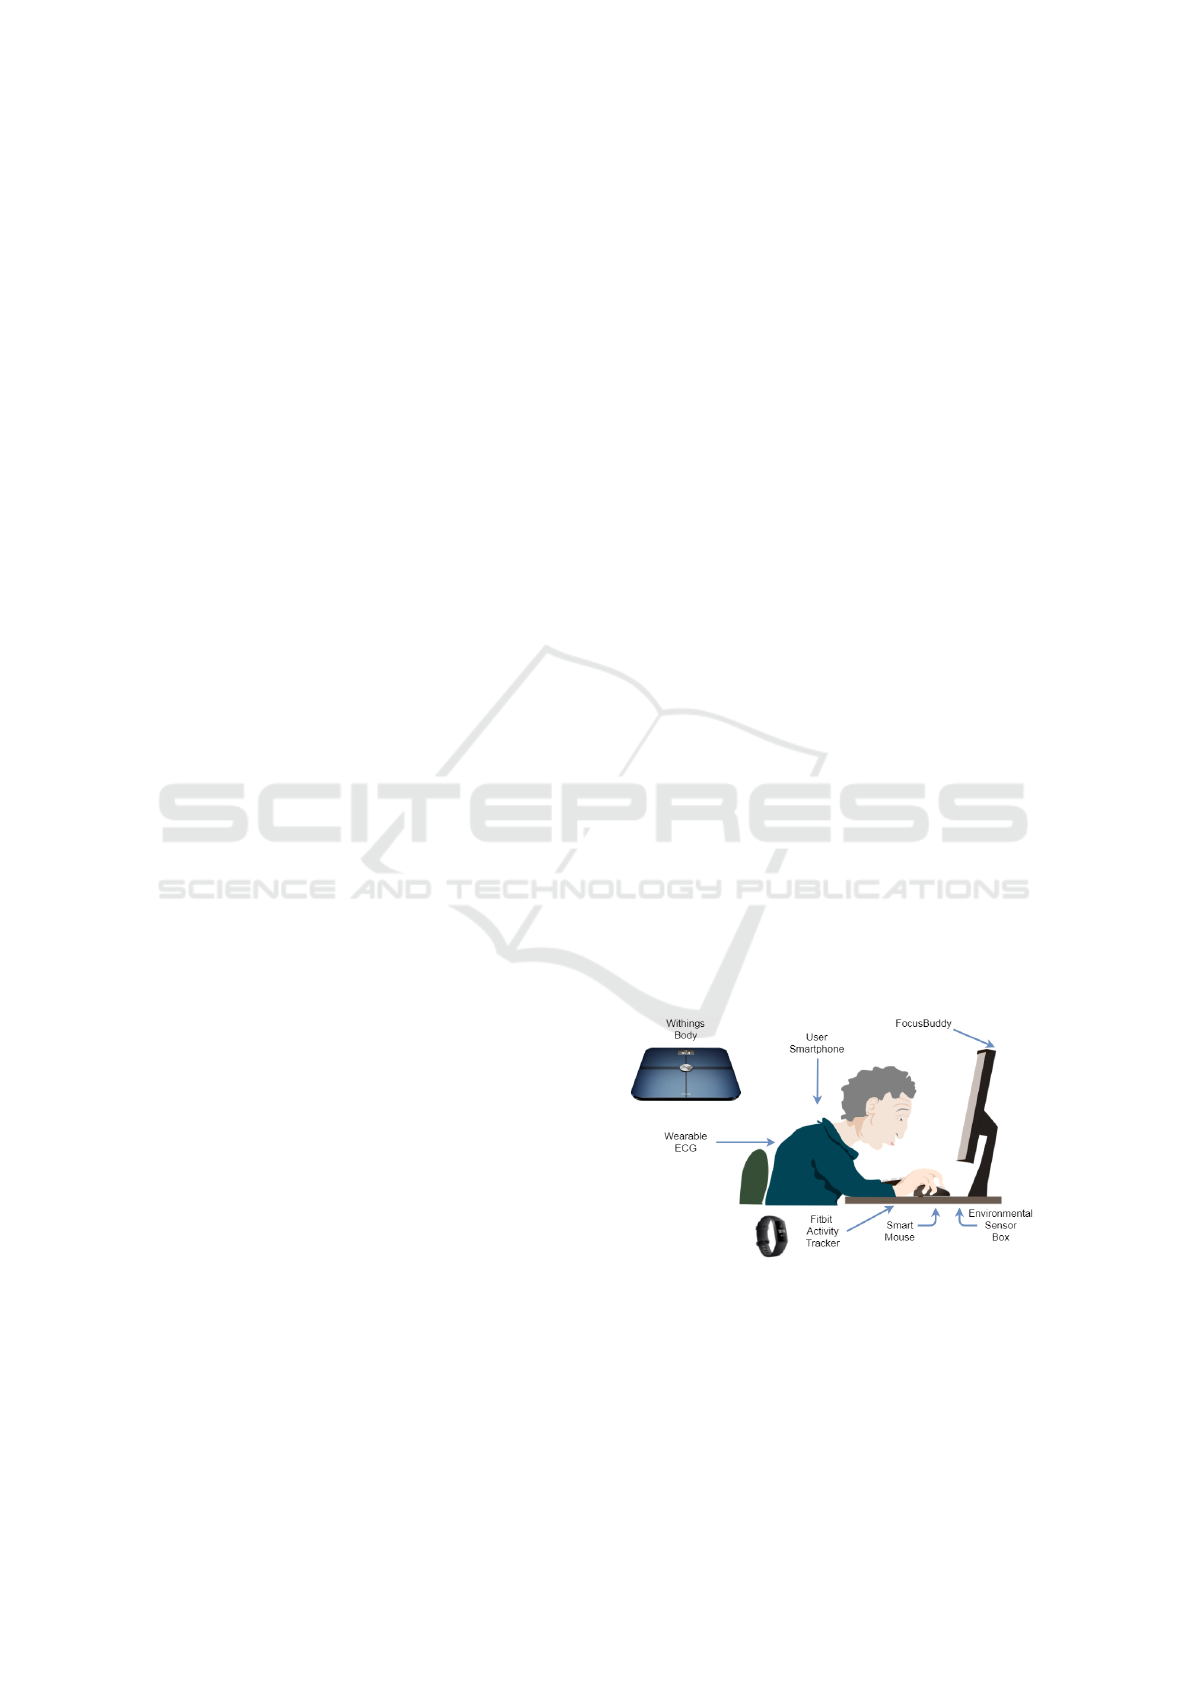
2 SYSTEM ARCHITECTURE
The SmartWork monitoring infrastructure is based on
an unobtrusive IoT-based sensing infrastructure, ei-
ther installed on the workers’ workplace or worn by
them, and a set of software applications installed on
the computer of the workers and their mobile devices.
Each device or application is responsible for measur-
ing a set of characteristics of the workers’ state and
all the data are aggregated in the SmartWork cloud to
generate more detailed insights. Using multiple de-
vices and applications we can adapt our system based
on the needs of each organization that uses it and ex-
tend or modify the set of devices used accordingly.
As discussed before, the worker data collection is
done using both software and hardware. In more de-
tail, in the current version of SmartWork we use the
following components that will be described in more
detail in the next section:
• Smart Mouse
• Withings Scale
• Focusbuddy
• ECG Vest
• Fitbit Activity Tracker
• Environmental Sensor Box
Figure 1: Flow of data in the SmartWork architecture.
Each of these devices collects data independently
and communicates them to the SmartWork infrastruc-
ture for further processing and analysis. The flow of
data collected is presented in Fig. 1. We can observe
two main flows for the collected data. One is from
SmartWork: An IoT Enabled Unobtrusive Worker Health, Well-being and Functional Ability Monitoring Framework
399
the worker’s computer directly to the SmartWork in-
frastructure while the second one uses the proprietary
device’s own infrastructure and APIs as an interme-
diate repository polled periodically by the SmartWork
services to collect any available data. The second flow
is something that cannot be avoided, as the devices do
not offer any direct option to get data (e.g., the FitBit
activity trackers), but shows how our implementation
allows for easy integration of external sources.
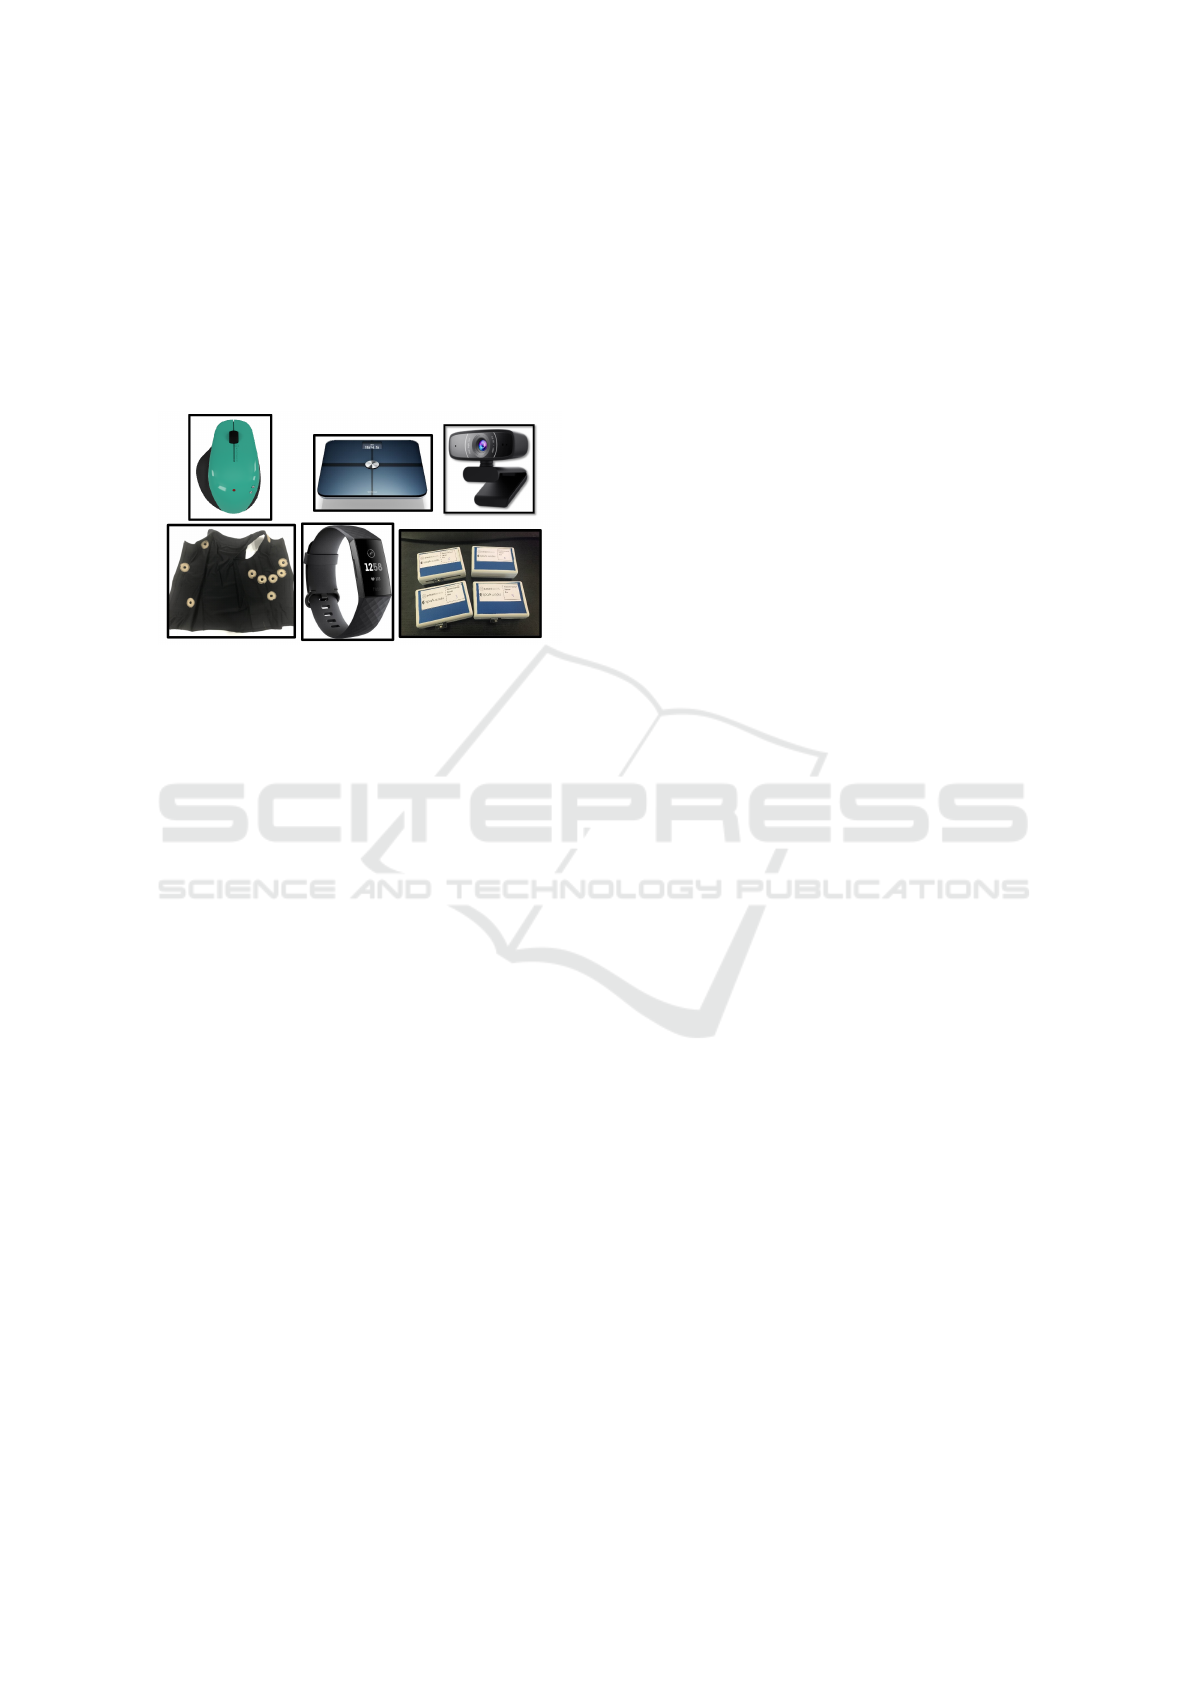
Figure 2: Sensing components of the SmartWork suite.
To efficiently collect, store and process all time-
series data from the IoT devices of the project, Smart-
Work uses internally the SparkWorks IoT Analytics
Engine. It is designed to handle unlimited streams
of data from multiple sources, volumes, and speeds,
as well as multiple formats, convert them into a com-
mon format, and process them as needed by each use
case. More details on the SparkWorks IoT Analytics
Engine will be provided in Section 4. An appropriate
RESTful application programming interface (API) is
available for accessing the raw and processed data of
the sensors as well as the metadata and user-related
information.
Using all the collected data, developers of Smart-
Work are capable of creating useful applications for
workers and employees in the following domains to
build the SmartWork software suite:
• Unobtrusive Sensing at the workplace and on-the-
move, and low-level heterogeneous data process-
ing algorithms for efficient data transmission.
• A Ubiquitous Workplace, allowing for instant
adaptation/personalization and seamless transfer
between home and office environments (Vander-
heiden et al., 2013).
• Modelling and Artificial Intelligence for risk as-
sessment on multiple dimensions, related to the
work ability of the employee.
• On-the-fly Flexibility and on-Demand Train-
ing (Leligou et al., 2019).
• Care Management and Interventions to deliver
health and lifestyle self-management services to
people with chronic conditions.
There are two basic entry points for the Smart-
Work users. The worker’s smartphone and the
worker’s desktop computer. Three applications are
available for both Android and iOS devices: (a)
healthyMe mobile for connecting Fitbit and Withings
accounts and displaying basic fitness-related feedback
and (b) iCare for caretakers of the workers that need
to monitor their health conditions or mental state and
(c) Cardio real-time ECG recordings using the ECG
Vest. On the desktop side the following applications
are available for Windows 10 based computers:
• EnvSerial: for collecting data from the Environ-
mental Sensor Box
• SmartMouse Suite: for collecting and processing
data from the SmartMouse
• FocusBuddy: for collecting gaze tracking data
from the installed webcam and assess worker’s
stress levels
• SmartWork desktop: for offering a central access
point to all SmartWork services
Most of these applications follow the unobtrusive na-
ture of the SmartWork sensing network, meaning that
the user rarely needs to interact with them. EnvSe-
rial, SmartMouse, and FocusBuddy are initially con-
figured and operate in the background, while Smart-
Work desktop is there for users to inspect their col-
lected data, access SmartWork services, receive noti-
fications or suggestions to make their work environ-
ment better (e.g., increase their productivity or reduce
their stress levels). All applications share the same lo-
gin information, stored securely in the worker’s com-
puter (or smartphone) to further simplify access to the
services.
3 SENSING COMPONENTS
In this section, we are going to provide a more de-
tailed description of all the sensing components used
in the SmartWork unobtrusive sensor network, the IoT
devices and the applications used to collect their data.
3.1 Environmental Sensor Box
A USB-powered desktop sensor box is used in Smart-
Work to record the environmental conditions in the
worker’s office. The SensorBox is based on an ex-
tensible hardware design that is capable of measuring
environmental conditions (temperature, relative hu-
midity) and air quality levels, mainly Volatile Organic
SmartWork 2021 - 2nd International Workshop on Smart, Personalized and Age-Friendly Working Environments
400

Compounds that are the main pollutant in indoor en-
vironments.
The sensed data are collected by the EnvSer ial ap-
plication that is running on the worker’s desktop ap-
plication. The data are pre-processed and filtered by
the application and then forwarded to the SmartWork
infrastructure through a dedicated call in the data pro-
cessing API. During the pre-processing, the applica-
tion is also generating additional metrics like the ther-
mal comfort estimate using the predicted mean vote
(PMV) and predicted percentage of dissatisfied (PPD)
metrics (American Society of Heating and condition-
ing Engineers Inc., 2020). The flow of data from
the Environmental Sensor Box devices through the
EnvSerial application and SmartWork is described in
Fig. 3
3.2 SmartMouse
The SmartMouse is an intelligent device that is ca-
pable of measuring several well-being parameters of
the user unobtrusively, fusing the standard pointing
module of a computer mouse with a combination of
commercial and custom-developed sensors. All of the
electronics of the device were encapsulated in a care-
fully developed custom design, having into considera-
tion the feedback obtained from the target users while
using the previous version of the device. This al-
lowed us to create an ergonomic and comfortable de-
vice while providing maximum physical contact be-
tween the user and the array of sensors.
The pointing module of the intelligent mouse is
doted with an RF and Bluetooth transceiver, allow-
ing the device to be connected to different comput-
ers and exchange between them with a single button
press. This approach was also extended to the sensing
module, where the central processing unit (CPU) can
commute between two different Bluetooth devices,
based on the output provided by the pointing mod-
ule. The CPU is responsible not only for the com-
munication between the SmartMouse and the com-
puter but also to interface with the wide range of on-
board sensors present. This includes a Heart-Rate
sensor (HR), an infra-red hand-temperature sensor, a
custom-developed skin-conductance sensor with cus-
tom probes, and an inertial measurement unit (IMU)
to evaluate hand movements. All of the sensors’ raw
data are filtered and processed locally. The gener-
ated information is then forwarded to also custom-
developed mouse algorithms, which are responsible
for outputting accurate measurements of the user’s
well-being indicators. All of the SmartMouses’ units
were fully tested using a custom procedure that uses
robust and calibrated devices to evaluate all of the
sensed parameters. This allowed us to fine-tune
the architecture to improve sensing output, achieving
high accuracy results.
On top of the mouse hardware and firmware de-
velopments, we have also created a software suite, tar-
geted for Windows 10 system, that is installed on the
user’s computer to allow the communication between
the machine and the sensing part of the end-device.
The pointing functionality is assured by the embedded
modules of the Operating System (OS). The Smart-
Mouse software bundle is composed of three main
components, described below:
• A Windows-based service that starts automati-
cally without any external input when the user
logs in on the computer. It is also responsible
for implementing a custom Bluetooth profile to
communicate with the end-device, calculating the
high-level estimations about the emotional state
of the user, and deploying a communication pipe
with the SmartWork infrastructure. The data up-
link between the mouse application and the server
is assured by a RabbitMQ message queue directed
to the SparkWorks IoT Analytics Engine, that pro-
cesses the stream of data and stores it on the re-
spective database.
• A graphical user interface (GUI), where the user
can have a global vision of the data that is being
generated by the mouse while having access to
some configurations for the communication with
the server and also for the application itself.
• A windows back-end application, responsible for
tracking the cursor position on the screen and send
the captured positions to the Windows-service via
inter-process communication (IPC), to be fused
with the remaining data and be fed to the emo-
tional estimation algorithms.
The entire SmartMouse solution, which comprises
both hardware, firmware, and software progress, was
developed taking into account the evolution of tech-
nology and the outputs of the pretrials and trials per-
formed, aiming for a solution that enhances the user’s
productivity and is comfortable and easy to use.
3.3 Web Camera
One of the predictive modules in SmartWork, Focus-
Buddy takes the user’s gaze as well as other data as
input and outputs continuous predictions on the user’s
cognitive state. For gaze tracking, we use Logitech
C270. The software for tracking the user’s eye point
of gaze (EPOG), that is, the point in external space
that the user’s eyes are directed to, was built based
on an open-source library that offers tracking of the
SmartWork: An IoT Enabled Unobtrusive Worker Health, Well-being and Functional Ability Monitoring Framework
401
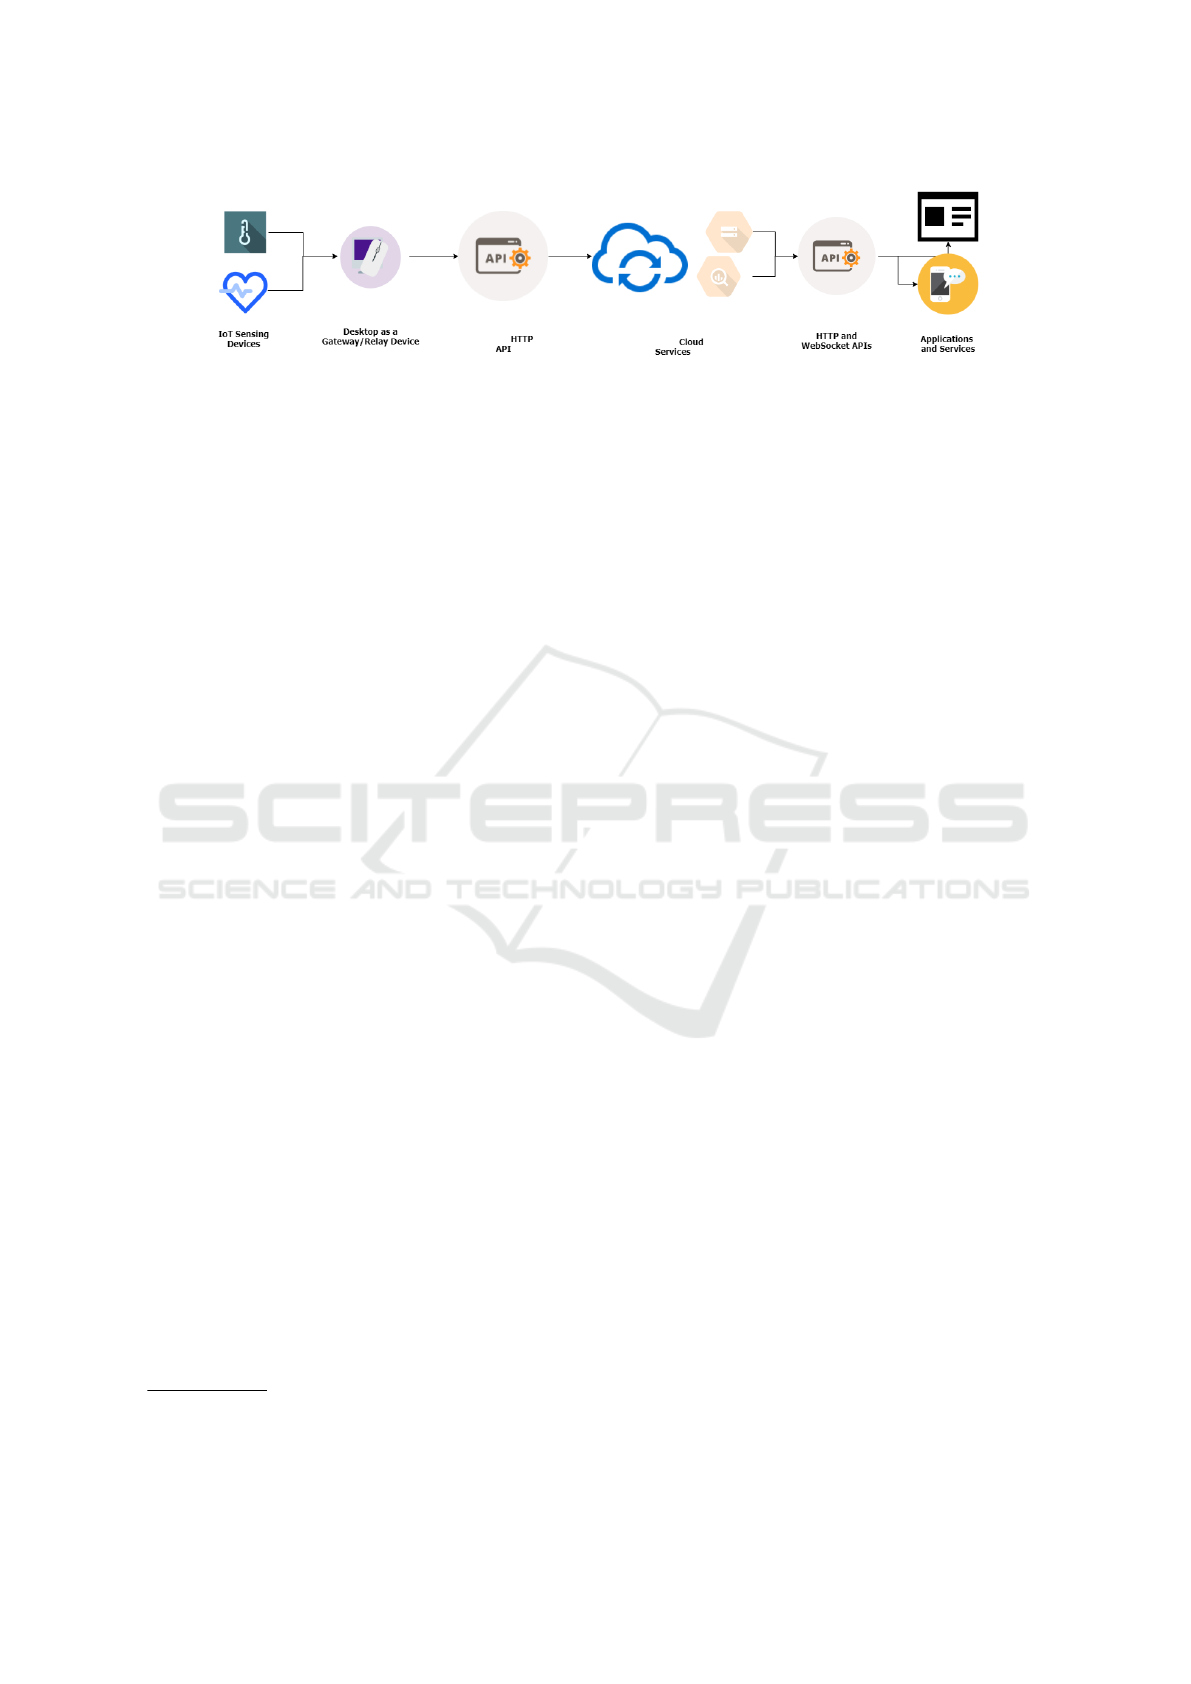
Figure 3: Flow of data from the PC connected IoT sensors and webcam to the SmartWork infrastructure.
user’s eyes (iris) in a webcam image. The library re-
lies on a pre-trained deep-learning model for face and
eye detection. Pupil tracking is accomplished by de-
termining the relative position of the iris within the
eye.
On top of this library, we have developed a soft-
ware for tracking the point were the user is looking on
the computer screen based on the EPOG estimation
1
. This software determines gaze direction and maps
this onto computer screen coordinates with the help
of known calibration points. The viewer’s distance
from the screen can vary, which is compensated for by
adjusting the calibration according to changes in ap-
parent iris size. Estimated EPOG accuracy is around
400 pixels (3-4 cm), when viewing a 15-inch com-
puter screen from 60 cm viewing distance. Changes
in viewing distance are accommodated by observing
corresponding changes in iris size.
3.3.1 FocusBuddy
FocusBuddy is an application that helps the user keep
focus, while at the same time avoiding becoming fa-
tigued, stressed, or overwhelmed by the work tasks.
In more detail, FocusBuddy is a suite of software that
runs on the user’s computer, collecting and analyz-
ing where the user looks on the screen, the user’s
heart rate, which window the user is interacting with,
what mouse actions are performed. Machine learn-
ing, Long Short-Term Memory as a baseline model,
is used to predict the user’s cognitive state, namely
stress level, mental fatigue, mental workload, and
whether the user is focused or distracted. Internally,
FocusBuddy consists of four submodules:
• A sensor part that runs directly on the desktop or
laptop, collecting low-level information, such as
the position of the currently active window, mouse
actions, and so on.
• A locally hosted web app developed in Flutter that
is tightly connected to the sensor part. It interacts
with the user, collecting the users’ input on how
they feel at that particular time
2
. The web app is
1
https://github.com/ritko/GazeTracking
2
https://cseq.herokuapp.com/quest/
also responsible for presenting supporting advice
to the users.
• A remotely hosted backend that produces predic-
tions and handles the business logic of Focus-
Buddy.
• An AI-module, which implements data handling
and model training.
The sensor part collects information in the back-
ground and periodically displays notifications (short-
lived toasts) to the user. Initially, when run in boot-
strap mode, the notifications take the user to a ques-
tionnaire for eliciting their perceived cognitive state.
Subsequently, when run in prediction mode, the noti-
fications display supportive advice based on the user’s
predicted cognitive state. While the Artificial Intelli-
gence (AI) part is responsible for preparing (clean-
ing and normalizing) the collected data and training
the user models, these models are made available for
HTTP-requests by uploading them to the FocusBuddy
backend server. Individual models are maintained for
each user, using only their data. In this way, each user
is served with a personalized model adapted to their
work style and computer activity habits.
3.4 Fitness Trackers
The Fitbit Activity Trackers are be used in Smart-
Work and worn by the workers throughout the day
to collect data about their physical activities. The
API FitBit is periodically polled by the R2D2 ser-
vice, developed by a project partner, and data is trans-
ferred from the Fitbit cloud services to R2D2 and then
synced to the SmartWork Services. A similar ap-
proach is used to integrate other devices like the With-
ings Smart Scales, using the respective API for ac-
cessing worker’s weight information. The use of the
R2D2 service offers SmartWork an abstraction layer
so that in the future we can integrate more activity
trackers or other off-the-shelf devices that offer their
proprietary API. Except for the physical activity data
(step counts, heart rate, calories burned) the Fitbit ac-
tivity trackers also provide us with sleep-related infor-
mation, to get better estimates for the workers’ quality
of life. The flow of data from the Fitbit and Withings
SmartWork 2021 - 2nd International Workshop on Smart, Personalized and Age-Friendly Working Environments
402

devices through R2D2 and SmartWork is described in
Fig. 4
3.5 ECG Vest
The ECG Vest (Scir
`
e et al., 2019; Akrivopoulos et al.,
2019) is used by the SmartWork workers who are
suffering from diagnosed chronic heart conditions to
monitor the wearers in real-time when they are not
feeling well. It provides information about the beats
per minute, PQRS and RR intervals (Pingale, 2014) as
well as a full ECG recording that can be used by cardi-
ologists as an ECG Holter device recording. Based on
that data received it is capable of sending notifications
about the categorization of the beats observed when
used in conjunction with an analysis algorithm on the
wearer’s smartphone and the Cardio application. The
vest needs to be worn under the user’s clothes as it
needs direct contact with the skin for the electrodes
to work properly. The vest collects the electrode data
locally and transmits them to the user’s smartphone
although it is capable of performing part of the pro-
cessing locally (e.g., beat-detection and RR interval
calculation). The vest is powered by the new Nordic
NRF52840 processor, using BLE5 for communication
with the smartphone application. Additionally, the
current design possesses additional sensing capabil-
ities, like a 3 axis accelerometer, and can be extended
to include sensors for body temperature or oxygen
saturation sensors, that will help provide more data
regarding the wearer and smarter monitoring based on
the inputted data.
4 DATA PROCESSING
Data coming from devices are not always ready to
be used from high-level applications. Further filter-
ing, processing, or analysis is needed to extract better
knowledge and information from it. Also, there are
cases where data have gaps or erroneous values that
are sent either from malfunctioning or misused de-
vices. To eliminate such problems a data processing
and aggregation layer is needed to do the hard work
of extracted clean datasets from the raw data streams
stemming out of the SmartWork unobtrusive sensor
network. In our case, we use the SparkWorks IoT
Analytics Engine to do all these operations as well as
an API endpoint to serve and distribute all the result-
ing datasets to the SmartWork backend and end-user
applications and services, and novel Data Imputation
techniques to fill in any missing data in our datasets.
4.1 The SparkWorks IoT Analytics
Engine
The SparkWorks IoT Analytics Engine (SparksIoT) is
a cloud-based flexible and scalable IoT Data Analyt-
ics platform that can handle unbounded streams of
data in near-real-time and distribute them to multi-
ple applications and services as needed by each use
case. The core of the engine is built using the power-
ful Apache Storm, the open-source distributed real-
time computation system, that can reliable analyze
any amount of data that will be generated by the
SmartWork installations. All sensor data are fed to
SparksIoT via two endpoints: (1) an AMQP
3
connec-
tion (using RabbitMQ
4
) and (2) a Restful HTTPS API
for applications that cannot use the AMQP connection.
The Monitoring Controller is receiving data from both
endpoints and is responsible for filtering any wrong
data coming from the sensors before submitting them
in the core engine. The core engine is composed of
multiple micro-services that sequentially perform the
analytics operations on the streams of data received
until the processed data are stored in their final form
in the data storage micro-service. In more detail, the
core engine contains the following services:
• Streaming Data Annotation Service
• Streaming Data Filtering Service
• Streaming Data Analytics Service
• Data Storage Service
• Data API Service
Figure 5 shows a graphical representation of the
services listed above and their main interactions. We
need to note here that although some arrows appear
to connect services directly, in most cases this hap-
pens through the AMQP message broker, in the same
way, that sensors submit data to the system, mainly in
the cases where streaming sensor data are exchanged.
The only case where services are communicating di-
rectly is the retrieval of historical data by the Data
API from the Storage Service, where the API server
directly queries the internal Storage Service API. In
the next subsections, we are presenting the operation
of all services of the SparksIoT engine.
4.1.1 Streaming Data Annotation Service
This service is responsible for two main tasks. The
first task is to check the validity of the origin of the
data, making sure that each user is providing data in
the appropriate format and that the data provided refer
3
https://www.amqp.org/
4
https://www.rabbitmq.com/
SmartWork: An IoT Enabled Unobtrusive Worker Health, Well-being and Functional Ability Monitoring Framework
403
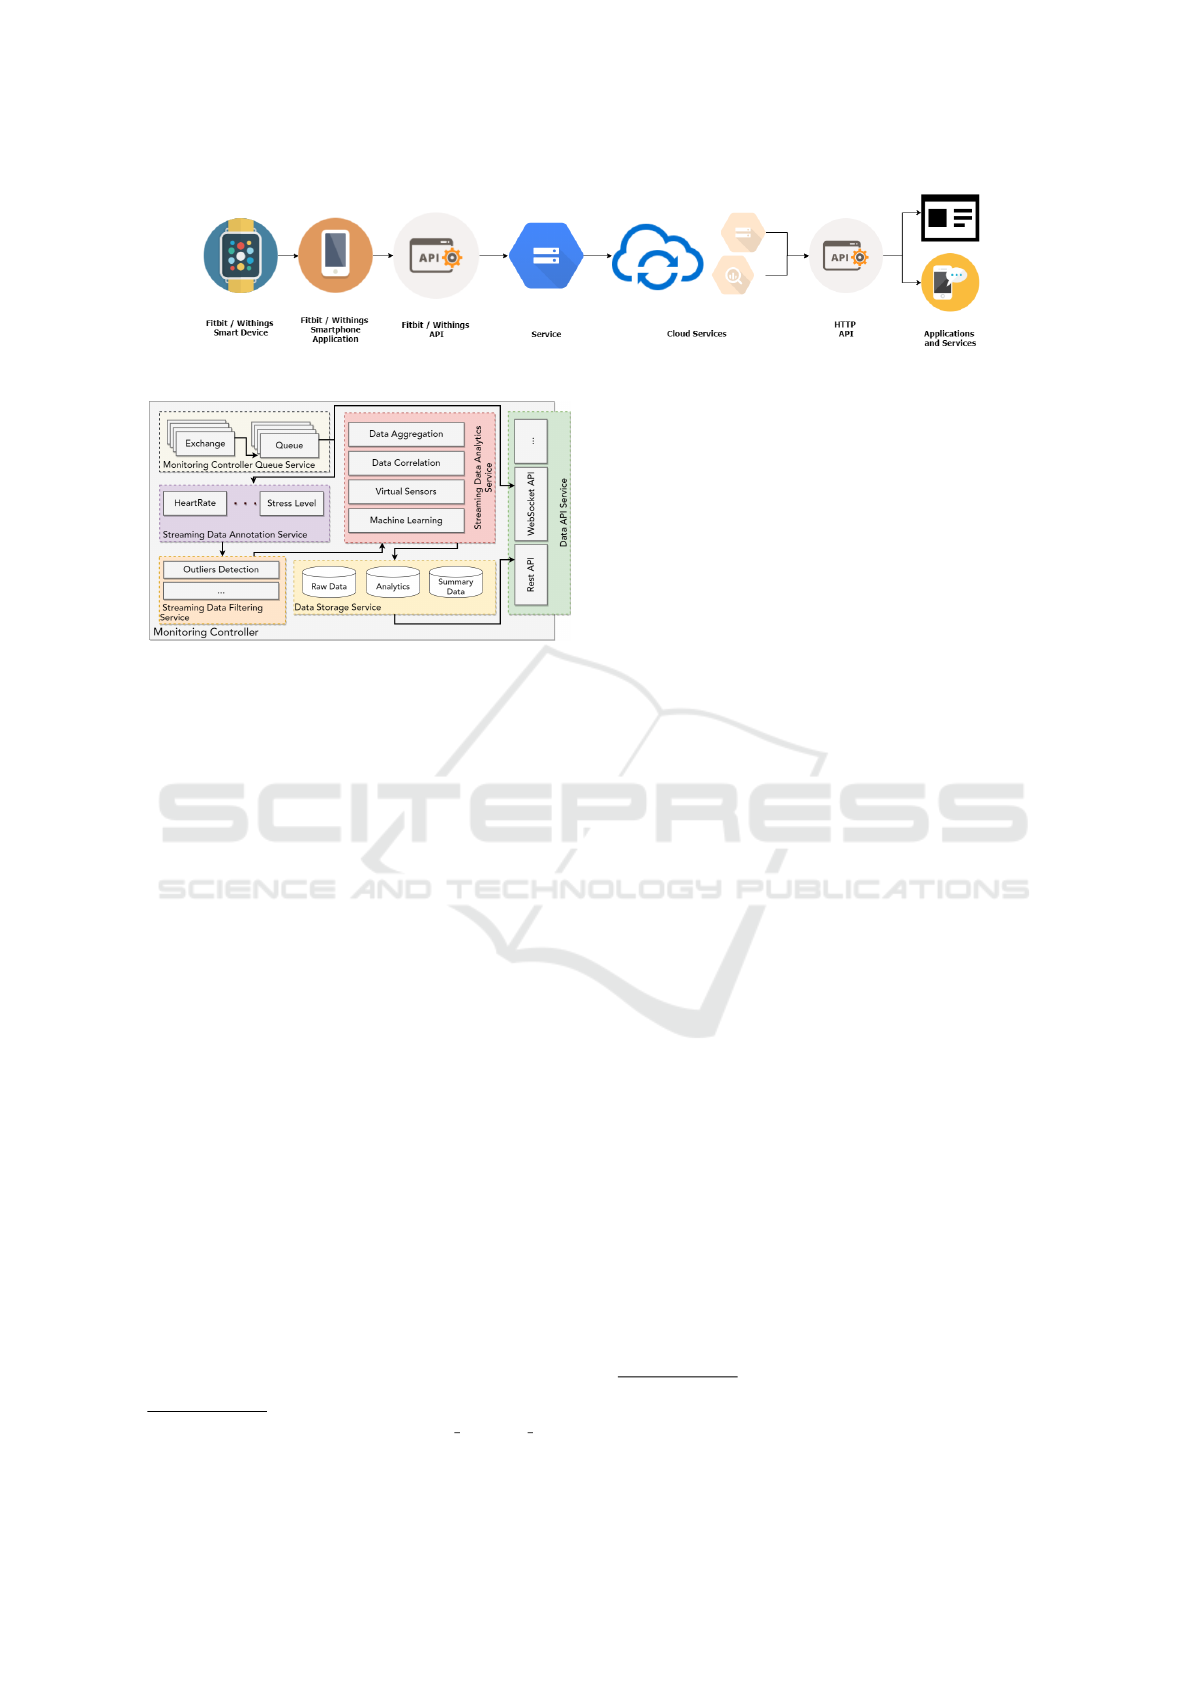
Figure 4: Flow of data from the R2D2 connected trackers to the SmartWork infrastructure.
Figure 5: The SparksIoT core engine services.
to the correct user. The second and more important
task is to extract from the metadata provided by the
sender what these data describe. Each sensor mea-
surement sent to the platform should contain at least
3 parameters. The systemName, the value and the
timestamp of the measurement. The systemName is
a text-based identifier that contains information about
the owner of the data, and the type of data described
in a URI format
5
. The timestamp value is expressed
in Unix time (milliseconds since 1/1/1970) and the
value is a simple numerical representation of the sen-
sor’s received data. Based on the sensor data received,
the Streaming Data Annotation Service is capable of
generating the correct metadata and attaching them to
the sensor data object. Such data are the observed
phenomenon and the unit of measurement used to ex-
press it. For example, for a heart-rate measurement
the observed phenomenon would be Heart Rate and
the unit of measurement, Beats Per Minute. These
data need to be predefined for the platform so that
the annotation can be successful, and as a result, a
set of regular expressions that describe each system-
Name pattern needs to be unique so that no annota-
tions overlap. The generated metadata along with the
sensor data are sent back to the Queue Service for fur-
ther analysis and storage.
4.1.2 Streaming Data Filtering Service
This service is responsible for checking the data re-
ceived for abnormal values and error data that may
5
https://en.wikipedia.org/wiki/Uniform Resource Identifier
have eluded any filtering in the lower levels. It can use
both the historical data of the sensor (based on its sys-
temName) and the metadata generated in the previous
step to do the desired filtering. The actual implemen-
tation of the filtering is based on the business logic
of the application developed and the requirements set
up for this observed phenomenon with multiple algo-
rithms (e.g., Standard Deviation or IQR Outliers).
4.1.3 Streaming Data Analytics Service
The Analytics Service operation on the streams of
data resulting from the Filtering Service and generates
time-based analytics and aggregations on the sensor
data observed. It is capable of generating different
types of analytics based on the observed parameter
and analytics on multiple time granularities based on
the requirements of the project. Typically, it calcu-
lates the average values of the received sensor data on
time intervals like 5 minutes, 60 minutes 1 day, and
1 month based on requirements observed from pre-
vious projects. The service is built around the well-
established data analytics framework, Apache Storm.
4.1.4 Data Storage Service
The Data Storage Service is responsible for receiving
unprocessed and processed data from the AMQP bro-
ker and store them in three separate databases. The
first one is a Redis
6
store, used to store the latest val-
ues from the sensors, and the latest results from the
processing for each time interval. The second store
is responsible for storing all raw data of the sensors.
It is built using MongoDB
7
for high scalability and
performance. The third store is storing all aggregated
and processed data, for each time interval, as the re-
sults from the processing engine.
4.1.5 Data API Service
The Data API Service is built using Spring Boot
8
to
offer highly scalable endpoints for all the operations
of the resulting system.
6
https://redis.io/
7
https://www.mongodb.com/
8
https://spring.io/projects/spring-boot
SmartWork 2021 - 2nd International Workshop on Smart, Personalized and Age-Friendly Working Environments
404

4.2 Data Imputation
The ubiquitous sensing system of the SmartWork plat-
form relentlessly collects data coming from heteroge-
neous sources in terms of sensing device or sampling
rate. This uninterrupted collection is often accompa-
nied by missing entries, yielding the need for estimat-
ing these missing values through imputation, which
may prove unnecessary or computationally expensive
in relation to the outcome. The data imputation mod-
ule mainly consists of two sub-modules:
• the Data Quality Assessment module
• the module performing the imputation itself
The former module implements a data quality as-
sessment approach that allows for decision-making
regarding the need/efficiency of data completion to
save system computational resources and ensure the
quality of the imputed data if imputation is worth be-
ing performed. The introduced algorithm is adapted
and targeted at the singularities of the data comple-
tion paradigm and does not attempt to evaluate the
data quality of a data stream as an entity.
Data imputation methods in a multi-channel data
setting are split into two categories:
• Single-channel imputation approaches, perform-
ing imputation on each data channel individually
• Multi-channel imputation approaches, performing
imputation on all channels simultaneously, addi-
tionally leveraging the inter-correlation observed
between different channels
In compliance with this segregation, the Data
Quality Assessment module provides a score for both
the single-channel imputation case, yielding a total
score as the sum of the scores of the individual data
channels quality scores and the multi-channel impu-
tation case. In the former paradigm, the data quality
score for individual channels is calculated by quan-
tifying the dependence of the score on the percent-
age of missing values detected in a given temporal se-
quence of data and the maximum number of consec-
utive missing values observed in the time series. In
the multi-channel paradigm, the score is additionally
dependent upon the correlations of each data channel
with the two highest correlated data channels of the
rest of the channels.
After having conducted experiments on a variety
of missing data settings, across different data missing-
ness patterns (Data Missing Completely at Random,
Missing Blocks of data(at random), Mixed types of
Missingness (containing instances of both the former
two categories)), it was decided that the most appro-
priate technique for simultaneously maximizing the
accuracy of the performed imputation as well as min-
imizing the computation load demanded and, subse-
quently, minimizing the computational time to facil-
itate real-time analysis and optimized storage, was
the Miss Forest algorithm (Stekhoven and B
¨
uhlmann,
2011). Thus, the currently employed approach by
default in the Data Imputation module is an itera-
tive imputation method based on a random forest
that tries to constitute a multiple imputation scheme
through averaging over numerous unpruned classifi-
cation or regression trees. Multi-channel data imputa-
tion schemes allow for the performance of data com-
pletion while capturing the temporal correlations be-
tween quantities that are related among themselves,
such as heart rate and steps made time-series, which
are commonly expected to be highly correlated. Miss-
Forest was found to introduce the most attractive
trade-off between computational expense and impu-
tation accuracy or, otherwise, reconstruction error.
The missForest implementation exploited for ful-
filling SmartWork’s goals was an R package. Subse-
quently, the method was prototyped using Python 3.7
and missingpy
9
, a library for missing data imputation
which provides an API consistent with sci-kit learn.
5 REAL WORLD EVALUATION
The design and implementation of age-appropriate
living and working environments is a major challenge
as the proportion of older citizens, who are active
members of society and want to continue to live ac-
tively and independently, is constantly increasing.
Intending to achieve more appropriate and effec-
tive results, SmartWork strives for the active involve-
ment of its end-users (office workers over 55 years of
age, their informal managers, and caregivers) in the
co-creation and subsequent evaluation of the system,
through the implementation of 2 pilots (Portugal and
Denmark).
In each of these target groups, it is intended to pro-
duce specific benefits:
• Office workers (55+) - through continuous moni-
toring and assessment of their functional and cog-
nitive capacity, as well as the risk of deterioration
of their health status, and the consequent provi-
sion of tailored support to work.
• Employers - through their capacity to generate
greater productivity and efficiency in office staff,
using intelligent tools to support decision-making
and contextual knowledge management.
9
https://pypi.org/project/missingpy
SmartWork: An IoT Enabled Unobtrusive Worker Health, Well-being and Functional Ability Monitoring Framework
405

• Caregivers / Family Members - by monitoring the
general health status of the people they care for,
providing them with complementary support for
informal care tasks.
Hence, the need to setup an adequate study pro-
tocol that clearly includes the study objectives, the
methods, the procedures and the instruments used
for data collection, the administrative aspects of the
study, and bibliographic references.
5.1 Setting up the Evaluation
Framework
The evaluation framework was set up in several
stages. This was done to allow peer-revision with
end-user organizations and collect the opinions from
the Ethical Committee and Data Protection Officers
(DPOs) of each involved organization.
Overall, we started by preparing an extensive doc-
ument formulating the ”Pilot Study Protocol”, which
already anticipated the two phases of testing. The
structure of such document follows our reference
model, as adopted for similar project and evaluation
works. It includes mainly:
1. Objectives
(a) Primary objectives
(b) Secondary objectives
2. Study design
(a) Setting
(b) Recruitment process
i. General Inclusion Criteria
ii. General Exclusion Criteria
iii. Sample size
iv. Groups structure and Randomization of par-
ticipants
v. Anonimisation procedures
vi. Mobilisation and information provided to par-
ticipants
(c) Research design
i. Hypothesis
ii. Overall methodology
iii. Overall effectiveness
(d) Digital tools and devices
(e) Instruments and Metrics
(f) Risks for participants
(g) Privacy Protection Plan
(h) Administrative aspects of the study
After completion, this documentation was submit-
ted to both the Ethical Committee and DPOs. Upon
positive opinions, we were in the conditions to initiate
the evaluation research work. The evaluation covered
essentially two aspects. One related to ”Usability and
UX evaluation” and the second related to ”Workflow,
impact and overall effectiveness”.
5.2 Usability and UX Evaluation
The main objective of this evaluation is to assess the
parameters of the user interface, user experience, and
overall usability of the system. The empirical usabil-
ity assessment is based on a multi-method approach
that assesses: 1) self-perceived usability, 2) usability
reported by the evaluator, and 3) performance eval-
uation. For self-perceived usability assessment, i.e.
considering the users’ opinion, and for the evalua-
tion based on the evaluator’s opinion on the partic-
ipant’s performance, validated usability assessment
tools will be used. Quantitative data on users’ per-
formance in specific tasks will be recorded in log files
(from each digital tool used) to record the success or
failure of tasks, duration (in seconds), and the total
number of errors. In this type of multi-method eval-
uation, the qualitative results of the usability evalu-
ation (positive aspects and negative -barriers aspects
of technology) are enhanced and complemented with
quantitative results enabling a more accurate assess-
ment, while avoiding overloading end users with long
and repetitive questionnaires for the usability evalua-
tion. The participants in the usability studies will be
the older workers and employers that will work di-
rectly with SmartWork. There will be two moments
of usability assessment. One, in the baseline, in the
first contact with SmartWork technology to evaluate
the first impression that users get of the system. Since
participants at this stage have no knowledge or expe-
rience with SmartWork, they should follow a prede-
fined sequence of steps (e.g., tutorial) to walk through
the main system features and give an opinion on them.
The second moment of usability evaluation should
take place after 8 weeks when participants already
have experience and mastery in using the technology.
At this stage, there is no fixed sequence of steps in us-
ing the system, and the evaluation is made after regu-
lar use of SmartWork.
5.3 Workflow, Impact and Overall
Effectiveness
The main objective of this evaluation is to analyze the
utility and impact of SmartWork in its users’ lives.
The focus will be on the workflow of the workers, em-
ployers, and caregivers when handling activities that
are influenced by using SmartWork and should occur
after some period of using the system (months 2, 4, 6).
SmartWork 2021 - 2nd International Workshop on Smart, Personalized and Age-Friendly Working Environments
406

Four focus groups will be held with the different users
of SmartWork (older workers, employers, and care-
givers/ family members). A Focus group is a qualita-
tive data collection technique, highly popular in sev-
eral contexts, which brings together a small number of
people and promotes informal discussion on a specific
topic. This method aims to extract participant’s per-
ceptions, feelings, attitudes, and ideas about a particu-
lar subject. One researcher should assume the moder-
ator role, being responsible for introducing the topics,
promoting participation and maintaining the discus-
sion.
5.4 Instruments and Metrics
In SmartWork’s evaluation framework the majority of
instruments and metrics used to assess the overall sys-
tem were adopted from commonly accepted and vali-
dated measurement instruments and metrics. The fol-
lowing list describes each of the instruments used, af-
ter carefully selected and ensured their validity in the
different languages used at each pilot site.
• Sociodemographic Questionnaire (self-included
in the WHOQOL-BREF)
• Quality of Life (QoL) - WHOQOL-BREF
• Work Ability Index (WAI)
• Short-Form Health Survey 36 Item v2 (SF-36v2)
• The Copenhagen Psychosocial Questionnaire II -
COPSOQII
• Fatigue Impact Scale v2 (FISv2)
• Older Americans Resources and Services Multidi-
mensional Functional Assessment Questionnaire
(OARS)
• Pittsburg Sleep Quality Index (PSQI)
• Overall Satisfaction Rating Question
• System Usability Scale (SUS)
6 PRELIMINARY RESULTS AND
DISCUSSION
Considering all previously described and consid-
ering we conducted the initial phase of evaluation, we
can present our preliminary results on SmartWork’s
evaluation. The initial phase was conducted at one of
the pilot sites and had a total duration of 3 months.
Sociodemographic Questionnaire. Based on the
information collected through the sociodemographic
questionnaire applied to 10 participants at the base-
line stage, we characterize our target population as
follows:
• age range of 55 to 72 years old (with a larger fre-
quency in the age range between 55 and 60 years
old – 50%).
• most of the participants were women (70%), mar-
ried (80%) and concluded the upper secondary
level of education (60%).
• half of the sample worked as Social Educator
(50%), either with children or with older adults.
SUS: System Usability Scale. When comparing
the score results from both baseline and final assess-
ments for this stage (in a 1 to 100 range), we under-
stand that:
• there was an expressive growth related to the final
rate attributed by older workers to the SmartWork
system (with 30% more rating it over 68).
• on the opposite, there was a 20% increase in the
final scoring below 50.
Such a result may suggest that participants found the
first version of SmartWork acceptable in terms of us-
ability, but users’ expectations were not fully accom-
plished at this stage, stressing the need to proceed to
further improvements in the final prototype.
Individual Interviews. Overall, participant’s satis-
faction with the SmartWork services and functional-
ities, from the midterm to the final interview, seems
to significantly increased. This is supported attending
to the proportion of participants that referred ”to be
pleased”, as we observed 30% more ratings between
“7”, “8” and “9”. Their final improvement sugges-
tions were, therefore, mainly related to:
• Having more direct support from the project team,
through the whole trial operation;
• The adoption of a lay language, duly translated
and easily understandable for the user;
• The FitBit bulkiness, tightness (in some cases of
larger fists) and uncomfortable to sleep with;
• The possibility of having the system installed on
their personal phones, not in a different one;
• The ability of directly accessing their own behav-
ior monitoring at work, through a dashboard;
• Their interest in a service that allowed to organize
work better, regarding time spent at each task.
SmartWork: An IoT Enabled Unobtrusive Worker Health, Well-being and Functional Ability Monitoring Framework
407

7 CONCLUSIONS
In this work, we presented the design of the Smart-
Work worker-centric IoT enabled ubiquitous work
monitoring system. A suite of novel services to pro-
vide the means for workability sustainability for the
older office workers. The whole system was tested
in real-world environments during a three-month trial
period with 10 participants showcasing the usefulness
of the system and the potential impact it could have on
their everyday lives. The whole system is currently
tested on a much larger scale to further investigate its
usability and scalability to help larger worker groups.
ACKNOWLEDGEMENTS
This work has been partially supported by the Smart-
Work project (GA 826343), EU H2020, SC1-DTH-
03-2018 - Adaptive smart working and living envi-
ronments supporting active and healthy ageing.
REFERENCES
Akrivopoulos, O., Amaxilatis, D., Mavrommati, I., and
Chatzigiannakis, I. (2019). Utilising fog computing
for developing a person-centric heart monitoring sys-
tem. Journal of Ambient Intelligence and Smart Envi-
ronments, 11(3):237–259.
Amaxilatis, D., Tsironis, N., Vassiliou, C., Kocsis, O.,
Pardal, A., Vanderheiden, G. C., and op den Akker,
H. (2019). An iot enabled unobtrusive worker health,
well-being and functional ability monitoring frame-
work. In AmI (Workshops/Posters), pages 139–144.
American Society of Heating, R. and conditioning Engi-
neers Inc., A. (2020). Thermal environmental con-
ditions for human occupancy. ASHRAE.
Busse, R. and Bl
¨
umel, M. (2010). Tackling chronic disease
in Europe: strategies, interventions and challenges.
Number 20. WHO Regional Office Europe.
Commission, E. (2020). Eurostat: Employment and unem-
ployment statistics.
Kocsis, O., Moustakas, K., Fakotakis, N., Vassiliou, C.,
Toska, A., Vanderheiden, G. C., Stergiou, A., Amaxi-
latis, D., Pardal, A., Quintas, J., et al. (2019). Smart-
work: designing a smart age-friendly living and work-
ing environment for office workers. In Proceedings
of the 12th ACM International Conference on PErva-
sive Technologies Related to Assistive Environments,
pages 435–441. ACM.
Leligou, H. C., Panagiotis, A., Tsakou, G., Vanderheiden,
G., Touliou, K., Kocsis, O., and Katevas, N. (2019).
Generic platform for registration and online offering
of assistance-on-demand (aod) services in an inclusive
infrastructure. Universal Access in the Information
Society, 18(2):361–385.
Liang, J., Bennett, J. M., Shaw, B. A., Qui
˜
nones, A. R., Ye,
W., Xu, X., and Ofstedal, M. B. (2008). Gender differ-
ences in functional status in middle and older age: Are
there any age variations? The Journals of Gerontology
Series B: Psychological Sciences and Social Sciences,
63(5):S282–S292.
Ortet, S., Dantas, C., Machado, N., Tageo, V., Quintas, J.,
and Haansen, S. (2019). Pervasive technologies ap-
plied to the work environment: Implications for end-
users: the foreground for smartwork concerns and re-
quirements. In Proceedings of the 12th ACM Interna-
tional Conference on PErvasive Technologies Related
to Assistive Environments, pages 459–463. ACM.
Pingale, S. L. (2014). Using pan tompkins method, ecg sig-
nal processing and dignose various diseases in mat-
lab. In Proceedings of IRF International Conference,
pages 57–61.
Scir
`
e, A., Tropeano, F., Anagnostopoulos, A., and Chatzi-
giannakis, I. (2019). Fog-computing-based heartbeat
detection and arrhythmia classification using machine
learning. Algorithms, 12(2):32.
Stekhoven, D. J. and B
¨
uhlmann, P. (2011).
MissForest—non-parametric missing value im-
putation for mixed-type data. Bioinformatics,
28(1):112–118.
Vanderheiden, G. C., Treviranus, J., and Chourasia, A.
(2013). The global public inclusive infrastructure
(gpii). In Proceedings of the 15th international acm
sigaccess conference on computers and accessibility,
page 70. ACM.
SmartWork 2021 - 2nd International Workshop on Smart, Personalized and Age-Friendly Working Environments
408
