
Modelling and Detection of Driver’s Fatigue using Ontology
Alexandre Lambert
1
, Manolo Dulva Hina
1
Celine Barth
1
, Assia Soukane
1
and Amar Ramdane-Cherif
2
1
Inseec U Research Center, ECE Paris School of Engineering, 37 quai de Grenelle, 75015 Paris, France
2
LISV Laboratory, Universit
´
e de Versailles – Paris Saclay, 10-12 avenue de l’Europe, 78140 V
´
elizy, France
Keywords:
Ontology, Driver Fatigue, Context Modelling, Safe Driving, Perception, Data Fusion.
Abstract:
Road accidents have become the eight leading cause of death all over the world. Lots of these accidents
are due to a driver’s inattention or lack of focus, due to fatigue. Various factors cause driver’s fatigue. This
paper considers all the measureable data that manifest driver’s fatigue, namely those manifested in the vehicle
measureable data while driving as well as the driver’s physical and physiological data. Each of the three main
factors are further subdivided into smaller details. For example, the vehicle’s data is composed of the values
obtained from the steering wheel’s angle, yaw angle, the position on the lane, and the speed and acceleration of
the vehicle while moving. Ontological knowledge and rules for driver fatigue detection are to be integrated into
an intelligent system so that on the first sign of dangerous level of fatigue is detected, a warning notification is
sent to the driver. This work is intended to contribute to safe road driving.
1 INTRODUCTION
Road accidents have become the 8th cause of death
worldwide. According to the European Road Safety
Observatory (Observatory, 2019) every year more
than one million accidents take place in Europe, of
which more than 25,000 are fatal. Each accident has a
significant induced socio-economic cost for the coun-
try. More than a million people die on the roads
around the world. While the trend is declining in Eu-
rope, the overall global trend is increasing as shown
in the World Health Organization reports (Organiza-
tion., 2018). One of the most fatal causes of these
accidents is falling asleep on the wheel.US National
Highway Traffic Safety Administration (NHTSA) es-
timates that more than 100,000 drivers are involved in
fatigue-related accidents. Accidents caused by fatigue
are among the most fatal causes of death (Salmon
et al., 2019). When we look at these same statistics
for trucks accidents, more than 60% are related to fa-
tigue. The use of expert systems for fatigue detection
may be a good approach (Bishop, 2000).
By representing fatigue using a model, a level
of fatigue can be detected and inferred continuously
while reacting to a maximum number of situations so
that the intelligent vehicle can ensure driver safety.
The work done to model fatigue did not use maxi-
mum parameters and focuses only on a small number
of symptoms, as for the models proposed by (Bergasa
et al., 2006; Friedrichs and Yang, 2010). The results
of these studies show that a representation of fatigue
in the driving context helps to better ensure driver
safety. However, this does not make these models to-
tally reliable because they do not take into account all
the factors that constitute fatigue.
Not all drivers react the same way to fatigue. In
order to reproduce this disparity, studies such as (Liu
et al., 2009; Thiffault and Bergeron, 2003) modify
parameters that affect drivers, such as time on task,
sleep deprivation. To better represent fatigue in an
intelligent vehicle, we proposed the use of various
parameters from different sources to model the con-
texts of the vehicle, the driver, etc. and fusion them,
taking into account the driver’s profile. The percep-
tion of the environment is essential in an intelligent
system that detects driver’s fatigue, hence, the smart
environment is equipped with sensors and web ser-
vices that measure or deduce various parameters re-
lated to the context of the environment, the vehicle
and the driver. In a smart city, these sensors and web
services continuously retrieve relevant data. The ob-
tained data are used to populate the fatigue model,
hence, the model becomes a computer-readable repre-
sentation of the driver’s fatigue situation. Using data
fusion and related rules, it is possible to determine the
level of driver fatigue. Using the degree of driver’s fa-
84
Lambert, A., Hina, M., Barth, C., Soukane, A. and Ramdane-Cherif, A.
Modelling and Detection of Driver’s Fatigue using Ontology.
DOI: 10.5220/0010689700003064
In Proceedings of the 13th International Joint Conference on Knowledge Discovery, Knowledge Engineering and Knowledge Management (IC3K 2021) - Volume 2: KEOD, pages 84-95
ISBN: 978-989-758-533-3; ISSN: 2184-3228
Copyright
c
2022 by SCITEPRESS – Science and Technology Publications, Lda. All rights reserved
tigue, it is also possible to notify/alert the driver of an
impending danger.
2 AN INTELLIGENT SYSTEM
Intelligent systems assist in meeting the needs of peo-
ple, which are becoming increasingly complex. An
intelligent system provides user with relevant and use-
ful information, it is an intelligent collaborator, ac-
cording to (Jorion, 1989) vision. An intelligent sys-
tem is usually connected to other systems via Internet
of Things, and is able to provide a response suitable to
the user’s need. (Kasabov and Filev, 2006) stated that
an intelligent system is capable of decision making,
reasoning and action, and possesses knowledge.
In our vision of an intelligent system, it should
be: (1) able to process and react in real-time, (2) con-
nected to other intelligent systems to be able to ex-
change information and be aware of a larger environ-
ment, (3) to interact with the outside world (engine,
screen, etc.), (4) to sense the outside world through
data (sensor data), (5) possesses knowledge about cer-
tain situations and must reason, (6) aware of possible
errors that could come up, (7) able to adapt to its user
by being aware of the user’s profile.
In the literature there are intelligent systems theo-
ries as proposed by (Albus, 1992; Karray et al., 2004).
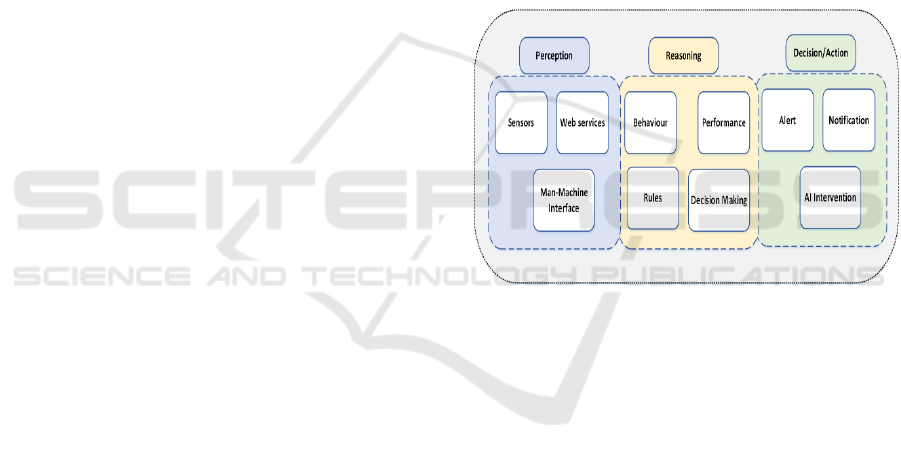
The intelligent system is composed of three compo-
nents that interact with one other. The intelligent
system components and the mechanisms inside each
component depends on the type of application the in-
telligent system provides. The three components are
common to intelligent systems. See Figure 1.
2.1 The Perception Component
The perception component allows interaction be-
tween the intelligent system and the outside world.
Such interaction can be in sensing the environment
using a sensor, a man-machine interface, or a web
service. This component gathers all the information
needed by the intelligent system. This module must
be reliable. If it becomes unreliable, the data are
transmitted to the system as well as the correspond-
ing reasoning will be wrong.
2.2 The Reasoning Component
The reasoning or ”intelligent” component collects
data from the perception component to determine the
current situation and reasons out on this data and out-
puts a result induced from the input data. There are
several ways to make a reasoning, but the goal re-
mains the same: one set of input data yields a corre-
sponding set of output data. Using appropriate rules,
an intelligent system reasons out due to a system’s
behaviour or performance. In this component, it is
possible to use neural networks as a machine learning
approach or inference engines coupled to a represen-
tation of ontological knowledge.
2.3 The Decision Component
Once the reasoning component has produced a result,
it must be interpreted by the decision module in order
to choose the action to be taken on the environment.
The actions can be broad and depend on the type of
intelligent system. But the goal remains the same, to
impact an action on the environment according to the
output data produced by the reasoning component.
Figure 1: Basic components of an intelligent system.
3 AN INTELLIGENT FATIGUE
DETECTION SYSTEM
The schematic diagram of Figure 2 describes a con-
ceptual intelligent system for fatigue detection. The
driving simulator is an environment in which the driv-
ing activity takes place. The driver interacts with the
simulator and pilots the vehicle to move within such
environment. As the vehicle moves, the simulator
calculates parameters specific to the vehicle, such as
speed, steering wheel angle, acceleration, etc.
The expert system is composed of two modules:
the component that controls the data received from the
simulator and the module that manipulates the ontol-
ogy. Using the CARLA (Dosovitskiy, 2017) simula-
tor, it is possible to retrieve data of certain parameters
of interest, such as the steering angle, the yaw angle,
or the acceleration. However, these measures must be
recalculated to obtain new values, such as the average
or the frequency. This is the functionality of the first
Modelling and Detection of Driver’s Fatigue using Ontology
85
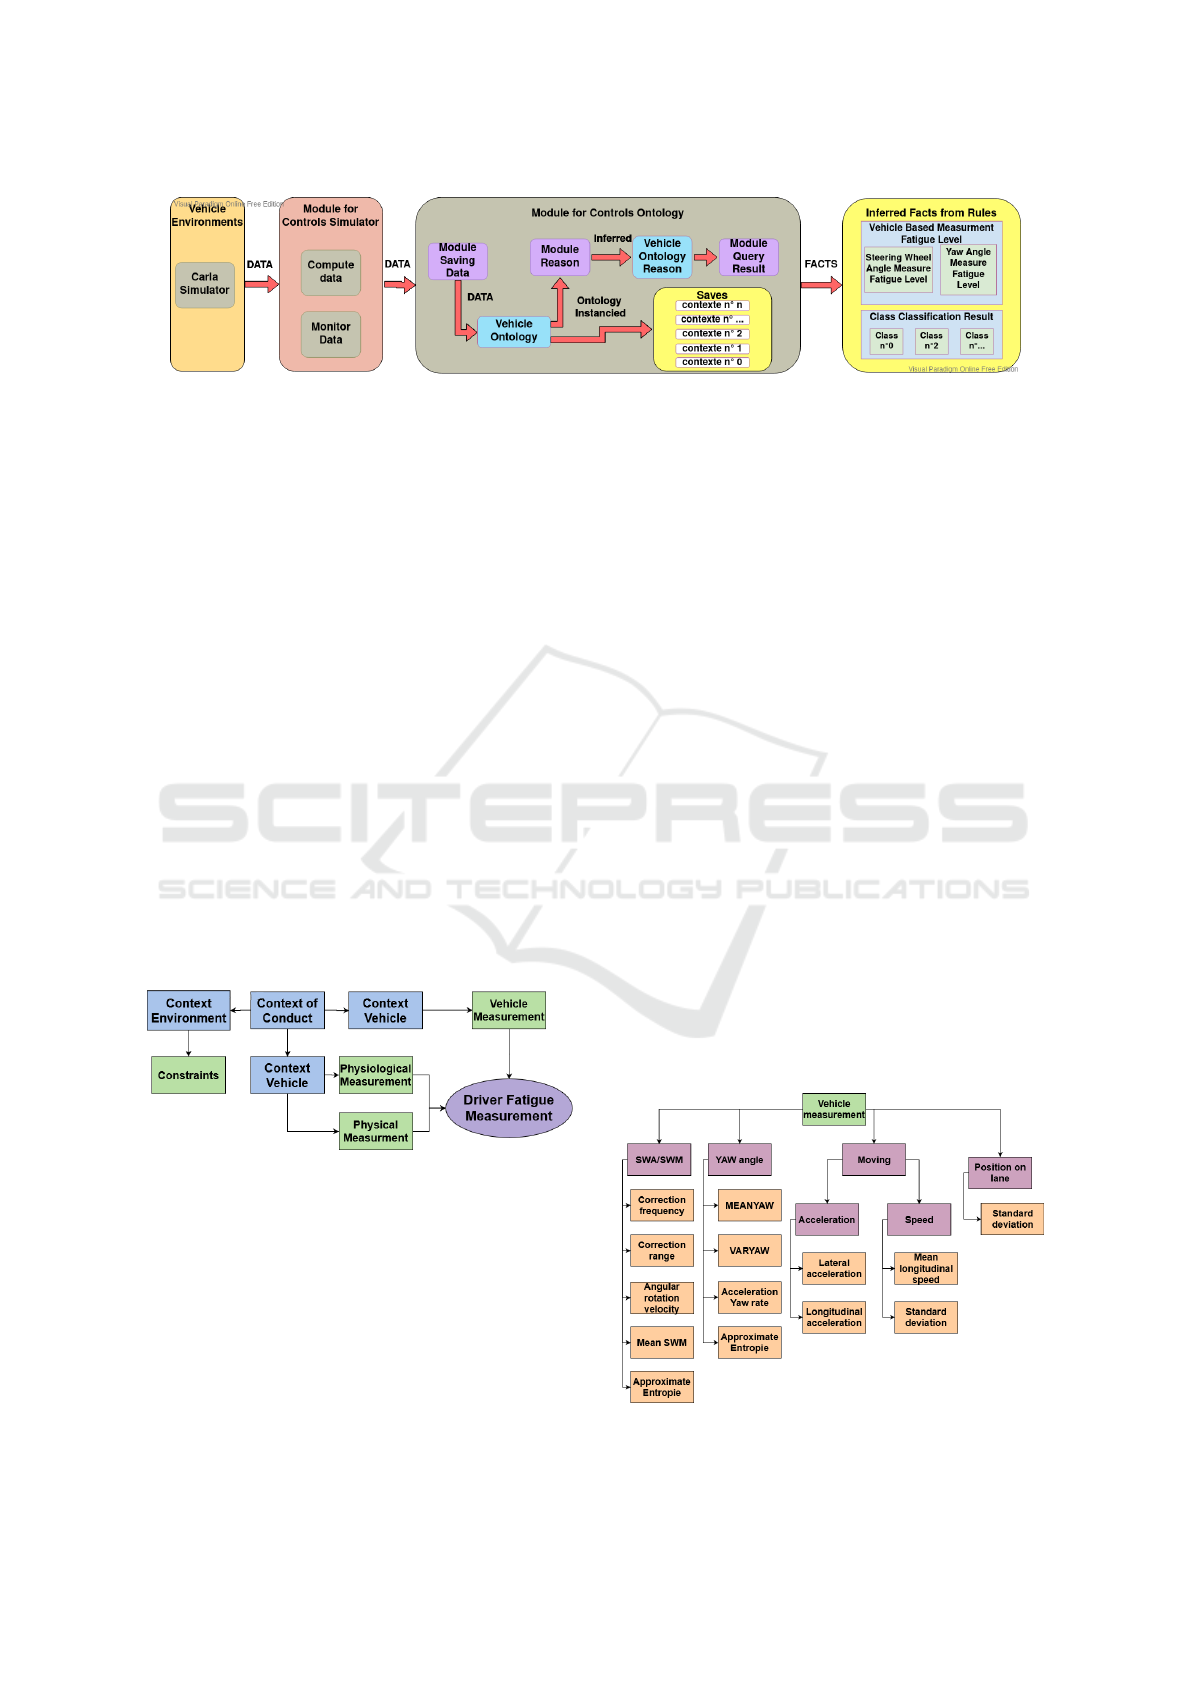
Figure 2: Schematic diagram of an intelligent driver fatigue detection system.
component of the system which allows the acquisition
of data from the simulator, its calculation and also the
monitoring of the data in the form of logs. This mod-
ule interrogates the simulator at a regular frequency
and transmits calculated data to reasoning system.
The reasoning component is based on ontology, in
which every data received will be inserted into the on-
tology as an instance or an attribute of a class. Here,
using the actual data, one model ontology is trans-
formed into an instantiated ontology. The reference to
databases is still being tested, and will be integrated
in our next publication. Hence, the data is saved into
the ontology, which in itself will be a representation
of the driver fatigue’s situation. In order to keep a
record of these contexts for later analysis, a version of
the ontology is saved in a specific file, as a historical
data. In parallel, the instantiated ontology is used by
the reasoning module to classify and infer the class
that indicates the level of driver’s fatigue. The rea-
soner will also use the rules in the ontology to merge
different data.This will result in a reasoned ontology,
which will have to be interrogated to find out the level
of fatigue inferred.
Figure 3: Driver fatigue model.
It can thus be transmitted to the decision module
which will take action according to this level. The last
component in the diagram shows that the queried facts
are inputs to the fatigue level measurement based on
vehicle parameters (steering wheel angle, yaw angle
measure). Based upon these values, a driver fatigue
level classification is decided. As stated, a driver alert
and notification mechanism follows to prevent further
accident due to driver fatigue. This part, however, re-
mains to be done and is part of future work.
4 DRIVER FATIGUE MODEL
Fatigue is a phenomenon characterised by a num-
ber of parameters that can be modelled in terms of
knowledge and that can manifest itself through an in-
dividual, such as a driver. This manifestation occurs
through variations in the person’s physical and phys-
iological states, as well as in his driving.(Figure 3)
Fatigue manifests itself in the three broad categories
of parameters: (1) Physical measurement, (2) Physi-
ological measurement, and (3) Vehicle measurement.
Each of these categories is broken down further into
sub-categories and so on, down to the atomic param-
eters of the model. The purpose of the model is to
list down all the parameters whose values may vary
depending on the degree of one’s fatigue. It is thus
possible to have values of the parameters that will be
qualitative in terms of fatigue.
4.1 Driver’s Fatigue Detection using
Vehicular Measurements
The vehicular measurements refer to the signals com-
ing from the vehicle. These selected signals provide
information on the driver’s state of drowsiness, which
have been studied by various researchers since 1990s
(Dingus, 1985; Siegmund et al., 1996).
Figure 4: Vehicular parameters measurements.
KEOD 2021 - 13th International Conference on Knowledge Engineering and Ontology Development
86

Studies on the impact of drowsy driving focus
on one or more parameters (Li et al., 2020; Poly-
chronopoulos et al., 2004) but rarely use all measures
and signals to describe fatigue. The driver fatigue de-
tection using vehicular measurements (Figure 4). The
model is based on five parameters, each of which is
described below. This model is based on the results
of previous studies that validated these parameters as
presented by (Ramzan et al., 2019) in Table 1.
4.1.1 Steering Wheel Angle (SWA/SWM)
This measure is taken directly from the steering wheel
angle sensor of the car, is expressed in degrees, and is
a function of time. The variation of steering wheel an-
gle over time may indicate information about driver
drowsiness. The study in (Thiffault and Bergeron,
2003) shows that a driver has a tendency to increase
the amplitude of the steering wheel angle measure-
ment during drowsy periods. During normal driv-
ing, the driver readjusts the car almost continuously
with the help of micro-corrections that allow the car
to stay in a lane. This work then led to several studies
on the behaviour of the driver, notably in (Krajew-
ski et al., 2009) which used the angle of the steering
wheel to deduce fatigue recognition patterns with a
success rate of 86.1%. During periods of fatigue, the
driver is less sensitive to the small drifts of the car
on the lane; this results in a correction of a higher
amplitude with the steering wheel to refocus on the
lane. (Thiffault and Bergeron, 2003) estimated that
the value of the angle over time for a driver was gen-
erally between 1
◦
and 6
◦
, beyond which the value of
the angle becomes significant in detecting a drowsy
driver. It is also necessary to look at the time that a
high angle (greater than 6
◦
) is maintained as this can
provide information on the general movement of the
car (a curved road, a bend, a large drift). It is neces-
sary to take into account the shape and route of the
journey in order to discern high angle values that are
abnormal in a hypo vigilance case from normal.
Steering Wheel Angle Amplitude and Frequency.
High frequency of correction was significant for an
alert driver because he was attentive to the position of
the vehicle in the lane and wanted to keep it centred.
Conversely, a low correction frequency may indicate
a less alert driver because he is not aware of the ve-
hicle’s micro-drift and therefore tends to correct his
trajectory less often as shown in (Ting et al., 2008).
The frequency of corrections can be described as nor-
mal, decreasing, or abnormally low depending on the
number of steering wheel angle measurements greater
than 6
◦
. The type of road should be taken into account
to make the best use of this sub-parameter/factor.
Amplitude of corrections describes the value that
the steering wheel angle takes in degrees. Stud-
ies have shown that this value rarely exceeds 6° for
an alert driver because the micro-correction helps in
maintaining a trajectory is regular and does not re-
quire a ”large steering wheel stroke” to correct devia-
tions. Conversely, a driver in a fatigued state tends to
have a large amplitude of steering wheel angle to cor-
rect deviations. In periods of fatigue, the driver is no
longer aware of the drifts of his vehicle and realizes
it later. This sub-parameter/factor is sensitive to road
curvature, as a curved road may add an offset to the
amplitude in order to maintain a trajectory.
Angular Speed and Average of the Steering
Wheel. This indicator describes the value of the an-
gle over time in (
◦
/s). Studies have shown that a nor-
mal angular velocity value (less than 6
◦
/s) character-
izes an alert and attentive driver while a high (greater
than 6
◦
/s) and sustained angular velocity indicates the
need to straighten the vehicle after a period of inat-
tention. By analyzing the angular velocity in time
windows, it is possible to notice the periods when the
driver presents fatigue (Zhenhai et al., 2017). Aver-
age steering wheel angle describes the average value
of the angle over a given period of time. It provides
additional information and varies as the amplitude de-
scribed above. It can be used to have a more general
idea of the value of the angle in order to characterize
the movement over time as opposed to the amplitude
which describes the value of the angle at a given time.
Operator Type Sub-parameters. These
sub-parameters/ factors focus on transforming
the signal to extract non-visible information. These
operators can be of a mathematical nature or signal
processing tools. Some studies use approximate
entropy (Delgado-Bonal and Marshak, 2019) and
Fourier transforms to do this.
Approximate entropy is a mathematical operator
which after a succession of operations allows a bi-
nary classification of the driver’s state: tired or not.
The approximate entropy is then extracted from the
signal using adaptive piecewise linear approximation
and classification.(Li et al., 2017a; Li et al., 2017b)
were able to detect the presence or absence of fatigue.
Frequency and phase function uses the furnace
transformers to analyze the value of the angle as well
as the angular velocity of the flywheel in frequency
and phase. (Siegmund et al., 1996) have shown that in
the frequency domain, the power of the low frequency
spectrum increases when the driver shows signs of
fatigue. For the phase analysis, they expressed the
Modelling and Detection of Driver’s Fatigue using Ontology
87
phase of the steering wheel angle (θ) as a function of
the phase of the steering wheel angular velocity (ω).
An attentive and concentrated driver gives an expres-
sion of the phase concentrated in clusters around the
origin (θ less than 6
◦
, ω less than 25
◦
per seconds)
while a more tired driver will have an expression of
the phase with larger loops (θ and ω larger) or small
clusters at angles θ greater than 6
◦
, showing inatten-
tive behaviour typical of a tired driver. All these char-
acteristics are analyzed using weighting functions.
4.1.2 Yaw Angle
The yaw angle of a vehicle describes the rotational
movements around the vertical axis of the vehicle.
The yaw angle varies between 0° and 1° for an awake
driver and above 1° for a sleeping driver. The work
of (Dingus, 1985) shows the correlation between the
mean and variance of the yaw angle and driver fa-
tigue. (Li et al., 2017a) used yaw angle with approx-
imate entropy to describe fatigue with good result.
Also Yaw angle acceleration was compared for dif-
ferent driving situations including fatigue. A signifi-
cant increase in yaw acceleration 2.5°/s
2
was shown
for a driver who was drowsy. The yaw angle sub-
parameters include almost all of the steering wheel
angle sub-parameters.
4.1.3 Vehicle Speed and Acceleration
(Chen et al., 2015) compared different acceleration
rates (longitudinal and lateral), and noted a variation
in the lateral acceleration rate of 2.0 m/s
2
in the pres-
ence of fatigue. The results for the longitudinal accel-
eration are less encouraging but still worthy of inclu-
sion in the model. It is always useful to re-study the
parameter with our model
4.1.4 The Position on the Track
This sub-parameter describes the position of the vehi-
cle on the track. As explained earlier, it is useful to
focus on driver drift. One way to observe drift is to
use the position on the sightline, including the stan-
dard deviation (deviation from a reference point) or
to count the number of times the car crosses the line
in the lane as studied by (Ting et al., 2008). This in-
dicator also makes it possible to observe whether the
car is in a dangerous position for the driver and other
cars (reversed direction, road overflow).
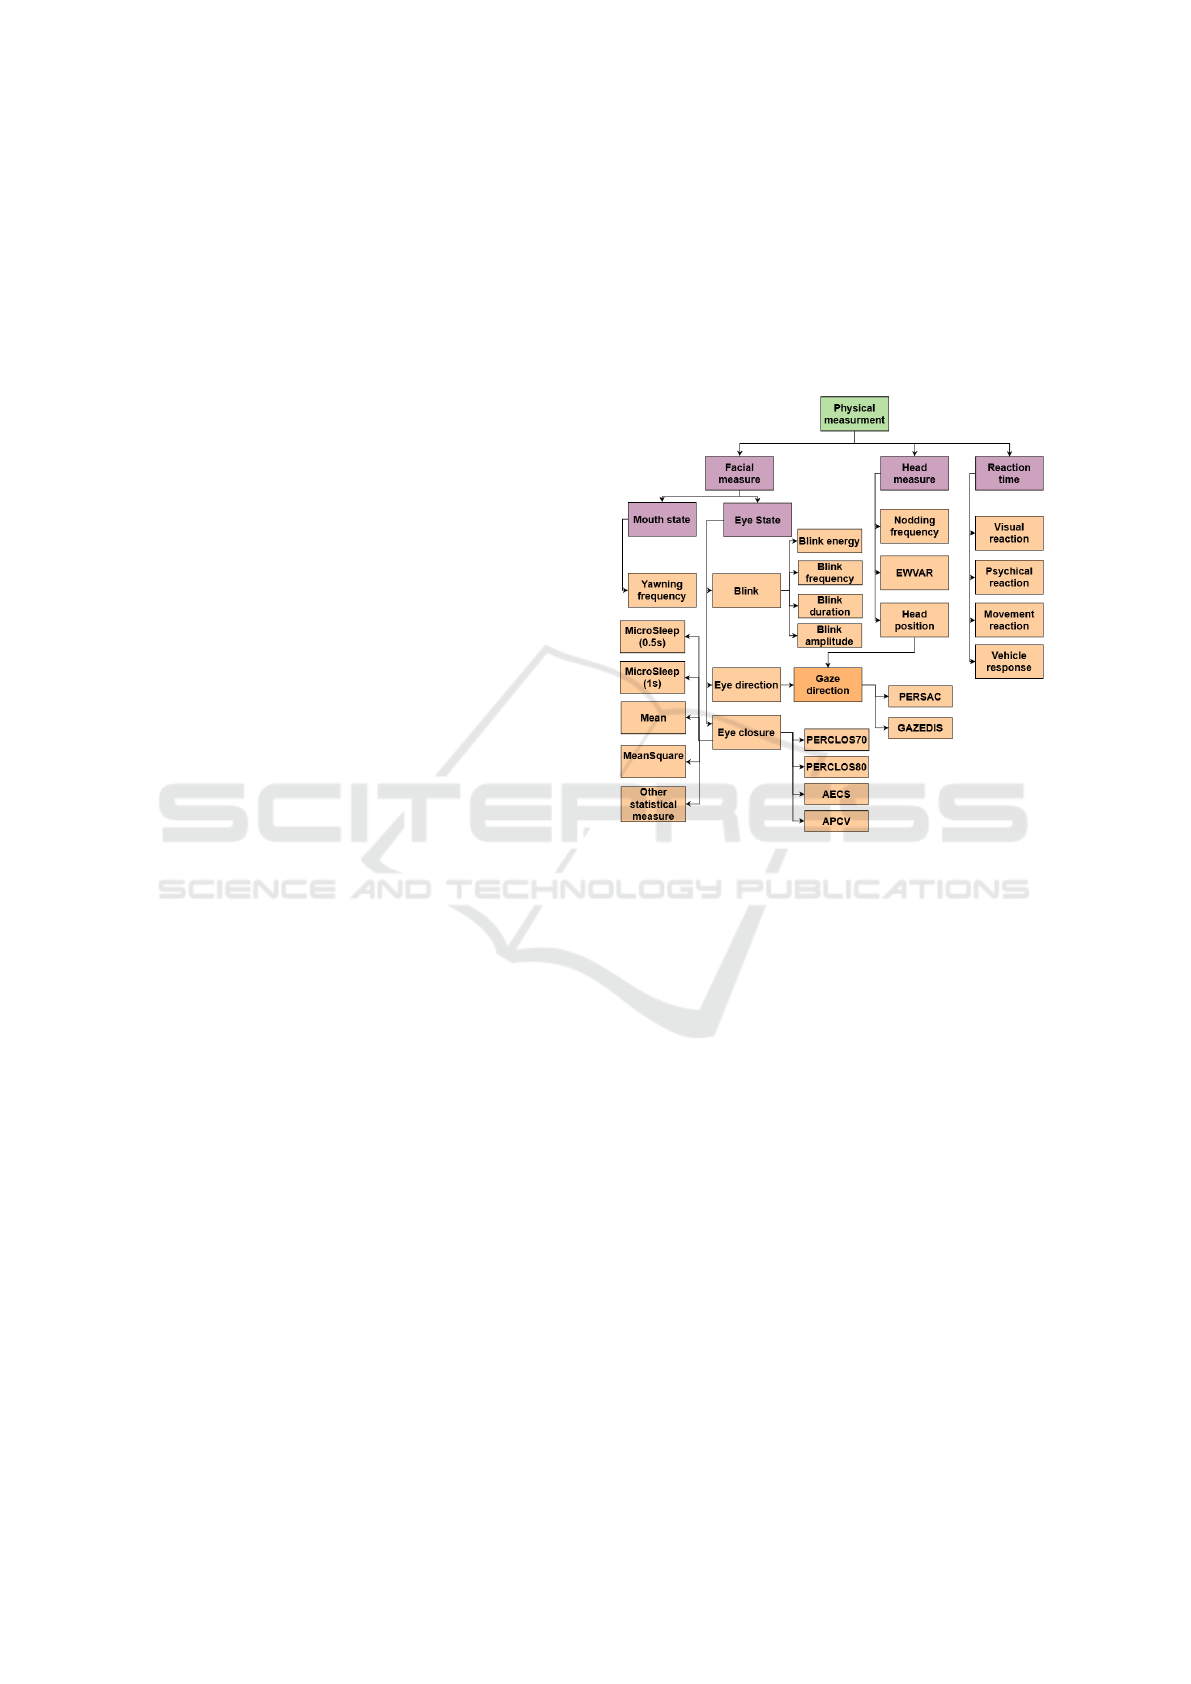
4.2 Driver’s Fatigue Detection using
Physical Parameters
This type of parameter groups together all relative
changes in the driver’s physical state. These measure-
ments focus on the face, in particular on the eyes and
mouth, which are very likely to change during periods
of drowsiness (Figure 5).
Figure 5: Physical parameters measurements.
4.2.1 The Mouth’s Condition Parameter
These parameters are very much studied by re-
searchers because they are associated with facial
recognition algorithms. They are among the most im-
portant because they contain decisive elements such
as the eyes (e.g. closing the eye for a long time)
to detect fatigue. The model consists of 4 main pa-
rameters, which describe the state of the mouth, the
state of the eyes, the state of the head and the reac-
tion time. Below, we have elaborated this sub-model.
Fatigue can manifest itself through the driver’s yawn-
ing. It is commonly recognized as a sign of fatigue
and should be taken into account in our model (Ab-
tahi et al., 2011). To do this, we studied the opening
of the mouth, and if it exceeds a certain threshold for
a significant time, then yawning occurs (Weiwei Liu
et al., 2010; Fan, 2007), or by calculating the air in
the mouth (Reddy et al., 2017). (Azim et al., 2014)
use the ratio and the air to qualify the state of the
mouth. It is also possible to study the frequency of
driver yawning in order to have an indication of the
number of times the driver yawns, that if it increases
may indicate significant fatigue. Other statistical op-
KEOD 2021 - 13th International Conference on Knowledge Engineering and Ontology Development
88

erators (median, mean, etc.) can also be used to qual-
ify the state of the mouth.
4.2.2 Eye Condition Parameter
There are 3 sub-parameters to be studied to deduce
the state of the driver’s eyes: the blinking, the open-
ing of the eyes and the direction of the eyes. These
parameters allow us to have a qualitative measure of
the general condition of the driver’s eyes.
Blink Parameters. As stated in (Schleicher et al.,
2008), blinking and other associated measures are
strongly related to fatigue, notably the duration of
the blink which allows us to know how long the eye
is occluded by the eyelid. This measure is useful
for detecting driver micro sleep. Blink frequency is
also commonly used because it has been shown that
the number of blinks increases as driver alertness de-
creases (Hargutt and Kruger, 2001). Blink amplitude
can help us to describe the state of the blink. In
(Friedrichs and Yang, 2010), all of these measures are
used as well as the same measure but tailored to the
driver.
Parameters Related to Eye Closure. In order to
quantify eye closure, we can use an indicator that is
widely recognized as effective, PERCLOS (Adminis-
tration, 1998). This indicator represents the propor-
tion of time the eye remains closed at least X% over a
time window. It is possible to use PERCLOS with
larger or smaller time windows and a more or less
significant percentage of eye closure. For example,
(Friedrichs and Yang, 2010) uses 70% PERCLOS and
80% PERCLOS over a time window of 3 minutes.
Other measurements are used such as square aver-
ages, average eye aperture, amplitude-velocity ration
(APCV) or average eye velocity (AECS). To prop-
erly qualify the condition of the eyes, the model must
qualify the blink and the eye opening in frequency,
amplitude and speed. Thus, it is possible to use other
statistical operators (PERCLOS, mean square) to de-
scribe these indicators.
4.2.3 Parameter Relating to Head Movement
Head movements can also be an indicator of fatigue.
Indeed, during periods of micro sleep that may occur
at the wheel, the driver relaxes the muscles of his head
(Hartley et al., 2000). Thus, it is possible to detect
changes in head angle indicating a driver no longer
has full control of his vehicle. This parameter is stud-
ied in frequency, in order to free oneself from head
movements due to normal driving. In (Friedrichs and
Yang, 2010), they use a weighted exponential mean
and variance (EWMA EWVAR).
4.2.4 Eyesight Parameter
The description of the movement of the head as well
as the movement of the eye allow us to obtain the di-
rection of the glance. In general, the direction of gaze
can be used to describe several situations and not only
fatigue. In particular, we can calculate the percentage
of jerky eye movement (PERSAC) or the distribution
of the gaze over time (GAZEDIS), which are param-
eters of the gaze related to fatigue (Ji et al., 2004).
4.3 Driver Reaction Time
This parameter describes different driver reaction
times to obstacles (pedestrians, objects on the road).
As stated in (Ting et al., 2008), reaction times in-
crease in the presence of driver fatigue. To qualify
the driver’s reaction time, 4-time intervals are defined:
the visual reaction time of the obstacle, the physical
reaction time, the movement time and the response
time of the vehicle.
4.4 Driver Fatigue Detection using
Physiological Parameters
Physiological characteristics are very important, as
they are robust, reliable and directly related to the
physical and psychological state of the driver. More-
over, the acquisition is not directly disturbed by arte-
facts due to changes in weather or lighting conditions,
unlike cameras as we have seen in the physical param-
eters (Begum, 2013). Measurements of physiological
signals can be influenced by the general state (emo-
tions and other psychological states) of the driver, so
it is best to compare several of these measurements to
ensure that the driver is fatigued. Some measures also
vary from person to person. Physiological parame-
ters can be divided according to the different modes of
acquisition. There are parameters from the so-called
”Electro” acquisition modes (EEG, ECG, EMG, EDA
and EOG) and other parameters (Figure 6).
4.4.1 Parameters from the EEGs
The EEG parameters have been studied for quite a
long time (the EEG of drowsiness in normal adults).
The EEG allows the analysis of brain activity through
different parameters (Chowdhury et al., 2018): the
spectral power (e.g. delta, theta, alpha and beta
bands), the amplitude and latency of the third peak
of the ERP (Event Related Potential) as well as the
Modelling and Detection of Driver’s Fatigue using Ontology
89
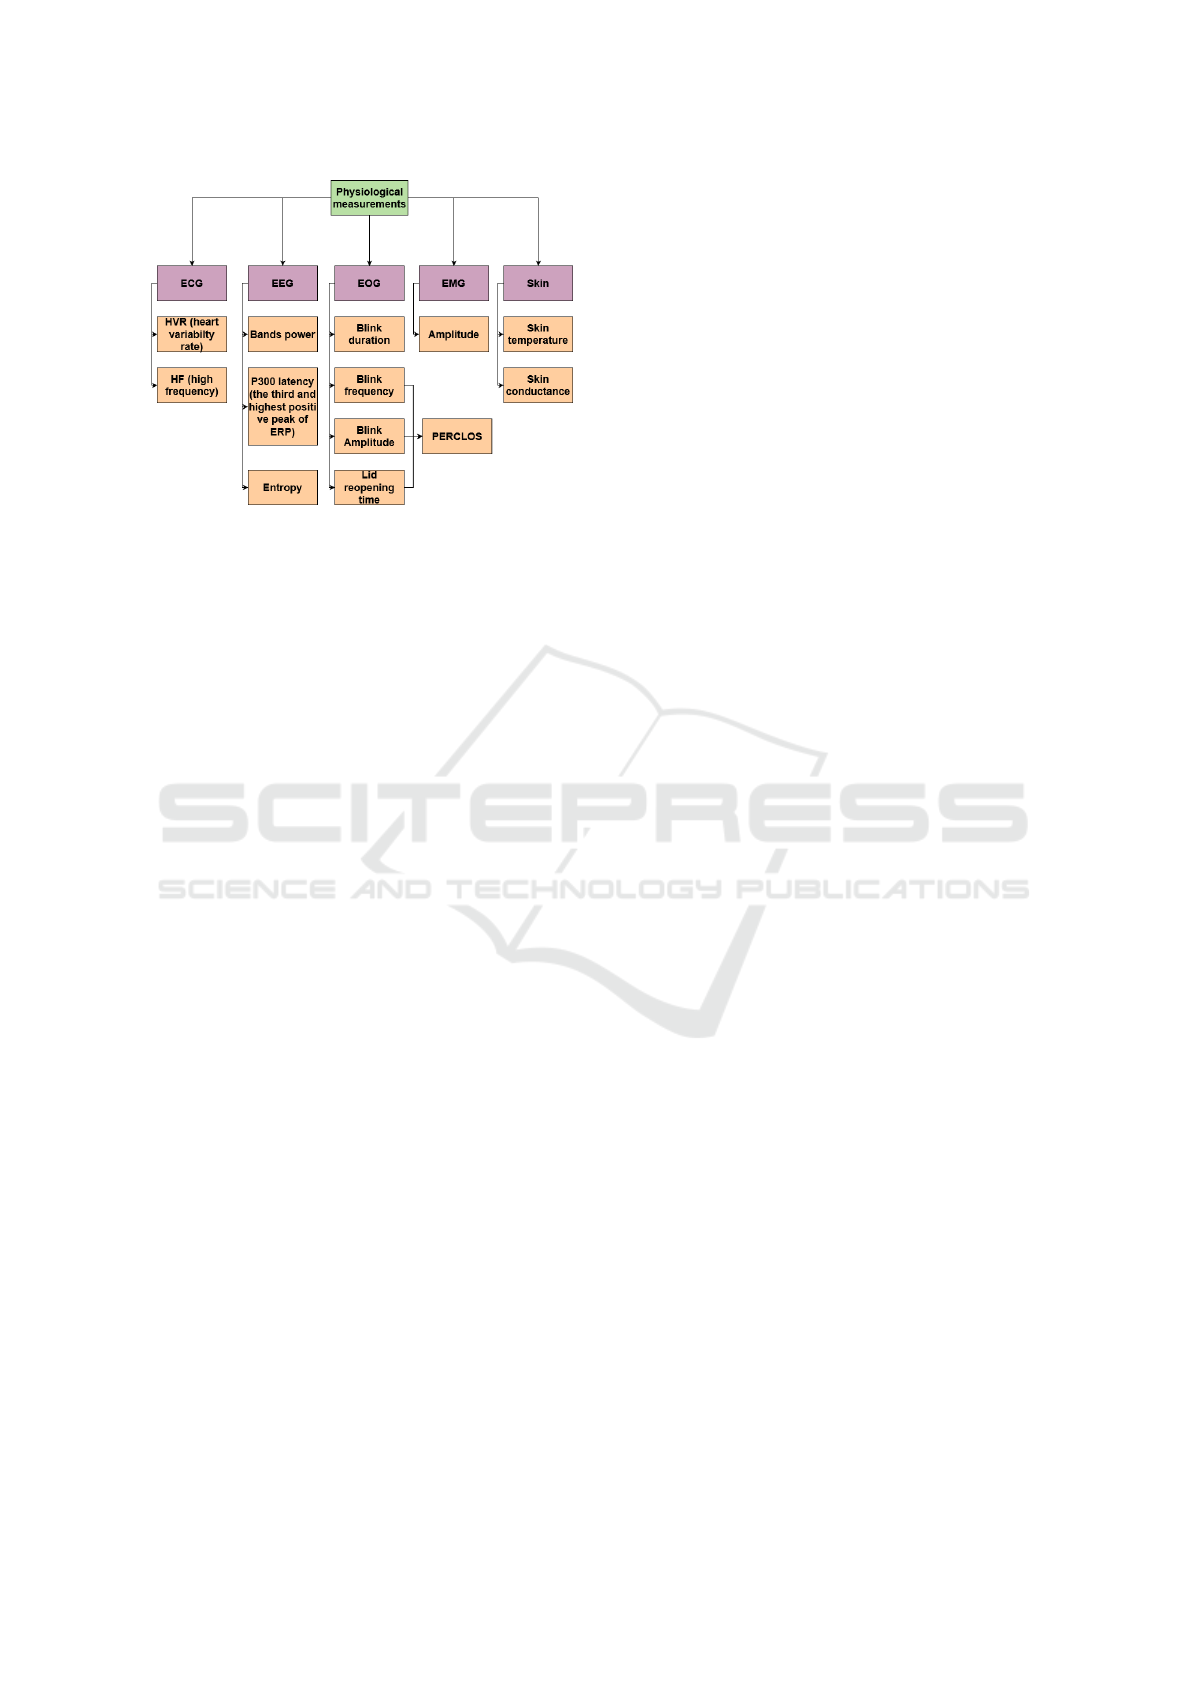
Figure 6: Physiological parameters measurements.
entropic signal of the EEG. After the transformation
of the EEG signals, four EEG frequency bands are
obtained. These four frequency bands are not pre-
cisely defined. However, the literature (Zhao et al.,
2012) frequently uses these amplitudes as having a
frequency between approximately: Delta Band (1Hz-
4Hz), Theta Band (4Hz-8Hz), Alpha band (8Hz-
12Hz), Beta Band (12Hz-18Hz). The Beta band is
significant as long as a cognitive task requires a high
level of concentration (such as driving, for exam-
ple). The Alpha band increases as alertness decreases
(increases greatly during sleepy phases) but flattens
after phase changes (e.g., alertness to drowsiness)
(Brookhuis and de Waard, 2010). The Theta band
finds its power in the primary phases of sleep. The
Delta band is used to classify the states of intense
sleep but it is almost null power during the sleeping
states (Svensson, 2004). Measurements of the differ-
ent bands are likely to change from one subject to an-
other. The acquisition of these signals in a vehicle can
be complicated due to the noise and various artefacts.
4.4.2 ERP and EEG Entropy
An ERP is a response of the brain to a certain stimu-
lus (Rondik and Mautner, 2013). The amplitude and
latency of the third spade of the ERP is often studied.
This information provides information about the cog-
nitive resources and the speed of the driver’s thinking
time. Some studies have shown that the amplitude
decreases with increasing driving time (Zhao et al.,
2012). This implies a reduction in alertness and a
longer reaction time. Entropy is useful to qualify non-
linear, unstable and dynamic signals such as EEGs.
There are several types of entropies, for example (Mu
et al., 2017) used four different entropies on an EEG
data: Spectral Entropy, Approximate Entropy, Sam-
ple Entropy and Fuzzy Entropy. These parameters
were used to train an SVM classification with EEG
signals from 12 patients to classify fatigue. The re-
sults showed an algorithm performance of 98.75%.
4.4.3 Heart Rate and Its Variability (ECGs)
ECG collects signals that provide information about
an individual’s cardiac system. These parameters cor-
relate with drowsiness while driving. The heart rate
is defined as the number of beats per minute (BPM).
The reduction in heart rate can occur when the rider
goes from awake to asleep as shown in (Sun et al.,
2011; Furman et al., 2008).(Abdul Rahim et al., 2015)
uses a sensor placed on the steering wheel to monitor
heart rate. BPMs are classified as normal between
75 and 100 for men and 70 and 95 for women and
drowsy between 50 and 65 for men and 45 and 63
for women. Heart rate variability which is defined
as the variation in a time interval between two con-
secutive beats. It can be called R-R interval or RRI.
The work of (Vicente et al., 2016) tells us that the
variation in heart rate can be described as the activ-
ity of the nervous system that is highly altered by
fatigue. HRV (heart rate variability) is also studied
in spectral analysis, decomposing HRV into 3 bands
(Shinar et al., 2006): Very low frequency (0.0008Hz-
0.04Hz), Low frequency (0.04Hz-0.15Hz), High fre-
quency: (0.15Hz-0.5Hz). HRV activity in these fre-
quency bands reveals the activity of the sympathetic
nervous system (Chowdhury et al., 2018).
4.4.4 Breathing Frequency
Breathing frequency is the number of inhalations and
exhalations per minute. (Sun et al., 2011) shows a
link between breathing rate and fatigue. However,
other studies show no change in breathing cycles in
the presence of fatigue (Shinar et al., 2006).
4.4.5 Parameters from EMGs and EOG
EMG is a signal generated by muscle contraction.
The amplitude of the signal decreases as the driver be-
gins to get tired (Chowdhury et al., 2018). However,
signals from EMG are complex and random (Kumar
et al., 2003).The EOG signal is the potential of the
electric field between the cornea and the retina, usu-
ally between 0.05 and 3.5 mV (Yue, 2011). Each eye
activity (blink, eye movement) changes this potential
and thus the EOG signal (Thorslund, 2003). Several
measurements can be used to analyze the eye condi-
tion of the fatigued driver.A blink is defined as the
contact of the upper and lower eyelid for at least 200 -
400 ms. The duration of the blink is therefore the time
that this contact between the eyelids lasts (Yue, 2011).
If the blink duration is longer than 0.5 ms then it is a
KEOD 2021 - 13th International Conference on Knowledge Engineering and Ontology Development
90

micro-sleep (Bando et al., 2017). Blink Frequency is
the number of blinks per minute, an increase in the
number of blinks indicates a state of fatigue, as it is
hard to keep your eyes open during this state. Blink
Amplitude is the electrical potential measured during
a blink. A normal blink varies between 100 - 400 µV.
PERCLOS is the percentage of time in one minute
when the eye is 80% closed (Administration, 1998).
Eyelid response time is the time it takes for the eye-
lid to reopen from the moment it is closed. This time
increases as the driver gets tired.
4.4.6 Skin Temperature (ST) and Galvanic Skin
Conductance (GSC)
Studies have tried to show an association between
skin temperature at certain body sites (nose, forehead)
and fatigue levels as presented in (Bando et al., 2017),
however the results are too insignificant. Galvanic
Skin Conductance also known as EDA (Electro Der-
mal Activity), skin conductance is used more in the
detection of stress than in the detection of fatigue as
suggested by the study in (Rigas et al., 2008).
5 KNOWLEDGE
REPRESENTATION USING
ONTOLOGY
According to (Gruber, 1993), ontology is ”an explicit
specification of a conceptualization”. (Studer et al.,
1998) defined ontology as ”an explicit and formal
specification of a shared conceptualization”, where
”conceptualization” refers to an abstract model of a
world phenomenon, and ”explicit” means that the
concepts used and the constraints on their use are
explicitly defined. ”Formal” means there is a rigor-
ous technique for its specification and verification.
”Shared” means that ontology captures knowledge
that is consensual and accepted by a group. Among
the various formalisms, we opted to edit our ontol-
ogy using Prot
´
eg
´
e (Musen, 2015) in OWL/RDF for-
mat. Among the various types of ontology proposed
by (Gomez-Perez et al., 2004) (high-level, generic,
domain, generic domain, etc.), our ontology contains
the definitions to model a knowledge (fatigue). Apart
from being an application ontology type, our ontology
also needs to be of the data and logic type (Roussey
et al., 2010) below: Data ontologies provide a struc-
tural and syntactic description of domain concepts
and their properties, where a concept is an aggregate
of data to which it is possible to associate constraints
from integrity on the values of these data. Logical on-
tologies contain logical descriptions of concepts and
relationships. Thy allow data integration from various
sources. They contain logical formulas to be used by
inference engines. These engines can validate an ab-
stract model underlying a conceptualization to detect
the class to which an instance belongs, or to recognize
the instances of a class and generate new knowledge
from rules.
5.1 Driver Fatigue Representation
Ontology is a good tool to represent contexts, and in
particular the driving context. In this work, we con-
sider a broader driving context. This driving con-
text is described by (Hina et al., 2018) as consist-
ing of three parts: the vehicle, the environment and
the driver. Together, they represent the driving con-
text and make it possible to describe the various driv-
ing situations. In this work, however, we are inter-
ested not on a driving context but on the context of
the driver’s physiological state, fatigue. This con-
text is composed of three sets: vehicle measurements,
physical measurements, and physiological measure-
ments. We represent driver fatigue in an ontologi-
cal way through different measures described in the
model. Ontological file have file extensions .owl, . rdf
or .xml. These files conform with the World Wild Web
Consortium agreement which describes all the stan-
dards to adopt for the ”semantic web”. Our ontology
on driver’s fatigue is based on three main classes that
describe our three concepts: vehicle measurements,
physical measurements, and physiological measure-
ments
5.2 Ontological Representation of
Vehicular Measurements
The Vehicle Measure class describes all the vehicle
measurements of our model. It is divided into 3 sub-
classes: SteeringWheelAngleMeasurement, YawAn-
gleMeasurement, VehicleBasedMeasurementFatigue.
The SteeringWheelAngleMeasurment is used to de-
scribe the various measurements derived from the
angle of a steering wheel. It is divided into 5
sub-classes which are: MeanSWA, FrequencySWA,
SWA measure, ApproximateEntropySWA, AngularVe-
locity (Figure 7) All these sub-classes represent mea-
surements from sensors or measurements calculated
from sensor data (such as frequency, mean or vari-
ance). These classes have ”DataProperties” of type
”hasSomeValue” which represents the value of the
measurement.The data property ”hasSWAMeasured”
describes a relation of membership of a float type
value to the SWA measure class. The data property
has for domain (or intersection) the SWA measure
Modelling and Detection of Driver’s Fatigue using Ontology
91
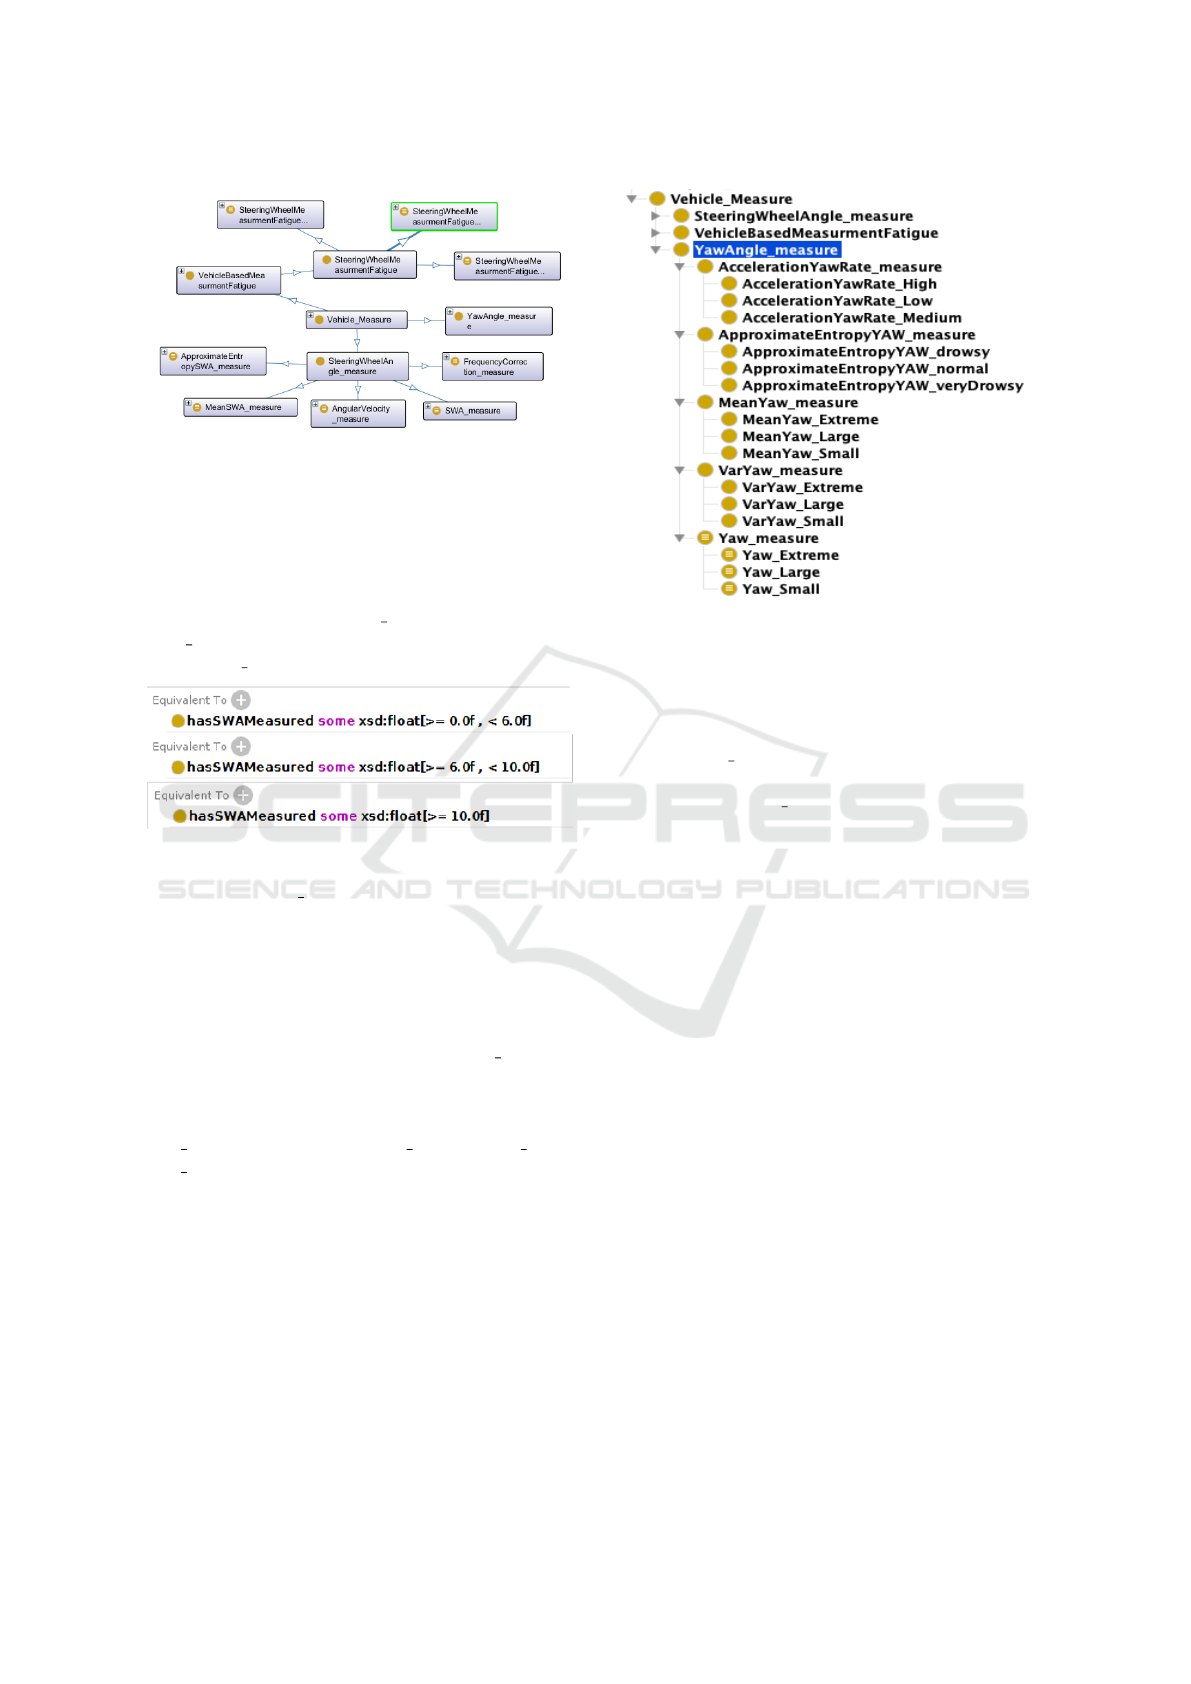
Figure 7: Vehicle fatigue detection qualified with steering
wheel angle measures (class representation).
class and for range a float type. The same rela-
tionships are applicable for the other classes. To
qualify these measures, the five sub-classes are di-
vided further into three (two for AngularVelocity) sub-
classes. As an example, SWA measure is divided into
SWA Extreme (more than 10
◦
), SWALarge (from 10
◦
to 6
◦
), SWA Small (from 6
◦
to 0
◦
) (Figure 8)
Figure 8: Equivalence to qualify SWA class.
The YawAngle Measure describes the different
measurements resulting from the yaw angle. It is di-
vided into 5 sub-classes, namely: MeanYaw, VarYaw,
Yaw, ApproximateEntropyYaw, and AngularVeloci-
tyYaw. All these sub-classes have DataProperties of
type hasSomeValue which represents the value of the
measurement. The data property hasYawAngleMea-
sured of float value related to the class Yaw measure.
The same relationships exist for other classes. To
quantify each of the five measures, each measure
is divided into three sub-classes. For example,
Yaw measure is divided into Yaw Extreme, Yaw large,
Yaw Small, signifying the three types of quantifying
the Yaw measurement. The same qualification of
measurements is applied to the sub-classes describing
steering wheel angle, resulting in a class qualification
as shown in the class hierarchy (Figure 9).
The VehicleBasedMeasurementFatigue class in-
fers a fatigue level using the vehicle parameters. This
qualification is different from the other classes being
a so-called ”knowledge” class. This class reports on
the state of qualification of other classes at a given
instant t.
Figure 9: Equivalence to qualify SWA class.
5.3 Ontological Representation of
Physical Measurements
The Physical measure class describes the physical
measurements related to a driver’s fatigue. It has
a sub-class, Facial measure, which describes the
driver’s facial measurements. This measurement is di-
vided into different sub-classes that represent regions
of the face (eyes, mouths, head). Each of these classes
has its own sub-classes, further describing the class.
For example, the eye closure measurements.In the
same way as the vehicle parameters, the physical pa-
rameters have data properties that allow each class to
describe a relationship of a measurement value from
the sensors or from a calculation. (Figure 10)
5.4 Ontological Representation of
Physiological Measurements
The representation of the ontology of physiological
measurements follows the same approach as the other
representations (see Section 5.2 and 5.3)
5.5 Rules for Detecting and Reasoning
on Driving Fatigue
Once the general fatigue model for qualifying the data
has been implemented in the ontology, rules must be
established to standardize our ontology. It is on these
rules that the level of fatigue that will be inferred is
based. The rules use instances of classes or individu-
als in order to operate the reasoning. SWRL (Seman-
tic Web Rule Language) is the language used to ex-
KEOD 2021 - 13th International Conference on Knowledge Engineering and Ontology Development
92
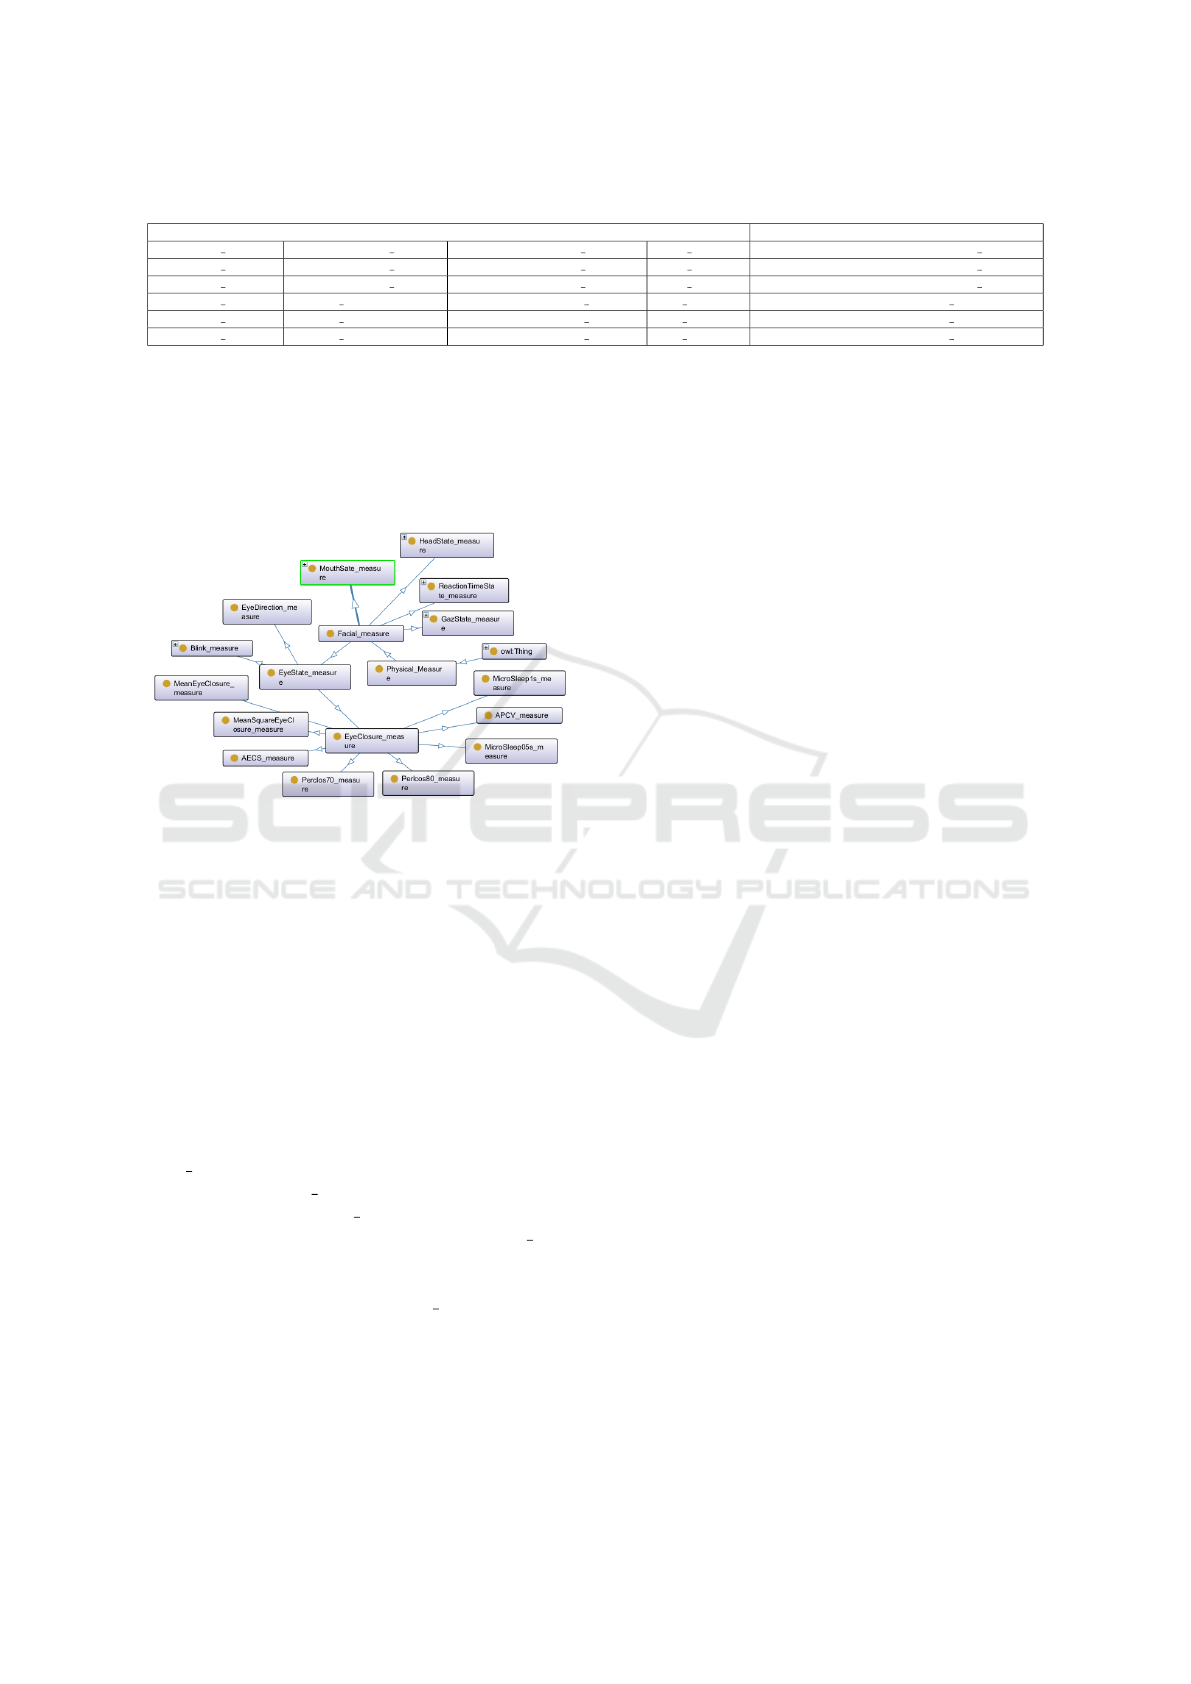
Table 1: Various vehicular parameters combination and the resulting driver fatigue level.
Inputs Output
MeanSWA Small AngularVelocity Normal FrequencyCorrection Low SWA Small SteeringWheelMeasurmentFatigue Low
MeanSWA Large AngularVelocity High FrequencyCorrection Normal SWA Large SteeringWheelMeasurmentFatigue Medium
MeanSWA Extreme AngularVelocity High FrequencyCorrection High SWA Extreme SteeringWheelMeasurmentFatigue High
MeanSWA Large VarYaw Large AccelerationYawRate Medium Yaw Large YawAngleMeasurmentFatigue Medium
MeanSWA Small VarYaw Small AccelerationYawRate Low Yaw Small YawAngleMeasurmentFatigue Low
MeanSWA Small VarYaw Extreme AccelerationYawRate High Yaw Extreme YawAngleMeasurmentFatigue High
press first order rules. The majority of rules are of the
type: If ”an instance of class A” and ”an instance of
the class X1” and ”has an attribute Y1” and ”Y1 sat-
isfies such conditions” and ”an instance of the class
X2” and ”has an attribute Y2” and ”Y2 satisfies such
conditions” then ”the instance of class A belongs to
class B”.
Figure 10: Sub-classes derived from facial measurements
with d classes describing eye closure.
Written rules are not based on precise values but
on fuzzy values, this is based on the concept of fuzzy
logic [46]. Indeed, parameter values are qualified
according to fuzzy notions such as: strong, very
strong, a little bit, little, etc. which use these fuzzy
values to infer knowledge from the written rules.
In our case, the type of rules on fatigue level are
simpler because the instances of the classes of the
model parameters have already been qualified.The
rules that are used in ontology are as follows: If
”there is an instance of the SteeringWheelMeasure-
mentFatigue class” and ”there is an instance of the
SWA Extreme class” and ”there is an instance of
the AngularVelocity High class” and ”there is an
instance of the MeanSWA Extreme class” and ”there
is an instance of the FrequencyCorrection High
class” then ”the instance of the Steering-
WheelMeasurementFatigue class belongs to the
SteeringWheelMeasurementFatigue High class”.
Table 1 summarizes the rules, implemented in the on-
tology, to infer a level of fatigue from measurements
of steering wheel angle and yaw angle. For each
Input (Qualified Class), an Output is associated with
it (Qualitative fatigue measurement from steering
wheel angle and yaw angle). By writing rules like
this, one can associate qualified classes with a level of
fatigue. To limit the number of rules, it makes sense
not to merge all the parameter but to have sub-merge
that allows intermediate fatigue states to be reported.
The principle of sub-merge shows that it is possible
to efficiently reduce the number of rules to be written
by merging a large set of data. Currently, there are 6
rules in Table 1. We can generate more rules but we
are still conducting experiments. A larger number of
rules and the results of these experiments will appear
in our next publication.
5.6 Prospect for Data Fusion
To use our sets of rules in an optimal way, it is pos-
sible to use a weight system, so that some parame-
ters are more valuable than others. This way, the de-
termining parameters will have a greater importance
in detecting fatigue or use a neural network so that
the inference engine (reasoner) uses only the rules
that are useful for a given context (the neural network
would be trained using the different contexts that are
saved by an intelligent system).
6 USE CASE SIMULATION
In order to test our fatigue model, and more largely
our intelligent system, we need data that can be used
by the system. For simplicity we use a driving sim-
ulator to generate data. Carla Simulator, is an open-
source driving simulator for research in autonomous
car (Dosovitskiy, 2017). This simulator offers a large
choice of modularity in the selection of driving en-
vironments, climatic conditions, circuit choices, etc.
It is also possible to simulate vehicle data such as
steering wheel angle, yaw angle and angular veloc-
ity. These parameters are present in our model and
are used to calculate other sub-parameters. In order
to create a use case, we need to integrate our intel-
ligent system which is composed of different mod-
ules described in Figure 2 (data extraction and com-
putation, ontology control module and knowledge re-
trieval module). This allows our intelligent system to
retrieve the data and process it in parallel with the use
Modelling and Detection of Driver’s Fatigue using Ontology
93
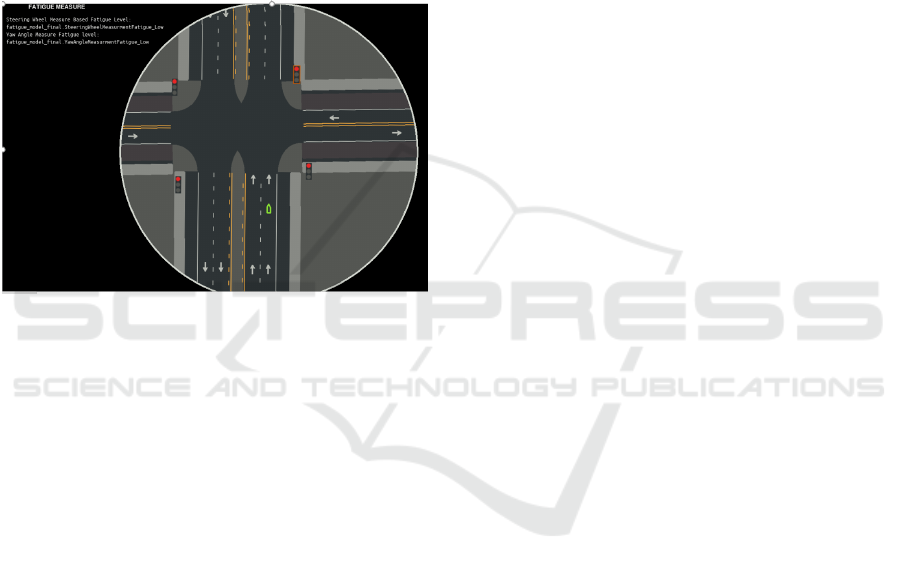
of the simulator. Thus, we can display the newly cre-
ated information that serves as an alert to the driver
(Figure 11). As shown, two parameters are fused.
The ”SteeringWheelMeasurementFatigue” is derived
from the steering wheel angle while ”YawAngleMea-
surementFatigue” is derived from the yaw angle. The
mode used in this exercise, however, does not allow
handling the vehicle with precisions unlike the nor-
mal mode. This is due to the technical constraints of
the computer. Hence, the integration of the intelligent
system in the simulator is a future work so that it will
become a more appropriate simulation tool with more
appropriate resources and capacity.
Figure 11: Carla simulator with the expert system fatigue.
7 CONCLUSIONS
In this paper, three factors, namely the vehicular data
as well as the driver’s physical and physiological data
are considered and combined to determine the level
of driver’s fatigue. Each of these three factors are fur-
ther subdivided into smaller measurable data, each of
which becomes a contributing factor in the global as-
sessment of a driver’s fatigue. A simple use case sce-
nario is tested to detect driver’s fatigue. The research
is ongoing, and future work is ongoing to determine
the mathematical or computational method of com-
bining them. The main idea is to supervise and mea-
sure each of these factors in order to perceive the en-
vironment and the level of driver’s fatigue. Ontology
is used for knowledge representation and SWRL rules
are used to compute for the level or degree of driver’s
fatigue. In case of a detection of a dangerous level of
fatigue, a notification is sent to the driver. Altogether,
this methodology will be integrated into an intelligent
system that is capable of detecting driver’s fatigue and
in general, contribute to safe road driving.
REFERENCES
Abdul Rahim, H., Dalimi, A., and Jaafar, H. (2015). De-
tecting Drowsy Driver Using Pulse Sensor. Jurnal
Teknologi, 73(3).
Abtahi, S., Behnossh, H., and Shervin, S. (2011). Driver
Drowsiness Monitoring Based on Yawning Detection.
IEEE.
Administration, F. H. (1998). PERCLOS: A Valid Psy-
chophysiological Measure of Alertness As Assessed
by Psychomotor Vigilance.
Albus, J. S. (1992). A Theory of Intelligent Systems.
Azim, T., Jaffar, M. A., and Mirza, A. M. (2014). Fully au-
tomated real time fatigue detection of drivers through
Fuzzy Expert Systems. Applied Soft Computing.
Bando, S., Oiwa, K., and Nozawa, A. (2017). Evaluation of
dynamics of forehead skin temperature under induced
drowsiness. IEEJ Trans Elec Electron Eng, 12.
Begum, S. (2013). Intelligent driver monitoring systems
based on physiological sensor signals: A review. In
(ITSC).
Bergasa, L., Nuevo, J., Sotelo, M., Barea, R., and Lopez,
M. (2006). Real-Time System for Monitoring Driver
Vigilance. IEEE Trans. Intell. Transport. Syst., (1).
Bishop, R. (2000). Intelligent vehicle applications world-
wide. IEEE Intell. Syst., 15(1):78–81.
Brookhuis, K. A. and de Waard, D. (2010). Monitoring
drivers’ mental workload in driving simulators using
physiological measures. Accident Analysis & Preven-
tion, 42(3).
Chen, Z., Wu, C., Zhong, M., Lyu, N., and Huang, Z.
(2015). Identification of common features of vehicle
motion under drowsy/distracted driving: A case study
in Wuhan, China. Accident Analysis & Prevention.
Chowdhury, A., Shankaran, R., Kavakli, M., and Haque,
M. M. (2018). Sensor Applications and Physiological
Features in Drivers’ Drowsiness Detection: A Review.
IEEE.
Delgado-Bonal, A. and Marshak, A. (2019). Approximate
Entropy and Sample Entropy: A Comprehensive Tu-
torial. Entropy, 21(6):541.
Dingus, T. A. (1985). Development of models for detection
of automobile driver impairment. PhD thesis, Faculty
of Virginia Polytechnic Institute.
Dosovitskiy, A. (2017). CARLA: An Open Urban Driving
Simulator. page 16.
Fan, X. (2007). Yawning detection for monitoring driver
fatigue. Hong Kong, page 5.
Friedrichs, F. and Yang, B. (2010). Camera-based drowsi-
ness reference for driver state classification under real
driving conditions. La Jolla, CA, USA. IEEE.
Furman, G. D., Baharav, A., Cahan, C., and Akselrod, S.
(2008). Early detection of falling asleep at the wheel:
A Heart Rate Variability approach. In 2008 Comput-
ers in Cardiology, Bologna, Italy. IEEE.
Gomez-Perez, A., Fernandez-Lopez, M., and Corcho,
O. (2004). Ontological Engineering: With Exam-
ples from the Areas of Knowledge Management, E-
Commerce and the Semantic Web. page 110.
KEOD 2021 - 13th International Conference on Knowledge Engineering and Ontology Development
94

Gruber, T. R. (1993). A translation approach to portable
ontology specifications. Knowledge Acquisition.
Hargutt, V. and Kruger, H.-P. (2001). Eyelid movements
and their predictive value for fatigue stages.
Hartley, L., Horberry, T., Mabbott, N., and Krueger, G. P.
(2000). Review of fatigue detection and prediction
technologies. National Road Transport Commission.
Hina, M. D., Thierry, C., Soukane, A., and Ramdane-
Cherif, A. (2018). Cognition of Driving Context for
Driving Assistance. page 11.
Ji, Q., Zhu, Z., and Lan, P. (2004). Real-Time Nonintrusive
Monitoring and Prediction of Driver Fatigue. IEEE.
Jorion, P. (1989). Principes Des Systemes Intelligents.
Karray, F., Karray, F. O., and Silva, C. W. D. (2004). Soft
Computing and Intelligent Systems Design: Theory,
Tools, and Applications. Pearson Education.
Kasabov, N. and Filev, D. (2006). Evolving Intelligent Sys-
tems: Methods, Learning, & Applications. In Inter-
national Symposium on Evolving Fuzzy Systems, Am-
belside, UK. IEEE.
Krajewski, J., Sommer, D., Trutschel, U., Edwards, D., and
Golz, M. (2009). Steering Wheel Behavior Based Es-
timation of Fatigue. pages 118–124, Big Sky, Mon-
tana, USA. University of Iowa.
Kumar, D., Pah, N., and Bradley, A. (2003). Wavelet anal-
ysis of surface electromyography to determine muscle
fatigue. IEEE Trans. Neural Syst. Rehabil. Eng.
Li, Z., Chen, L., Peng, J., and Wu, Y. (2017a). Automatic
Detection of Driver Fatigue Using Driving Operation
Information for Transportation Safety. Sensors.
Li, Z., Li, S., Li, R., Cheng, B., and Shi, J. (2017b). On-
line Detection of Driver Fatigue Using Steering Wheel
Angles for Real Driving Conditions. Sensors.
Li, Z., Song, L., Yang, Q., Chen, S., and Chen, L. (2020).
Support vector machine filtering data aid on fatigue
driving detection.
Liu, C. C., Hosking, S. G., and Lenn
´
e, M. G. (2009). Pre-
dicting driver drowsiness using vehicle measures: Re-
cent insights and future challenges. Journal of Safety
Research, (4).
Mu, Z., Hu, J., and Min, J. (2017). Driver Fatigue Detection
System Using Electroencephalography Signals Based
on Combined Entropy Features. Applied Sciences.
Musen, M. A. (2015). The prot
´
eg
´
e project: a look back and
a look forward. AI Matters, 1(4):4–12.
Observatory, E. R. S. (2019). Annual Accident Report.
Technical report.
Organization., W. H. (2018). World Health Or-
ganization. (2018). Global Status Report on
Road Safety 2018. https://www.who.int/violence
injury prevention/road safety status/2018/en/.
Technical report.
Polychronopoulos, A., Amditis, A., and Bekiaris, E. (2004).
Information data flow in awake multi-sensor driver
monitoring system. In IEEE Intelligent Vehicles Sym-
posium, 2004, pages 902–906, Parma, Italy. IEEE.
Ramzan, M., Khan, H. U., Awan, S. M., Ismail, A., Ilyas,
M., and Mahmood, A. (2019). A Survey on State-of-
the-Art Drowsiness Detection Techniques. IEEE.
Reddy, B., Kim, Y.-H., Yun, S., Seo, C., and Jang, J. (2017).
Real-Time Driver Drowsiness Detection for Embed-
ded System Using Model Compression of Deep Neu-
ral Networks. Honolulu, HI, USA. IEEE.
Rigas, G., Katsis, C. D., Bougia, P., and Fotiadis, D. I.
(2008). A reasoning-based framework for car driver
and stress prediction. Ajaccio, France. IEEE.
Rondik, T. and Mautner, P. (2013). Cognitive event-related
potential waveform latency determination: Based on
result of matching pursuit algorithm and Hilbert-
Huang transform. Hangzhou, China. IEEE.
Roussey, C., Soulignac, V., Champomier, J. C., Abt, V., and
Chanet, J. P. (2010). Ontologies in Agriculture.
Salmon, P. M., Read, G. J., Beanland, V., Thompson, J.,
Filtness, A. J., Hulme, A., McClure, R., and John-
ston, I. (2019). Bad behaviour or societal failure? Per-
ceptions of the factors contributing to drivers’ engage-
ment in the fatal five driving behaviours.
Schleicher, R., Galley, N., Briest, S., and Galley, L. (2008).
Blinks and saccades as indicators of fatigue in sleepi-
ness warnings: looking tired? Ergonomics, 51.
Shinar, Z., Akselrod, S., Dagan, Y., and Baharav, A. (2006).
Autonomic changes during wake–sleep transition: A
heart rate variability based approach.
Siegmund, G. P., King, D. J., and Mumford, D. K. (1996).
Correlation of Steering Behavior with Heavy-Truck
Driver Fatigue.
Studer, R., Benjamins, V., and Fensel, D. (1998). Knowl-
edge engineering: Principles and methods. Data &
Knowledge Engineering.
Sun, Y., Yu, X., Berilla, J., and Liu, Z. (2011). An in-vehicle
physiological signal monitoring system for driver fa-
tigue detection. page 16.
Svensson, U. (2004). Blink behaviour based drowsiness de-
tection – method development and validation.
Thiffault, P. and Bergeron, J. (2003). Monotony of road en-
vironment and driver fatigue: a simulator study. Acci-
dent Analysis & Prevention, (3).
Thorslund, B. (2003). Electrooculogram analysis and de-
velopment of a system for defining stages of drowsi-
ness. PhD thesis.
Ting, P.-H., Hwang, J.-R., Doong, J.-L., and Jeng, M.-C.
(2008). Driver fatigue and highway driving: A simu-
lator study. Physiology & Behavior, 94(3).
Vicente, J., Laguna, P., Bartra, A., and Bail
´
on, R. (2016).
Drowsiness detection using heart rate variability. Med
Biol Eng Comput, (6).
Weiwei Liu, Haixin Sun, and Weijie Shen (2010). Driver
fatigue detection through pupil detection and yawing
analysis. Chengdu, China. IEEE.
Yue, C. (2011). EOG Signals in Drowsiness Research.
Zhao, C., Zhao, M., Liu, J., and Zheng, C. (2012). Elec-
troencephalogram and electrocardiograph assessment
of mental fatigue in a driving simulator.
Zhenhai, G., DinhDat, L., Hongyu, H., Ziwen, Y., and
Xinyu, W. (2017). Driver Drowsiness Detection Based
on Time Series Analysis of Steering Wheel Angular
Velocity. In (ICMTMA), Changsha, China. IEEE.
Modelling and Detection of Driver’s Fatigue using Ontology
95
