
Product Embedding for Large-Scale Disaggregated Sales Data
Yinxing Li
a
and Nobuhiko Terui
b
Graduate School of Economics and Management, Tohoku University, Japan
Keywords: LDA2Vec, Item2Vec, Demographics, Hierarchical Model, Customer Heterogeneity, Topic Model.
Abstract: This paper recommends a system that incorporates the marketing environment and customer heterogeneity.
We employ and extend Item2Vec and Item2Vec approaches to high-dimensional store data. Our study not
only aims to propose a model with better forecasting precision but also to reveal how customer demographics
affect customer behaviour. Our empirical results show that marketing environment and customer
heterogeneity increase forecasting precision and those demographics have a significant influence on customer
behaviour through the hierarchical model.
1 INTRODUCTION
Marketing data are expanding in several modes
nowadays, as the number of variables explaining
customer behavior has greatly increased, and
automated data collection in the store has also led to
the recording of customer choice decisions from large
sample sizes. Thus, high-dimensional models have
recently gained considerable importance in several
areas, including marketing. Despite the rapid
expansion of available data, Naik et al. (2008)
mentioned that many algorithms do not scale linearly
but scale exponentially as the dimension of variable
expends. This highlights the urgent need for faster
numerical methods and efficient statistical estimators.
While some previous researches focused on the
dimension reduction approaches for the products (e.g.,
Salakhutdinov and Mnih, 2008, Koren et al., 2009,
Paquet and Koenigstein, 2013), learning the product
similarities is the final goal rather than the forecasting.
After Word2Vec was proposed (Mikolov et al.,
2013) regarding natural language processing, which
is designed to deal with high-dimensional sparse
vocabulary data, many studies applied and extended
the model to other fields, such as item
recommendation, including Prod2Vec (Grbovic et al.
2015), Item2Vec (Barkan and Koenigstein, 2016),
and Meta-Prod2Vec (Vasile et al., 2016). These
approaches indicate that the Word2Vec framework
outperforms existing econometric models in sales
a
https://orcid.org/0000-0001-9335-9802
b
https://orcid.org/0000-0003-4868-0140
prediction. Besides, Pennington et al. (2014)
proposed a model which factorize a large-scale word
matrix to improve the performance of paring the
similar words. This approach is further employed for
parsing tasks by Levy and Goldberg (2014).
However, the main limitation of the existing
approaches is the lack of interpretability of the model.
Similar to the most nonlinear machine learning
approach, the Word2Vec framework cannot evaluate
the effect of variables, which may limit its
implications in the marketing field, such as the
effective personalization and targeting (
Essex, 2009
).
Although extension models, such as Prod2Vec,
involve various marketing variables such as price and
customer demographic data, the role of the variables
in forecasting is still not discussed.
In light of the limitations mentioned above, we
propose a Word2Vec based framework that
incorporates marketing variables. The main research
purposes are to (i) improve the precision of
forecasting by involving the hierarchical structure of
the Word2Vec framework with marketing mix
variables, and (ii) investigate and interpret the role of
the marketing mix variables.
In order to fulfil these aims, we analyze the large-
scale sales data of a retail store for our empirical
application. In addition to daily sales data for each
unique customer, our data also include daily price
information, several promotional information, and
demographic data for each customer. Our approach is
Li, Y. and Terui, N.
Product Embedding for Large-Scale Disaggregated Sales Data.
DOI: 10.5220/0010677500003064
In Proceedings of the 13th International Joint Conference on Knowledge Discovery, Knowledge Engineering and Knowledge Management (IC3K 2021) - Volume 1: KDIR, pages 69-75
ISBN: 978-989-758-533-3; ISSN: 2184-3228
Copyright
c
2021 by SCITEPRESS – Science and Technology Publications, Lda. All rights reserved
69
based on LDA2Vec (Moody, 2016), which is an
extension of Word2Vec involving the topic model
proposed by Blei et al. (2003). All the models from
previous studies are not only structurally unable to
represent customer heterogeneity in the marketing
environment but also lack interpretability for the
results. Compared to previous studies mentioned
above, our proposed model contributes both to higher
precision for forecasting by incorporating the
marketing environment and customer heterogeneity
into the model, and better interpretability with a
hierarchical model.
We explain our model in Section 2. In Section 3 we
present the empirical results for sales forecasting and
demonstrate the performance and interpretability of
our proposed model. We conclude and summarize the
future implications in Section 4.
2 MODEL
We extend the LDA2Vec model mainly in two ways:
(i) considering the marketing environment and (ii) a
hierarchical structure that considers customer
heterogeneity based on customer demographic data.
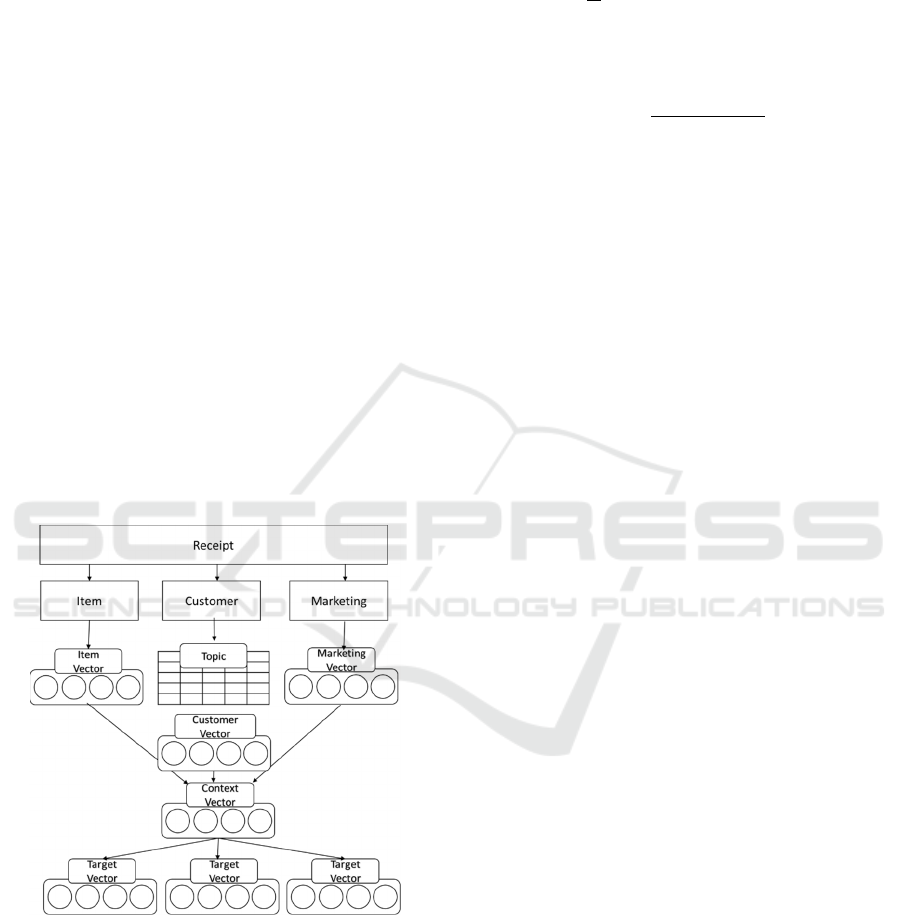
Fig 1 shows the framework of our model.
Figure 1: Framework of the model.
2.1 Skip-gram Negative Sampling
We employ skip-gram negative-sampling (SGNS)
from Item2Vec (Barkan and Koenigstein, 2016) to
propose a model that utilizes item-wide, customer-
wide, and marketing-wide feature vectors.
Given a sequence of items 𝑥
for a finite item
basket 𝐼𝑥
, the skip-gram model maximizes
the following term
1
𝑀
log𝑝𝑥
|𝑥
,
(1)
where 𝑀 is the number of items in the same market
basket as the receipt, and 𝑝𝑥
|𝑥
is defined as
𝑝𝑥
|𝑥
exp𝚤⃗
𝚤⃗
∑
exp𝚤⃗
𝚤⃗
.
(2)
𝚤⃗
represents the V-dimensional latent vector that
corresponds to item j, where V is a parameter that
represents the dimension of the vector. This formula
means, by transforming the items into latent vectors,
the conditional probability of purchase for product j
when item a is in the market basket is represented by
the inner product of their latent vectors. The latent
vector is transformed from
𝚤
⃗
𝑊
𝑥
,
(3)
where 𝚤⃗
is the item vector for product j, 𝑾
𝒊
reflects
the coefficient vector, and 𝑥
is the dummy variable
for product j. As Eq (1) is inefficient when the
dimension of an item is large, negative sampling is
employed for solving the computational problem. We
replace Eq. (1) with
𝑝𝑥
|𝑥
σ𝚤
⃗
𝚤
⃗
σ𝚤⃗
𝚤⃗
,
(4)
where σ
𝑥
1/1exp
𝑥
, and N is a
hyperparameter that represents the number of
negative examples to be selected per positive example.
We sample a negative item 𝑥
from the unigram
distribution raised to the 3rd/4th power, as the
empirical study shows that it outperforms the unigram
distribution (Mikolov et al., 2013).
Eq. (4) represents the skip-gram model from
Item2Vec, which only considers the item. The only
data in this model is the item, which means Item2Vec
ignores customer information. We further modified
Eq. (4) by employing the approach from LDA2Vec
(Moody, 2016) as follows:
𝑝𝑥
|𝑥
3 σ𝑐
⃗
𝚤
⃗
σ𝑐⃗
𝚤⃗
,
(5)
where
𝑐
⃗
𝚤
⃗
𝑑
⃗
.
(6)
𝑐⃗
is defined as the context vector, which is
explicitly designed to be the sum of an item vector 𝚤⃗
for product a and a customer vector 𝑑
⃗
for customer
h. This structure is designed to represent customer-
wide relationships by incorporating a new term 𝑑
⃗
for
each customer while preserving the 𝚤⃗
for item-wide
KDIR 2021 - 13th International Conference on Knowledge Discovery and Information Retrieval
70

relationships.
Next, for better interpretable representations,
rather than producing a dense vector for every
customer independently, 𝑑
⃗
is designed to be a mixed
membership of common topic vectors. When defining
the 𝑡
⃗
as a V-dimensional topic vector for topic k, the
𝑑
⃗
can be represented by
𝑑
⃗
𝑝
∙𝑡
⃗
𝑝
∙𝑡
⃗
⋯𝑝
∙𝑡
⃗
,
(7)
where the weight 0𝑝
1 is a fraction that
denotes the membership of customer h in topic k,
enforcing the constraint that
∑
𝑝
1. Note that
topic vector 𝑡
⃗
can be interpreted as a common
feature as it is shared among all customers, and the
influence of each topic vector is modulated by the
weight 𝑝
that is unique to each customer.
2.2 Vectorizing the Marketing
Environment
In addition to the product and customer, we consider
the marketing environment, such as promotional
information, which also plays an important role when
customers choose items, as shown in previous studies.
First, we categorize all the combinations of marketing
environments. That is, assuming we use two binary
variables, 𝑧
, 𝑧
, as marketing
environment (whether there are promotions and
discounts for the product), we categorize the
marketing environment by considering all the
patterns of variable combinations, 𝑧
𝑓𝑧
0,𝑧
0
1,0,0,0
,
𝑧
𝑓𝑧
0,𝑧
1
0,1,0,0 , 𝒛
𝒑𝟑
𝑓𝑧
1,𝑧
0 0,0,1,0 , 𝑧
𝑓𝑧
1,𝑧
1
0,0,0,1
. 𝑧
is a categorical
dummy variable, which means the pattern of the
marketing environment, similar to Eq (3). We
vectorize the categorical variable 𝑧
as
𝑚
⃗
𝑾
𝒎
𝑧
,
(8)
where 𝑚
⃗
is the marketing vector for marketing
pattern p and 𝑾
𝒎
stands for the coefficient vector.
We then incorporate the extracted marketing vector
into the context vector in (7) as
𝑐⃗
𝚤⃗
𝑑
⃗
𝑚
⃗
.
(9)
The context vector is now defined as the sum of the
item, customer, and marketing vectors. Compared to
Eq. (7), the choice of target item of a customer is
designed to stem partially from the marketing
environment.
2.3 Hierarchical Model for the
Customer Heterogeneity
We impose the marketing vector into the skip-gram
model to reflect the influence of the marketing
environment. However, Eq. (9) may still have
limitations in its structure, as we did not consider
customer heterogeneity: simply adding three vectors
implicitly assumes that the influence of each vector is
the same among customers. That is, discounts or
promotions would have the same influence on all
customers. Thus, we extended Eq. (9) by
incorporating customer heterogeneity as follows:
𝑐
⃗
𝛽
𝚤
⃗
𝛽
𝑑
⃗
𝛽
𝑚
⃗
.
(10)
where 𝛽
, 𝛽
, 𝛽
represent the weights of the three
vectors for customer h, respectively. Note that
𝛽
,𝑣 1,2,3 are always non-negative and sum to
unity, as this change allows us to interpret the weight
of vectors as percentages rather than unbounded
weights. For a better understanding, we define the
𝛽
as vector probability of the v-th vector for
customer h in this study. Next, as interpreting the
factor of customer behavior is one of our research
interests, we also propose a hierarchical structure for
vector probability using customer demographic data,
defining that
𝛽
𝛽
ℎ
′
∑
𝛽
ℎ
′
3
1
.
(11)
Then, we propose the hierarchical model as
𝛽
𝜶
𝒁
𝜀
, 𝜀
~𝑁
0,𝜎
(12)
where 𝒁
is the demographic data for customer h and
𝜶
is coefficients vector.
2.4 Model Optimization
We optimize the model by minimizing the total loss
given by
𝐿𝐿
𝐿
𝐿
.
(13)
The first two terms on the right-hand side of the
equation follow Moody (2016). 𝐿
is the loss from
negative sampling, derived from Eq. (5), defined as
𝐿
logσ𝑐
⃗
𝚤
⃗
logσ𝑐⃗
𝚤⃗
.
(14)
The second term, 𝐿
, is defined as the loss of
sparsity of the customer weight 𝑝
in Eq. (7),
represented by the Dirichlet likelihood with a low
concentration parameter 𝛼,
ℒ
𝜆
𝛼1
log𝑝
,
(15)
Product Embedding for Large-Scale Disaggregated Sales Data
71
where 𝜆 is a tuning parameter that controls the
strength of the loss and 𝛼 is a tuning parameter that
controls the sparseness of the customer weight. As
this term measures the likelihood of customer h in
topic k summed over all available customers, ℒ
encourages customer weight vectors to become more
concentrated, which improves interpretability as
customers are more likely to belong to fewer topics.
The last term, 𝐿
is defined as the loss of the
hierarchical structure proposed in Eq. (12), which is
represented by the mean squared error (MSE) as
𝐿
𝛿
1
𝑁
𝛽
𝜶
𝒁
,
(16)
where 𝛿 is a tuning parameter that controls the
loss strength. When 𝛿 is smaller, the vector
probability will be less interpreted by the
demographic data, and the interpretability will
increase if 𝛿 increases.
3 RESULTS AND DISCUSSION
3.1 Data
We applied our model to daily scanner sales data from
a store in Japan. The data were recorded between
January 2, 2000, and December 5, 2001. There were
56,630 receipts generated by 1,476 unique customers
in total; the dataset included 11,983 unique items, and
the mean number of items in each receipt was 8.83.
We used binary factors “discount,” “promotion,” and
“weekday” as marketing environment variables in
this empirical study, and 12 variables including age,
family members, job, etc., as customer demographic
data. The details of the demographic variables are
presented in Table 1.
Table 1: Demographic variables.
3.2 Model Comparison
We compare the three models according to the
context vector composition as listed in Table 2. We
use the grid search method for tuning the parameters,
including vector dimension V (10, 20, …, 100), topic
dimension K (5, 10, … 50), and tuning parameters 𝜆,
𝛼, 𝛿 in the loss function for each model.
Table 2: Model Comparison.
Model Context Vector
Model 1
LDA2Vec
𝑐⃗
𝚤⃗
𝑑
⃗
Model 2
LDA2Vec+Marketing
𝑐⃗
𝚤⃗
𝑑
⃗
𝑚
⃗
Model3
LDA2Vec+Marketing+H
𝑐
⃗
𝛽
𝚤⃗
𝛽
𝑑
⃗
𝛽
𝑚
⃗
We retained the last receipt of 1000 customers as
test data. Following the related empirical studies (e.g.,
Le et al., 2007, Caselles-Dupré et al., 2018), we
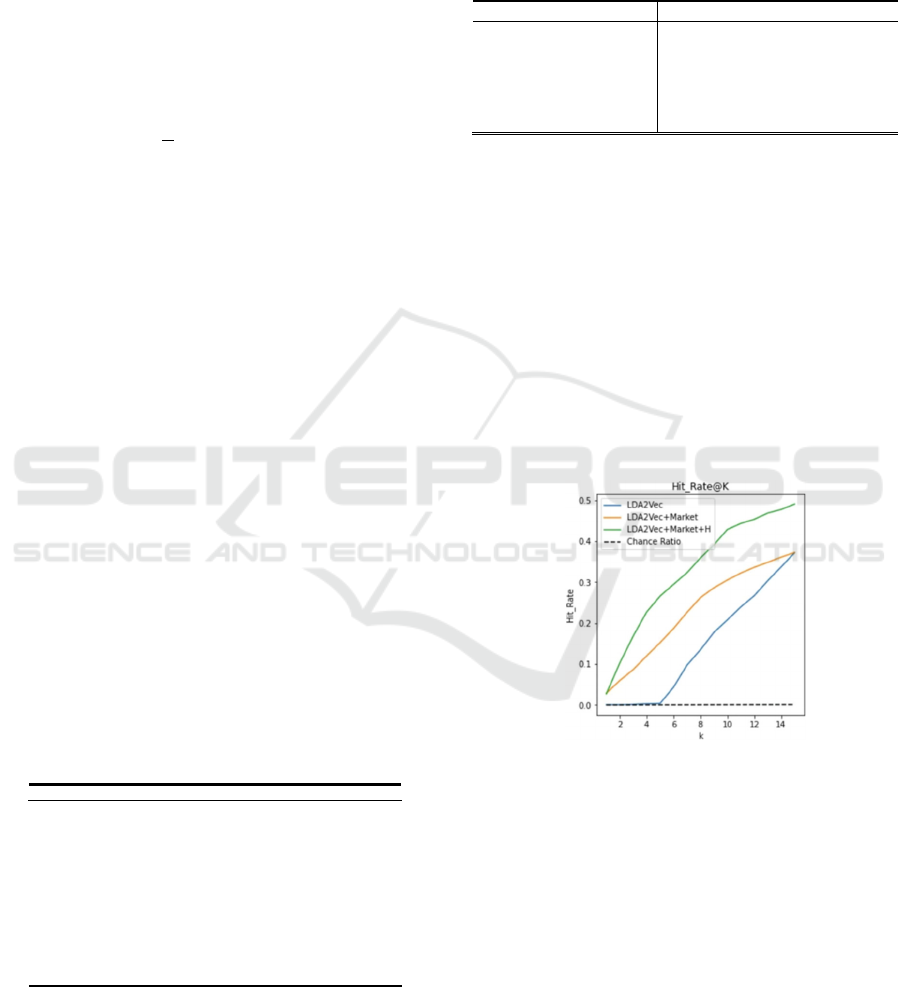
evaluated the models with a Hit ratio at K (HR@K).,
which is equal to 1 if the test item appears in the list
of K, predicted items, otherwise 0. The result is
shown in Fig 2.
The results show that both the marketing
environment and hierarchical structure improve
forecasting accuracy. Specifically, when K is smaller
than 5, our proposed models (Models 2 and 3)
significantly outperformed the benchmark models.
This shows that our proposed model enhances
practicality in real business scenarios.
Figure 2: Hit rate @ K.
3.3 Parameter Estimates
We explain the parameter estimates from Model 3, as
it performs best among all models.
(i) Topic vector
Considering the mixed structure in Eq. (7) and the
context vector in (10), the formula ensures that the
topic vector 𝑡
⃗
and item vector 𝚤⃗
operate in the same
space. This allows us to list the most similar words
given a topic vector by simply calculating the
similarity between the word and topic vectors. The
top words for each topic are shown in Fig. 3. The item
Variables Type Description
age numeric The age of the customer.
family numeric The number of family members of the customer.
time numeric The time cost for arriving at the store.
walk dummy If the customer walks to the store.
bike/bicycle dummy If the customer uses a bike or bicycle.
Car (no drive) dummy If
the
customer
reaches
the
store
by
car,
but
not
as
a
driver.
car(drive) dummy If the customer drive to the store.
parttime dummy If the customer has a part-time job.
fulltime dummy If the customer has a full-time job.
unknown dummy If the job of the customer is unknown.
housework dummy If the customer is a homemaker.
Work home dummy If the customer works at home.
KDIR 2021 - 13th International Conference on Knowledge Discovery and Information Retrieval
72
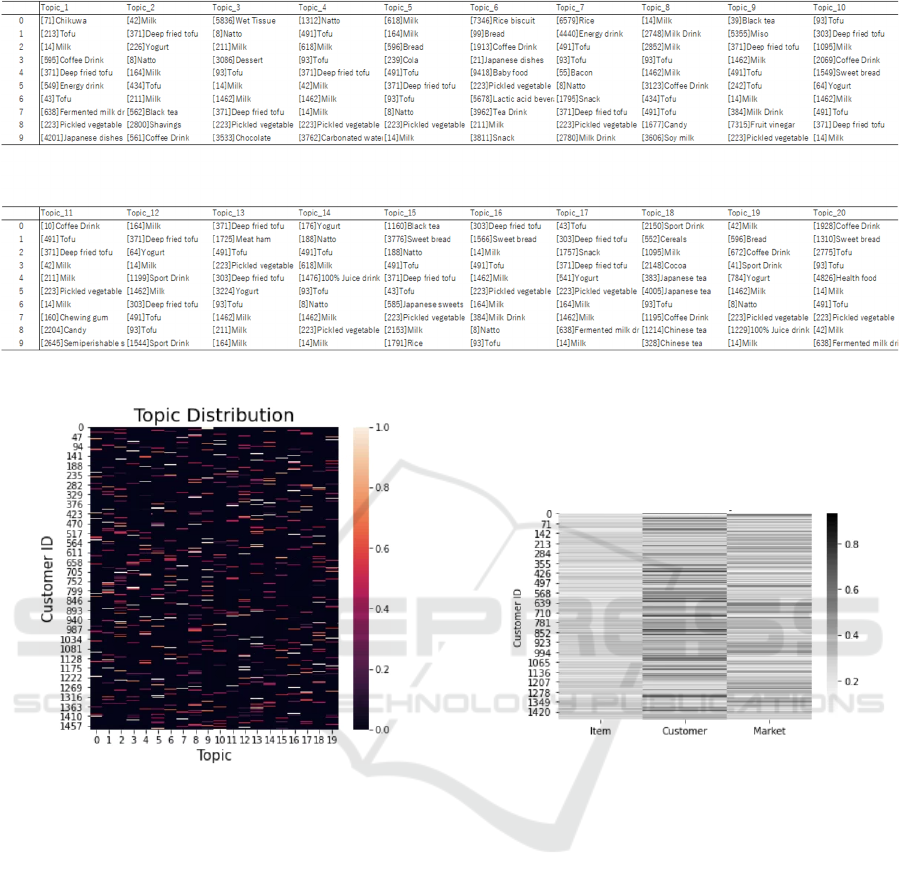
Figure 3: Topic Interpretation.
Figure 4: Topic Distribution.
ID and its category are displayed, that is, “[213] Tofu”
means the item id is 213 and it belongs to the “Tofu”
category.
Fig 4 shows that most customers are concentrated
on a few topics, which means the interpretation for
each customer is relatively easy. Considered together
with Fig 3, we can understand the preference of an
individual customer. For example, if a customer’s
topics are distributed in Topic 19 and Topic 4, we can
interpret that this customer mainly has two shopping
patterns – one is the combination of milk, bread, and
coffee (Topic 19), maybe for breakfast, and another
is the combination of Natto and tofu (Topic 4), maybe
for lunch or dinner.
(ii) Vector probability 𝛽
Fig 5 shows the estimated 𝛽
. The figure in the upper
panel shows the vector probability for all customers,
while the bottom panel shows the customers sorted by
vector probability of item, customer, and marketing
vector. As we mentioned, vector probability 𝛽
can
be interpreted as the influence of vector v for
customer h.
Figure 5: (a) Overview of vector probability.
We can conclude that the customer vector has the
biggest influence overall, followed by the marketing
vector; the item vector has the smallest influence.
This can be explained by the fact that most customers
(i.e., customer #19, #435) behave according to their
own interests, and are hardly affected by the
marketing environment including discounts or
promotions. In contrast, some customers (i.e.,
customer #1275, #1260) are highly influenced by the
marketing environment. This implies that marketing
promotion for these customers can be effective.
Customers influenced by the item vector (i.e.,
customer #1453, #1250) may prefer common
combinations.
(iii) Hierarchical model
Table 3 provides the coefficient estimates for the
hierarchical structure, Eq. (12). We interpret the
coefficients for each vector as follows. First, for the
(a) item vector, we find that the job variables are not
Product Embedding for Large-Scale Disaggregated Sales Data
73
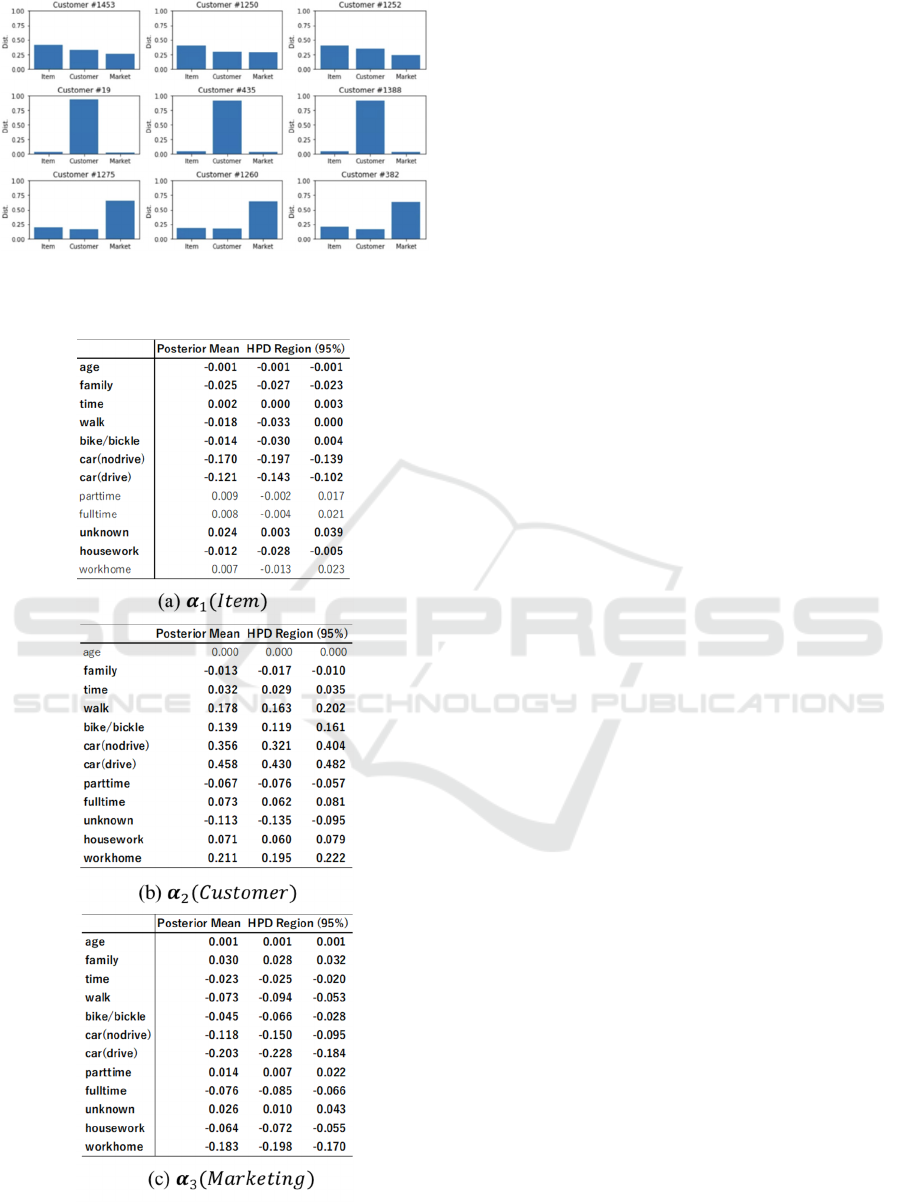
Figure 5: (b) Top Customers for three vectors.
Table 3: Coefficients of the Hierarchical Model.
quite significant, except “housework.” In addition,
the negative values of “age” and “family” indicate
that younger customers and those with fewer family
members may be less influenced by the product itself.
Second, we find that all the variables are significant,
and most variables from (b) customer vector and (c)
marketing vector have opposite influences, except for
means of transportation. On one hand, for the
customer vector, -0.013 for the covariate “family”
means that customers with fewer family members are
more likely to be influenced by their own interests
when they are shopping. In addition, customers who
spend more time and have jobs other than part-time
jobs tend to be highly influenced by their own
interests rather than the item or marketing
environment. On the other hand, older customers who
live with more family members, or have part-time
jobs, tend to be more influenced by marketing
environments such as discounts and promotions
rather than their own preferences.
By interpreting the estimates of the hierarchical
model, we can further understand the role of
demographic data and customer behavior, which will
provide useful insights into real business scenarios
and marketing decisions such as personal marketing.
4 CONCLUSION
This study proposes a new framework that extends
the LDA2Vec approach by including the marketing
environment and hierarchical structure with customer
demographic data. The empirical results show that
our approach not only improves the precision of
forecasting but also enhances the interpretability of
the model.
Our study highlights the significance of the
marketing environment as well as the demographics
in large-scale marketing implications. Furthermore,
considering the topic distribution and vector
probability together, we can further understand the
customer behavior pattern and the latent factor by
evaluating the estimates for the hierarchical structure.
Further issues remain. We fixed several
hyperparameters in our empirical study, such as the
dimension of the topic and vector. Another
challenging problem is that some estimates are still
difficult to interpret, such as the interpretation of each
topic and the role of the means of transportation. We
leave these issues for future research.
REFERENCES
Barkan, O. and Koenigstein, N. (2016). Item2vec: Neural
Item Embedding for Collaborative Filtering. 2016 IEEE
KDIR 2021 - 13th International Conference on Knowledge Discovery and Information Retrieval
74

26th International Workshop on Machine Learning for
Signal Processing. 1-6.
Blei, D.M., Ng, A.Y. and Jordan, M.I. (2003). Latent
dirichlet allocation. The Journal of Machine Learning
Research, 3, 993–1022.
Caselles-Dupré, H., Lesaint, F. and Royo-Letelier J. (2018).
Word2Vec applied to Recommendation:
Hyperparameters Matter. Proceedings of the 12th ACM
Conference on Recommender Systems, 352-356.
Levy, O. and Goldberg, Y. (2014). Dependency-Based
Word Embeddings. In Proceedings of the 52nd Annual
Meeting of the Association for Computational
Linguistics, (2), 302–308.
Grbovic, M., Radosavljevic, V., Djuric, N., Bhamidipati, N.,
Savla, J., Bhagwan, V. and Sharp, D. (2015). E-
commerce in your inbox: Product recommendations at
scale. In Proceedings of the 21st ACM SIGKDD
International Conference on Knowledge Discovery and
Data Mining. New York: ACM Press, 1809–1818.
Koren Y, Bell R, Volinsky C. (2009). Matrix
factorization techniques for recommender systems.
Computer, 1(8), 30-7.
Essex, D. (2009). Matchmaker, matchmaker.
Communications of the ACM, 52(5),16–17.
Mikolov, T., Chen, K., Corrado, G. and Dean, J. (2013).
Efficient Estimation of Word Representations in Vector
Space. Proceedings of the International Conference on
Learning Representations,2013, 1-13.
Moody, C. (2016). Mixing Dirichlet Topic Models and
Word Embeddings to Make lda2vec.
Naik, P., Wedel M., Bacon, L. and Bodapati, A. (2008).
Challenges and opportunities in high-dimensional
choice data analyses. Marketing Letters, 19(3), 201-213.
Paquet, U. and Koenigstein, N. (2013). One-class
collaborative filtering with random graphs. In
Proceedings of the 22nd international conference on
World Wide Web, 999-1008.
Pennington, J., Socher, R. and Manning, C. (2014). Glove:
Global Vectors for Word Representation. In
Proceedings of the 2014 Conference on Empirical
Methods in Natural Language, 1532–1543.
Salakhutdinov R. and Mnih A. (2008). Bayesian
probabilistic matrix factorization using Markov chain
Monte Carlo. In Proceedings ICML, 880-887.
Vasile, F., Smirnova, E. and Conneau, A. (2016). Meta-
prod2vec: Product embeddings using side-information
for recommendation. In Proceedings of the 11th ACM
Conference on Recommender Systems. New York:
ACM Press, 225–232.
Product Embedding for Large-Scale Disaggregated Sales Data
75
