
A Multi-agent Approach for Graph Classification
Luca Baldini
a
and Antonello Rizzi
1 b
Department of Information Engineering, Electronics and Telecommunications, University of Rome “La Sapienza",
Via Eudossiana 18, 00184 Rome, Italy
Keywords:
Multi-agent Systems, Graph Embedding, Supervised Learning, Structural Pattern Recognition.
Abstract:
In this paper, we propose and discuss a prototypical framework for graph classification. The proposed algo-
rithm (Graph E-ABC) exploits a multi-agent design, where swarm of agents (orchestrated via evolutionary
optimization) are in charge of finding meaningful substructures from the training data. The resulting set of
substructures compose the pivotal entities for a graph embedding procedure that allows to move the pattern
recognition problem from the graph domain towards the Euclidean space. In order to improve the learning
capabilities, the pivotal substructures undergo an independent optimization procedure. The performances of
Graph E-ABC are addressed via a sensitivity analysis over its critical parameters and compared against current
approaches for graph classification. Results on five open access datasets of fully labelled graphs show interest-
ing performances in terms of accuracy, counterbalanced by a relatively high number of pivotal substructures.
1 INTRODUCTION
Multi-agent systems (Panait and Luke, 2005; Stone
and Veloso, 2000; Rizk et al., 2018; Dorri et al., 2018)
emerged in the last years as powerful approaches in
order to solve complex pattern recognition problems.
This is due to the innate nature of multi-agent sys-
tems, where independent atomic computational units
(i.e., the agents) cooperate in order to solve a complex
problem by a divide-and-conquer approach.
The flexibility of multi-agent systems leaded to
different research works where such paradigm has
been employed for building supervised and unsuper-
vised learning systems. For example, in (Alamgir and
Von Luxburg, 2010) a multi-agent approach has been
used for local graph clustering in which each agent
performs a random walk on a graph with the main
constraint that such agents are "tied" together by a
rope, forcing them to be close to each other. In (Car-
valho et al., 2016) a set of self-organising agents by
means of ant colony optimisation has been applied to
anomaly detection and network control. In (Chaimon-
tree et al., 2010) each agent runs a different cluster-
ing algorithm in order to return the best one for the
dataset at hand. In (Chaimontree et al., 2011) agents
negotiate one another rather than being governed by a
master/wrapper process (e.g. evolutive algorithm) in
a
https://orcid.org/0000-0003-4391-2598
b
https://orcid.org/0000-0001-8244-0015
order to improve the clustering solution. In (
˙
Inkaya
et al., 2015) ant colony optimisation has been used in
order to organise agents, where each ant "walks" on
the dataset, building connections amongst points. In
(Ogston et al., 2003) each agent consists in a set of
data points and agents link to each other, thus lead-
ing to clustering. In (Pan and Chen, 2012) a genetic
algorithm has been used where the agents’ genetic
code is connection-based: each agent is a clustering
result whose genetic code builds a (sub)graph and, fi-
nally, such subgraphs can be interpreted as clusters.
In (Park and Oh, 2006) the multi-agent approach col-
lapses into two agents: a first agent runs a cascade of
principal component analysis, self organizing maps
and k-means in order to cluster data and a second
agent validates such results: the two agents interac-
tively communicate with each other.
As supervised problems are concerned, in
(Bianchi et al., 2015) a multi-agent algorithm has
been proposed in which agents perform a Markovian
random walk on a weighted graph representation of
the input dataset. Each agent builds its own graph
connection matrix amongst data points, weighting the
edges according to the selected distance measure pa-
rameters, and performs a random walk on such graph
in order to discover clusters. This algorithm has been
employed in (Bianchi et al., 2016) for an unsuper-
vised identification of frequent behaviours of mobile
network subscribers starting from a set of call data
334
Baldini, L. and Rizzi, A.
A Multi-agent Approach for Graph Classification.
DOI: 10.5220/0010677300003063
In Proceedings of the 13th International Joint Conference on Computational Intelligence (IJCCI 2021), pages 334-343
ISBN: 978-989-758-534-0; ISSN: 2184-3236
Copyright © 2023 by SCITEPRESS – Science and Technology Publications, Lda. Under CC license (CC BY-NC-ND 4.0)

records. In (Pan and Jiao, 2011), the authors propose
the Granular Agent Evolutionary Classification algo-
rithm, where agents are in charge of clustering pat-
terns with similar attributes. Further, different agents
lie in different class-aware subsystems and each sub-
system is characterized by a set of classification rules
extracted by the information collected by the granu-
lar agents. Due to the advent of large corpora, multi-
agent systems have been applied for text and doc-
ument classification (Mostafa et al., 2005; Ahmad
et al., 2012).
The MAS paradigm has also been successfully ap-
plied in the field of Computer Vision. In (Chen et al.,
2019), the authors designed an agent based system
for Scene Graph generation for visual genome under-
standing where objects are agents that have to max-
imize the quality of the generated scene graph. In
(González-Briones et al., 2018), the authors proposed
an image recognition system for real time applications
where different agents collaborate for extracting rel-
evant features from the acquired images in order to
determine the age and gender of individuals in an of-
fice building. The MAS paradigm has found applica-
tion also in the field of bioinformatics (Corrêa et al.,
2020) for protein structure prediction by distributing
each relevant task among different agents in a decen-
tralized way. The distributed aspect that characterize
multi-agent systems has led various authors to inves-
tigate their application in the field of Big Data. In
(Lombardo et al., 2019), the authors proposed a gen-
eral purpose actor-based system for distributed data
mining addressing the problem of social data analysis
such as topic detection, troll detection and hoax detec-
tion. Conversely in (Ding et al., 2018), the authors in-
troduce a multi-agent co-evolutionary adaptive strat-
egy for attribute reduction for big medical datasets
concerning infant brain Magnetic Resonance Imag-
ing. Finally, in (Modi and Shen, 2001), the authors
propose a distributed multi-agent framework for clas-
sification, where the authors assume that each agent
can see only a subset of features as the data is con-
ceived to be decentralized.
In this paper, we exploit Evolutive Agent Based
Clustering/Classification (E-ABC, for short) for solv-
ing classification problems. The peculiarities of E-
ABC can be summarized as follows: a) each agent
sees only a small random portion of the dataset; b)
different swarms of agents work on class-stratified
data; c) agents evolve via evolutionary optimization;
d) the synthesis of classification models is orches-
trated by an independent evolutionary-like optimiza-
tion which allows the cooperation amongst different
swarms. The rationale behind the latter point is in
line with the divide-and-conquer approach which is
typical of multi-agent systems. In fact, the output of
the swarms serves as input for the population of the
evolutionary-like optimization, and the output of the
latter refines the behaviour of the swarms, with the fi-
nal (common) goal of synthesizing a performing clas-
sification system.
E-ABC has been originally proposed in (Martino
et al., 2019a) as a clustering algorithm based on the
multi-agent paradigm conceived to work in Euclidean
spaces. In (Giampieri et al., 2018), it has been ex-
tended towards supervised problems by letting the re-
sulting clusters to compose a decision cluster classi-
fier (Di Noia et al., 2020) and applied to the classifica-
tion of faulty states in a real-world smart grid. In (Gi-
ampieri et al., 2020), E-ABC has been upgraded with
a multimodal optimization approach (Wong, 2015;
Preuss, 2015) in order to foster the exploration of dif-
ferent subspaces, hence foster its local metric learn-
ing capabilities. Conversely to all previous works,
in which E-ABC has been designed and employed
to process data described by vectors lying in a Eu-
clidean space, in this paper we propose an extension
of E-ABC tailored to work in the graph domain. The
transition from a structured domain such as the graph
one to a metric space such as the Euclidean one is
motivated by a well-established embedding approach
already explored in works such as (Martino and Rizzi,
2021) and (Baldini et al., 2021). As will be thor-
oughly explained later, agents are in charge of search-
ing for meaningful subgraphs amongst the training
data and these subgraphs will act as the pivotal sub-
structures for moving the classification problem from
the graph domain towards the Euclidean space, where
any classifier can freely be used.
The remainder of the paper is structured as fol-
lows: in Section 2 we describe the proposed algo-
rithm, in Section 3 we show the computational results,
in terms of sensitivity analysis to critical parameters
and comparison against similar approaches for graph
classification. Finally, in Section 4 we conclude the
paper, remarking future directions.
2 GRAPH E-ABC
Graph E-ABC is a graph classification system based
on multi-agent evolutive strategy. The system is in-
tended to be multi-agent by means of a collabora-
tive approach established between the individuals be-
longing to different swarms Σ = {S
1
,...,S
S
}, where
S is the number of classes in the classification prob-
lem. In particular, each swarm S
i
∈ Σ is a team of
agents that individually performs a simple data min-
ing task exploiting graphs belonging to the i
th
class
A Multi-agent Approach for Graph Classification
335

(i.e., each swarm is devoted to extract meaningful in-
formation by observing class-stratified data). The re-
sults of this process are later examined and collected
together in order to be exploited for a final collab-
orative scope, i.e. the synthesis of candidate alpha-
bets set A
1
,...,A
K
, which enable to generate differ-
ent embedding spaces F
1
,...,F
K
exploiting the sym-
bolic histograms approach. In the resulting embed-
ding spaces, will finally be possible to set up com-
mon classification systems, being the generic embed-
ding space F
i
an Euclidean space. In order to improve
the quality of the alphabets, we designed a genetic
algorithm-inspired evolutive strategy which combines
and mutates the promising alphabets with custom ge-
netic operators via an independent set of agents Z.
2.1 Agent Behaviour
The first action performed by an agent a belonging to
a swarm S
i
is to gather a set of class-stratified sub-
graphs D
tr
g
sampled from graphs in D
tr
belonging to
class i, where the number of subgraph W = |D
tr
g
| is
a user-defined parameter. The sampling process can
be designed accordingly to different graph traversal
strategies which define the topology of the resulting
subgraphs (Baldini. et al., 2019; Baldini et al., 2020;
Baldini et al., 2021).
Once D
tr
g
is ready, a can start the data min-
ing process. The information extraction is per-
formed according to the Basic Sequential Algorith-
mic Scheme (BSAS) clustering algorithm (Theodor-
idis and Koutroumbas, 2008) working directly in
the graph domain. BSAS relies on three key fac-
tors: a suitable dissimilarity measure d : G × G → R
between patterns; a resolution parameter θ ∈ [0,1]
that defines the threshold on d for including patterns
into a specific cluster; the maximum number of al-
lowed clusters Q. The adopted dissimilarity mea-
sure is a heuristic based on a Graph Edit Distance
named weighted node Best Match First (nBMF) (Bal-
dini et al., 2021). In the nBMF procedure, w =
[w
node
ins
,w
node
del
,w
node
sub
,w
edge
ins
,w
edge
del
,w
edge
sub
] ∈ {0,1}
6
, is a
set of nodes and edges insertion, deletion, substitu-
tion weights for the weighted nBMF and γ
γ
γ is the
set of parameters for the dissimilarity measures be-
tween nodes and edges (if applicable). Full details
on nBMF, along with detailed pseudocodes, can be
found in (Baldini. et al., 2019; Martino and Rizzi,
2021). Clearly, the choice of w and γ
γ
γ is critical since
wrong values could undermine the ability of d to
correctly capture the proximity between semantically
close graphs. The agent runs BSAS according to d
and Q, generating Π = {P
1
,...,P
P
}, i.e. a set of par-
titions, each of which is obtained for a given θ
i
|
P
i=1
.
Each cluster C ∈ P
i
undergoes the evaluation
phase which determines the reliability r (C) of the
cluster according to two internal properties, namely
its compactness f
co
and its cardinality f
ca
:
f
co
(C) = 1 −
1
|C| − 1
∑
g∈C
d (g,g
∗
) (1)
f
ca
(C) =
|C|
|D
tr
g
|
(2)
where g
∗
is the cluster representative of C, i.e. the
MinSOD of the cluster (Martino et al., 2019b). The
reliability r(C) reads as follows:
r(C) = η · f
co
+ (1− η) · f
ca
(3)
where η is a trade-off parameter that weights the im-
portance of compactness against cardinality. Accord-
ing to a threshold τ, g
∗
can be promoted to be a sym-
bol s or simply discarded as not relevant information.
The evaluation phase is repeated for every cluster in
every partition P
i
∈ Π, leading to a set of symbols
B = {s
1
,...,s
M
} discovered by agent a, where M de-
pends on the number of symbols survived in the eval-
uation stage.
2.2 Synthesis of Classification Models
Once every agent in every swarm in Σ has completed
its data mining process, a class specific set of sym-
bols is returned. The sets of symbols B synthesized
by each agent in a specific swarm S
i
can be merged in
a class-specific (i.e., swarm-specific) bucket of sym-
bols H
i
|
S
i=1
. In other words, H
i
contains the collective
information gathered by agents working on class i.
The procedure moves to the generation of candi-
date alphabets leveraging the buckets H
i
in order to
enable the graph embedding stage. This process is ad-
dressed by a separated population Z of K individuals,
whose actions can be summarized as follows:
1. The agent z ∈ Z evaluates the maximum number
of symbols per class t = T /S that can be extracted
according to a user-defined bound T
2. The agent explores the buckets H
i
and extracts
uniformly at random at most t symbols
3. When all the classes are explored, the selected
symbols are collected into the multi-class alpha-
bet of symbols A
z
.
The procedure continues for all z ∈ Z, leading to the
synthesis of A
1
,...,A
K
.
According to the symbolic histogram approach
(Del Vescovo and Rizzi, 2007a; Del Vescovo and
Rizzi, 2007b), the alphabets can now be exploited for
building the vectorial representation of both training
NCTA 2021 - 13th International Conference on Neural Computation Theory and Applications
336

and validation sets (D
tr
and D
vs
). In short, the sym-
bolic histogram for a given graph G can be evaluated
via the following two-steps procedure:
1. the graph G is decomposed in k atomic units, i.e.
G
exp
= {g
1
,...,g
k
}
2. the symbolic histogram h
A
G
is defined as:
h
A
G
= [occ(s
1
,G
exp
),...,occ(s
n
,G
exp
)] (4)
where the function occ : A × G → N performs the
process of counting the occurrences of a symbol
s
i
∈ A in G
exp
:
occ(s
i
,G
exp
) =
∑
g∈G
exp
Γ(s
i
,g) (5)
where
Γ(s
i
,g) =
(
1 if d(s
i
,g) ≤ ζ
s
i
0 otherwise
(6)
and d(·,·) is the nBMF dissimilarity measure in-
troduced in Section 2.1.
Building the symbolic histograms of all graphs in D
tr
and D
vs
leads to the definition of F
tr
i
and F
vs
i
, respec-
tively an |D
tr
|×|A
i
| and an |D
vs
|×|A
i
| matrix, whose
rows are the symbolic histograms obtained with the
i
th
alphabet, for i = 1,...,K. A set of classification
models c
1
,...,c
K
can be build accordingly to specific
embedding spaces:
1. Train a classifier c
i
in the respective embedding
space F
i
spanned by the symbolic histograms ma-
trix F
tr
i
2. Test the classifier by predicting the embedded val-
idation set F
vs
i
3. Evaluate the performance measure ω
i
as the accu-
racy of c
i
in correctly classify F
vs
i
.
The resulting classifiers, c
1
,...,c
K
can be retained to-
gether with their performance measure ω
1
,...,ω
K
.
2.3 Driving Evolutions
In Sections 2.1 and 2.2, we described the goal of the
main actors: the swarms Σ must be successful in find-
ing relevant information for building informative al-
phabet sets; conversely, the population Z must be able
to select and collect effective symbols together in or-
der to build meaningful embedding spaces whose va-
lidity can be assessed by the classifier performances
ω. Hence, the evolutive process must take into ac-
count the different roles played by Σ and Z in order to
converge to suitable solutions. For sake of clearness,
before diving into the design of the evolutionary strat-
egy, we give a formal description of the fundamental
quantities involved in the optimization phase.
2.3.1 Symbol Quality
The quality of a single symbol Q
s
shall reflect the per-
formances ω of the alphabets in which the symbol s
under analysis appears in. A lookup table is built in
order to indicate the update value t that will be as-
signed to s via the following two steps:
1. Since the classification accuracy assumes values
in range [0, 1], the [0,1] range is uniformly dis-
cretized into a finite number of bins
2. each accuracy bin is mapped with a reward value,
also uniformly discretized into the same number
of bins, where the admissible range [t
min
,t
max
] is
user-configurable.
The quality update strategy works as follow:
1. Select the candidate alphabet A
2. Select the symbol s ∈ A
3. Find the accuracy bin in which ω lies and gather
the corresponding reward value t
4. Reward the symbols by applying the following
update rule:
Q
(new)
s
= Q
(old)
s
+t (7)
5. Repeat from step 2 for all symbols in the selected
alphabet A.
The procedure repeats from step 1 for all the alpha-
bets under evaluation. In this approach, we interpret
the performance ω as a critic about the effectiveness
of the embedding space F built accordingly to the al-
phabet A. In this way, the quality Q
s
can be seen as
a measure for determining if the symbol s is useful
for building a valuable alphabet which can attain high
level of performance.
2.3.2 Agent Quality
The agent quality measure Q
a
is defined accord-
ing to the qualities Q
s
1
,...,Q
s
M
and the reliabilities
r(C
1
),...,r(C
M
), where C
1
,...,C
M
are the clusters
related to s
1
,...,s
M
symbols the agent a has found
(see Section 2.1). The overall procedure for assigning
Q
a
can be break down in the following steps:
1. Select the agent a from S
i
∈ Σ
2. According to the agent set of symbols B, evaluate
the mean qualities
1
Q
B
=
1
|B|
∑
s∈B
Q
s
3. According to the agent set of symbols B evaluate
the mean reliability r
B
=
1
|B|
∑
s∈B
r
s
1
Q
s
is normalized in [0,1] according to the symbols
qualities observed in H
i
.
A Multi-agent Approach for Graph Classification
337

4. Set agents quality Q
a
Q
a
= ρ ·Q
B
+ (1− ρ) · r
B
(8)
5. Repeat from step 1 for all agents a ∈ S
i
with i =
1,...,S.
In Eq. (8), ρ weights the importance between the
symbols qualities and its reliabilities. In particular, in
the early generations of the evolution, we give more
importance to the right hand term in order to initially
synthesize well-formed clusters. Next, the quality of
an agent shall be better described as its ability in find-
ing informative symbols according to Q
s
, since the
final scope of the whole procedure is devoted to syn-
thesize meaningful alphabets employed for the clas-
sification problem. Indeed, this information is con-
tained in symbols qualities Q
s
whose values are actu-
ally backtracked in the agent quality Q
a
.
2.3.3 Evolutive Orchestration
The optimization of the agents in the swarms Σ is
driven by a genetic evolution. As stated in Section
2.1, each swarm S must be able to synthesize a candi-
date set of symbols H that will be later employed in
the formation of pivotal alphabets A. For this reason,
the genetic code a
code
of each agent reads as follow:
a
code
= [Q w γ
γ
γ τ] (9)
which summarize the crucial parameters for the in-
formation extraction described in Section 2.1. Agents
in the same swarm follow a classic (µ + λ) selection
scheme (Beyer and Schwefel, 2002), where λ off-
spring is generated according to common genetic op-
erators applied to the parents population µ, i.e. muta-
tion, crossover and random spawn of new individuals.
The optimization aims at maximizing the agent fitness
function defined as the quality Q
a
given in Eq. (8).
The classification models optimization is an
evolutionary-like procedure specifically designed ac-
cording to the unconventional nature of the individ-
ual’s genetic code z
code
. Indeed, z
code
is a direct rep-
resentation of a specific alphabet A, whose cardinal-
ity is not fixed a priori, rather depends on a uniformly
distributed at random variable bounded in [S,T ]. The
genetic code z
code
reads as follow:
z
code
= A = [s
1
,...,s
J
] (10)
where J = |A|. The fitness function f
z
reflects the
critic obtained by the classifier c trained in the em-
bedding space built according to A, i.e. the accuracy
ω the classifier c attained on the validation set. Given
the set of elite individuals Z
∗
, i.e. top-Z individuals
evaluated so far, the offspring
ˆ
Z is generated accord-
ing to custom operators defined as follows:
Crossover: two individuals z
i
and z
j
are selected uni-
formly at random from Z ∪ Z
∗
. A cut point is de-
termined according to the shortest code between
the two and a new individual is created according
to a one-point crossover operator.
Union: two individuals z
i
and z
j
are selected uni-
formly at random from Z ∪ Z
∗
and eventually a
new individual is defined as the union set z
i
∪ z
j
.
Mutation: a single individual z
i
is uniformly at ran-
dom extracted from Z ∪ Z
∗
. With a given proba-
bility α
mut
, each symbol s ∈ z
i
has the chance to be
swapped with a symbol belonging to a randomly
extracted individual z
j
∈ Z ∪ Z
∗
.
The recombination process is repeated until
ˆ
Z is pop-
ulated with L different individuals. The whole evo-
lutive orchestration can be schematically described as
follow:
1. Run the agent swarms Σ
2. Collect the agent symbols into H
1
,...,H
S
class-
specific buckets
3. Generate Z
4. Generate
ˆ
Z by recombination of Z and Z
∗
5. Evaluate Z and
ˆ
Z
6. Reward the symbols in Z ∪
ˆ
Z according to the
classification performance
7. Evaluate the agents fitnesses for the swarms in Σ
8. Evolve the agent swarms Σ
9. Replace Z
∗
by selecting the top-Z individuals
amongst Z ∪
ˆ
Z ∪ Z
∗
.
The latter procedure highlights how the two different
swarms Σ and Z cooperate together. To summarize,
the agents in the swarms observe new sampled data
at each iteration in order to detect useful information
and improve their ability thanks to genetic optimiza-
tion that tries to maximize the quality of the agents’
output, i.e. their symbols. On the contrary, the pop-
ulation Z explores possible combinations of agents’
outputs for testing prospective embedding spaces and
simultaneously provides a supervised critic about the
quality of the agents’ output. The recombination of
Z with Z
∗
can be considered as an exploitation phase
where the most effective individuals observed so far
are mixed with just-explored ones in order to possibly
generate improved alphabets. Finally, Z
∗
is intended
to be created according to the selection pressure held
by the limited environment space, that is, only the best
Z individuals survive and will be part of the next gen-
eration.
NCTA 2021 - 13th International Conference on Neural Computation Theory and Applications
338

2.4 Test Phase
After the evolution converges and/or reach the maxi-
mum number of generations N
stop
, the final elite pop-
ulation Z
∗
can be exploited for evaluate the solutions
obtained on a graph test set D
ts
. Recalling that each
z
∗
code
∈ Z
∗
is an alphabet of symbols A, we can build
the symbolic histogram matrix F
ts
of test set and train
a classifier c according to F
tr
, where as usual F
tr
and
F
ts
are respectively an |D
tr
| × |A| and an |D
ts
| × |A|
matrix. By repeating the embedding procedure for all
the solutions in Z
∗
, c
1
,...,c
Z
classifiers are placed in
ensemble in order to possibly exploit simultaneously
all the information carried by the different embedding
space spanned by the symbolic histograms matrices.
The final performance of the system is obtained by
equipping the ensemble with a winner-takes-all pol-
icy rule. That is, each classifier in ensemble emits the
label for the symbolic histogram belonging to the test
set under analysis. Afterwards, the most voted label
is retained as the final prediction.
3 TEST AND RESULTS
3.1 Datasets and Algorithmic Setup
In order to test Graph E-ABC, we consider the follow-
ing five open-access datasets from the IAM Reposi-
tory (Riesen and Bunke, 2008): AIDS, GREC, Letter-
L, Letter-M and Letter-H.
As the dissimilarities between nodes’ and edges’
attributes are concerned, all of them are customized
according to the nodes and edges attributes for each
dataset. GREC is the only dataset for which the
dissimilarity measures between nodes and edges are
parametric themselves: such values populate γ
γ
γ which
shall be optimized, as described in Section 2.3.3. Full
details on the datasets, alongside formal definitions of
their dissimilarity measures between nodes and edges
can be found in (Martino and Rizzi, 2021) and (Bal-
dini et al., 2021).
The algorithm parameters are set as follows. For the
orchestration of agents in A:
• The sets of sampled subgraphs D
tr
g
is built accord-
ingly to a random walk extraction
• The BSAS resolution θ assumes linearly spaced
values in range [0,1] with step size 0.1
• µ = 5 and λ = 15, the parents and offspring popu-
lation sizes (respectively)
• η = 0.5, weight between compactness f
co
and car-
dinality f
ca
• The maximum number of generation N
stop
= 20.
For the orchestration of the model evolution:
• K = 10, the number of individuals in Z
• Z = 10, the number of best individuals in Z
∗
• L = 20, the number of recombined individuals in
ˆ
Z
• α
mut
= 0.15, the swapping probability in Section
2.2.
Other parameters include:
• t
min
= −10 and t
max
= 10, respectively the maxi-
mum penalty and the maximum reward values for
updating the symbol quality Q
s
• ρ assumes equally spaced values in the range [0,1]
with step size
1
N
stop
• The number of bins for the lookup table in Section
2.3.1 equals the number of classes, so it changes
in a dataset-dependent fashion
• ζ
s
i
= 1.1 · f
co
(C), where C is the cluster who gen-
erated the symbol s
i
.
The remaining two parameters (T and W ) are subject
to a sensitivity analysis, as detailed in the following.
3.2 Sensitivity Analysis
Amongst the parameters that characterize Graph E-
ABC, to the best of our judgement, two of them are
critical and need a careful tuning: the number of
subgraphs that agents need to extract before running
BSAS (W ) and the maximum number of class-related
subgraphs to be included in the alphabet (T ). In order
to address how these two parameters affect the per-
formances of the overall system, we perform a sensi-
tivity analysis via grid search. In particular, we chose
a set of candidate values for both T and W , namely
T = W = [10,50,100,200], and for each hT,W i-pair,
we run Graph E-ABC and record the average accu-
racy on the test set and the average number of sym-
bols across 10 different runs, in order to account the
stochastic nature of the algorithm.
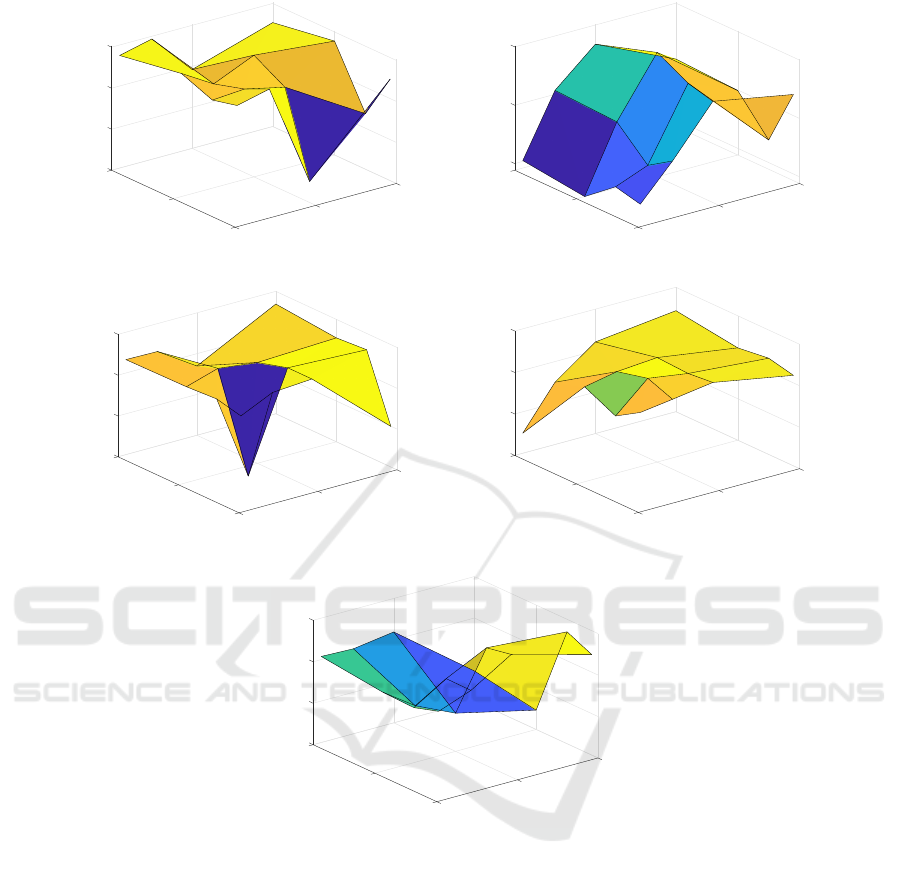
In Figure 1 we show the sensitivity analysis of
Graph E-ABC with respect to the grid over T × W .
From the sensitivity analysis emerges that T is the
most critical parameter affecting the performances: in
particular, for AIDS and Letter-L, performances tend
to deteriorate as T → 0, whereas for harder classifica-
tion problems such as Letter-M and Letter-M, perfor-
mances tend to deteriorate for larger T . GREC is the
only dataset for which performances seem to be rather
stable, regardless of T . As W is concerned, Letter-M
is the only dataset which shows an increasing trend in
performances as W grows, whereas for the remaining
four datasets a clear trend does not emerge.
A Multi-agent Approach for Graph Classification
339
0
100
200
W
0
100
200
T
92
94
96
98
Accuracy Test Set [%]
(a) AIDS.
0
100
200
W
0
100
200
T
70
75
80
Accuracy Test Set [%]
(b) GREC.
0
100
200
W
0
100
200
T
70
80
90
100
Accuracy Test Set [%]
(c) Letter-L.
0
100
200
W
0
100
200
T
60
70
80
90
Accuracy Test Set [%]
(d) Letter-M.
0
100
200
W
0
100
200
T
65
70
75
80
Accuracy Test Set [%]
(e) Letter-H.
Figure 1: Graph E-ABC sensitivity analysis (average accuracy on the test set).
3.3 Comparison against Current
Granular Approaches for Graph
Classification
In order to compare the performances of Graph
E-ABC, we select three suitable competitors that
(like Graph E-ABC) exploit the steps on information
granulation and graph embedding via symbolic his-
tograms: the class-aware version of GRALG, pro-
posed in (Baldini et al., 2021), and the RECTIFIER
and Dual-RECTIFIER classifiers proposed in (Mar-
tino and Rizzi, 2021). The major difference be-
tween Graph E-ABC and the three competitors is
that Graph E-ABC follows a ‘cooperative approach’,
where different agents exploit independent portions
of the dataset in order to search for suitable symbols
and later they join forces (via another set of agents)
for building the classification model. GRALG, REC-
TIFIER and Dual-RECTIFIER, as instead, follow an
‘individualistic approach’, where all individuals start
from the same set of subgraphs extracted from the
training data that does not change throughout the evo-
lution and each individual independently looks for
suitable granules of information, performs the em-
bedding procedure and trains the classifier in the em-
bedding space. The three competitors are driven by
a single-objective unimodal evolutionary procedure,
hence the best individual is retained for the synthe-
sis of the final classification system, to be validated
NCTA 2021 - 13th International Conference on Neural Computation Theory and Applications
340

on the test set. Amongst the three competitors, Dual-
RECTIFIER is the only one that (like Graph E-ABC)
exploit different optimization procedures in a class-
aware fashion, yet it is worth remarking that in Dual-
RECTIFIER such different optimization procedures
are independent one another, whereas in Graph E-
ABC there exist some sort of cooperation between
different swarms.
In Table 1 we report the results of the compari-
son amongst Graph E-ABC, GRALG, RECTIFIER
and Dual-RECTIFIER in terms of accuracy on the
test set and resulting number of symbols (i.e., size
of the embedding space). Results for GRALG, REC-
TIFIER and Dual-RECTIFIER are reported as func-
tion of visited symbols, expressed in percentage with
respect to the maximum attainable number of sub-
graphs that can be drawn from the training set (de-
tails in (Baldini et al., 2021) and (Martino and Rizzi,
2021)). For Graph E-ABC, as instead, we report (for
each dataset) the best point on the grids in Figure 1
(that is, the hT,W i-pair leading to the maximum ac-
curacy on the test set) and the average across all points
in the grid. In terms of accuracy, Graph E-ABC does
not rank amongst the most performing methods for
any of the datasets. However, the following observa-
tions arise: for easy classification problems such as
AIDS and Letter-L, the shift of Graph E-ABC (best
point) with respect to the best performing algorithm
is negligible (≈ 1% and < 2%, respectively). The
same is not true for harder problems such as GREC
and Letter-H, where the accuracy shift with respect
to the best point is approximately 15% (GREC), 9%
(Letter-H). For Letter-M, a mid-hardness classifica-
tion problem, the accuracy shift with respect to the
best performing algorithm is approximately 4%.
In terms of alphabet size, Graph E-ABC ranks
as the least suitable algorithm. This is due to the
ensemble-like nature of the synthesis of the model.
In fact, recall from Section 2.2, K different classifiers
are in charge of classifying the data in K different em-
bedding spaces. Hence, if we sum together the size of
each of the K embedding spaces, this inevitably leads
to a drastically higher number of symbols. However,
if we take the average number of symbols that each
model has to exploit (i.e., the sum of symbols divided
by K models), we can see that the results are rather in
line with the competitors for low subsampling rates
(i.e., more than 50%).
4 CONCLUSIONS AND FUTURE
DIRECTIONS
In this paper, we presented a promising multi-agent-
based algorithm (Graph E-ABC) for graph classifica-
tion. Graph E-ABC exploits a two-fold optimization
routine in order to simultaneously improve the agents
(hence their ability in searching for meaningful sub-
graphs) and the set of subgraphs that compose the
classification model. Computational results on open
Table 1: Comparison against current approaches for graph classification system in terms of accuracy on the test set and, in
brackets, size of the embedding space (i.e., number of symbols). For each dataset, we highlight in bold the most performing
technique in terms of accuracy (in case of ties, the size of the embedding space acts as a tiebreaker).
Technique AIDS GREC Letter-L Letter-M Letter-H
Graph E-ABC (best point) 98.07 (34) 80.09 (1284) 96.89 (2260) 86.27 (4407) 79.78 (2517)
Graph E-ABC (average) 96.95 (222) 74.56 (1748) 92.20 (1460) 81.79 (3879) 74.76 (4592)
RECTIFIER (5%)
†
98.12 (6) 92.64 (87) 93.33 (23) 86.36 (52) 84.57 (90)
RECTIFIER (10%)
†
98.41 (8) 92.91 (169) 94.58 (32) 86.01 (71) 85.62 (145)
RECTIFIER (30%)
†
98.30 (9) 92.78 (415) 95.99 (79) 87.94 (173) 86.89 (300)
RECTIFIER (50%)
†
98.40 (16) 92.65 (439) 95.57 (81) 89.37 (232) 86.31 (431)
RECTIFIER (80%)
†
98.57 (16) 93.09 (741) 94.80 (157) 87.21 (294) 88.92 (668)
Dual-RECTIFIER (5%)
†
99.11 (6) 94.37 (67) 94.77 (19) 85.74 (27) 82.59 (49)
Dual-RECTIFIER (10%)
†
98.97 (9) 95.25 (77) 94.37 (22) 86.50 (42) 84.84 (86)
Dual-RECTIFIER (30%)
†
98.95 (11) 95.59 (173) 94.19 (29) 90.14 (77) 87.58 (162)
Dual-RECTIFIER (50%)
†
98.81 (13) 95.22 (264) 95.11 (35) 89.88 (104) 86.67 (177)
Dual-RECTIFIER (80%)
†
98.94 (37) 95.57 (215) 95.37 (50) 90.31 (136) 86.83 (275)
Class-Aware GRALG (10%)
‡
98.99 (9) 88.36 (288) 98.25 (146) 89.00 (214) 83.29 (287)
Class-Aware GRALG (30%)
‡
99.11 (11) 86.96 (335) 98.28 (205) 88.77 (277) 83.05 (319)
Class-Aware GRALG (50%)
‡
99.11 (12) 87.15 (322) 98.37 (218) 89.40 (311) 83.47 (313)
†
Averaged across different trade-off values in the objective function.
‡
Class-Aware Frequency Scaling heuristic for driving the granulation procedure.
A Multi-agent Approach for Graph Classification
341

access datasets show interesting results in terms of ac-
curacy for 3 out of 5 datasets. However, these interest-
ing accuracy results are counterbalanced by a high di-
mensionality of the feature space. Despite promising,
this prototypical implementation has some drawbacks
that might affect the behaviour of Graph E-ABC. For
example, we can investigate whether there exist a
good trade-off when employing the ensemble, that is,
how the performance change as a function of K. In
fact, while a higher number of models in the ensemble
may lead to higher accuracy, it also leads to a higher
number of symbols (since, trivially, more embedding
spaces have to be tested). Further, another potential
drawback relates to how the quality of the symbols
is evaluated. In fact (recall from Section 2.3.1), the
quality of each symbol is evaluated independently to
the one of other symbols: this approach does not al-
low to capture the correlation amongst symbols, that
is, whether there exist ‘groups of symbols’ that are
responsible for a fruitful embedding space.
Certainly one of the most striking facets of Graph
E-ABC is the highly stochastic nature of the agent fit-
ness functions due to the observation of continuously
different data shards sampled from the training set.
For such reason, a repeated evaluation of the same
individual can lead to a different fitness value, mostly
due to the quality of the sampled data. A plain (µ +λ)
evolutionary scheme might not be suitable to effi-
ciently deal with uncertain environments and future
investigation will be directed to design specific evo-
lutionary strategies able to take actions against noisy
fitness functions (Bhattacharya et al., 2014; Branke
et al., 2001; Merelo et al., 2016).
An additional improvement may regard the defini-
tion of the symbol quality (see Section 2.3.1). In fact,
suitable reward values may change drastically from
one dataset to another and a poor user-defined choice
can undermine not only the symbol quality (see Eq.
(7)), but also the agent quality (see Eq. (8)). A suit-
able countermeasure would be using adaptive strate-
gies for populating the reward values in the lookup
table. This would also limit the huge number of free-
parameters to be defined by the end-user.
REFERENCES
Ahmad, R., Ali, S., and Kim, D. H. (2012). A multi-agent
system for documents classification. In 2012 Interna-
tional Conference on Open Source Systems and Tech-
nologies, pages 28–32.
Alamgir, M. and Von Luxburg, U. (2010). Multi-agent ran-
dom walks for local clustering on graphs. In Data
Mining (ICDM), 2010 IEEE 10th International Con-
ference on, pages 18–27. IEEE.
Baldini., L., Martino., A., and Rizzi., A. (2019). Stochas-
tic information granules extraction for graph embed-
ding and classification. In Proceedings of the 11th
International Joint Conference on Computational In-
telligence - NCTA, (IJCCI 2019), pages 391–402. IN-
STICC, SciTePress.
Baldini, L., Martino, A., and Rizzi, A. (2020). Exploit-
ing cliques for granular computing-based graph clas-
sification. In 2020 International Joint Conference on
Neural Networks (IJCNN), pages 1–9.
Baldini, L., Martino, A., and Rizzi, A. (2021). Towards
a class-aware information granulation for graph em-
bedding and classification. In Merelo, J. J., Garibaldi,
J., Linares-Barranco, A., Warwick, K., and Madani,
K., editors, Computational Intelligence: 11th Inter-
national Joint Conference, IJCCI 2019, Vienna, Aus-
tria, September 17–19, 2019, Revised Selected Pa-
pers, pages 263–290. Springer International Publish-
ing, Cham.
Beyer, H.-G. and Schwefel, H.-P. (2002). Evolution strate-
gies – a comprehensive introduction. Natural Com-
puting, 1(1):3–52.
Bhattacharya, M., Islam, R., and Mahmood, A. N. (2014).
Uncertainty and evolutionary optimization: A novel
approach. In 2014 9th IEEE Conference on Industrial
Electronics and Applications, pages 988–993.
Bianchi, F. M., Maiorino, E., Livi, L., Rizzi, A., and
Sadeghian, A. (2015). An agent-based algorithm
exploiting multiple local dissimilarities for clusters
mining and knowledge discovery. Soft Computing,
5(21):1347–1369.
Bianchi, F. M., Rizzi, A., Sadeghian, A., and Moiso, C.
(2016). Identifying user habits through data mining
on call data records. Engineering Applications of Ar-
tificial Intelligence, 54:49–61.
Branke, J., Schmidt, C., and Schmeck, H. (2001). Ef-
ficient fitness estimation in noisy environments. In
Proceedings of the 3rd Annual Conference on Genetic
and Evolutionary Computation, GECCO’01, page
243–250, San Francisco, CA, USA. Morgan Kauf-
mann Publishers Inc.
Carvalho, L. F., Barbon, S., de Souza Mendes, L., and
Proença, M. L. (2016). Unsupervised learning clus-
tering and self-organized agents applied to help net-
work management. Expert Systems with Applications,
54:29–47.
Chaimontree, S., Atkinson, K., and Coenen, F. (2010).
Clustering in a multi-agent data mining environment.
Agents and Data Mining Interaction, pages 103–114.
Chaimontree, S., Atkinson, K., and Coenen, F. (2011). A
multi-agent based approach to clustering: Harnessing
the power of agents. In ADMI, pages 16–29. Springer.
Chen, L., Zhang, H., Xiao, J., He, X., Pu, S., and Chang,
S.-F. (2019). Counterfactual critic multi-agent train-
ing for scene graph generation. In Proceedings of the
IEEE/CVF International Conference on Computer Vi-
sion, pages 4613–4623.
Corrêa, L., Arantes, L., Sens, P., Inostroza-Ponta, M., and
Dorn, M. (2020). A dynamic evolutionary multi-agent
system to predict the 3d structure of proteins. In 2020
NCTA 2021 - 13th International Conference on Neural Computation Theory and Applications
342

IEEE Congress on Evolutionary Computation (CEC),
pages 1–8. IEEE.
Del Vescovo, G. and Rizzi, A. (2007a). Automatic classi-
fication of graphs by symbolic histograms. In 2007
IEEE International Conference on Granular Comput-
ing (GRC 2007), pages 410–410.
Del Vescovo, G. and Rizzi, A. (2007b). Online handwrit-
ing recognition by the symbolic histograms approach.
In 2007 IEEE International Conference on Granular
Computing (GRC 2007), pages 686–686. IEEE.
Di Noia, A., Martino, A., Montanari, P., and Rizzi, A.
(2020). Supervised machine learning techniques and
genetic optimization for occupational diseases risk
prediction. Soft Computing, 24(6):4393–4406.
Ding, W., Lin, C.-T., Chen, S., Zhang, X., and Hu, B.
(2018). Multiagent-consensus-mapreduce-based at-
tribute reduction using co-evolutionary quantum pso
for big data applications. Neurocomputing, 272:136–
153.
Dorri, A., Kanhere, S. S., and Jurdak, R. (2018). Multi-
agent systems: A survey. Ieee Access, 6:28573–
28593.
Giampieri, M., Baldini, L., De Santis, E., and Rizzi, A.
(2020). Facing big data by an agent-based multi-
modal evolutionary approach to classification. In 2020
International Joint Conference on Neural Networks
(IJCNN), pages 1–8.
Giampieri, M., De Santis, E., Rizzi, A., and Frattale Masci-
oli, F. M. (2018). A supervised classification system
based on evolutive multi-agent clustering for smart
grids faults prediction. In 2018 International Joint
Conference on Neural Networks (IJCNN), pages 1–8.
González-Briones, A., Villarrubia, G., De Paz, J. F., and
Corchado, J. M. (2018). A multi-agent system for the
classification of gender and age from images. Com-
puter Vision and Image Understanding, 172:98–106.
˙
Inkaya, T., Kayalıgil, S., and Özdemirel, N. E. (2015).
Ant colony optimization based clustering methodol-
ogy. Applied Soft Computing, 28:301–311.
Lombardo, G., Fornacciari, P., Mordonini, M., Tomaiuolo,
M., and Poggi, A. (2019). A multi-agent architecture
for data analysis. Future Internet, 11(2):49.
Martino, A., Giampieri, M., Luzi, M., and Rizzi, A.
(2019a). Data mining by evolving agents for clus-
ters discovery and metric learning. In Esposito, A.,
Faundez-Zanuy, M., Morabito, F. C., and Pasero, E.,
editors, Neural Advances in Processing Nonlinear Dy-
namic Signals, pages 23–35. Springer International
Publishing, Cham. Italian Workshop on Neural Nets
2017.
Martino, A. and Rizzi, A. (2021). An enhanced filtering-
based information granulation procedure for graph
embedding and classification. IEEE Access, 9:15426–
15440.
Martino, A., Rizzi, A., and Frattale Mascioli, F. M.
(2019b). Efficient approaches for solving the large-
scale k-medoids problem: Towards structured data.
In Sabourin, C., Merelo, J. J., Madani, K., and War-
wick, K., editors, Computational Intelligence: 9th In-
ternational Joint Conference, IJCCI 2017 Funchal-
Madeira, Portugal, November 1-3, 2017 Revised Se-
lected Papers, pages 199–219. Springer International
Publishing, Cham.
Merelo, J. J., Chelly, Z., Mora, A., Fernández-Ares, A.,
Esparcia-Alcázar, A. I., Cotta, C., de las Cuevas, P.,
and Rico, N. (2016). A statistical approach to deal-
ing with noisy fitness in evolutionary algorithms. In
Merelo, J. J., Rosa, A., Cadenas, J. M., Dourado, A.,
Madani, K., and Filipe, J., editors, Computational In-
telligence, pages 79–95. Springer International Pub-
lishing, Cham.
Modi, P. J. and Shen, W.-M. (2001). Collaborative multia-
gent learning for classification tasks. In Proceedings
of the Fifth International Conference on Autonomous
Agents, AGENTS ’01, page 37–38, New York, NY,
USA. Association for Computing Machinery.
Mostafa, J., Ke, W., and Fu, Y. (2005). Automated text
classification using a multi-agent framework. In Pro-
ceedings of the 5th ACM/IEEE-CS Joint Conference
on Digital Libraries (JCDL ’05), pages 157–158.
Ogston, E., Overeinder, B., Van Steen, M., and Brazier, F.
(2003). A method for decentralized clustering in large
multi-agent systems. In Proceedings of the second
international joint conference on Autonomous agents
and multiagent systems, pages 789–796. ACM.
Pan, X. and Chen, H. (2012). Multi-agent evolutionary
clustering algorithm based on manifold distance. In
Computational Intelligence and Security (CIS), 2012
Eighth International Conference on, pages 123–127.
IEEE.
Pan, X. and Jiao, L. (2011). A granular agent evolutionary
algorithm for classification. Applied Soft Computing,
11(3):3093–3105.
Panait, L. and Luke, S. (2005). Cooperative multi-agent
learning: The state of the art. Autonomous Agents and
Multi-Agent Systems, 11(3):387–434.
Park, J. and Oh, K. (2006). Multi-agent systems for intel-
ligent clustering. In Proc. of World Academy of Sci-
ence, Engineering and Technology, volume 11, pages
97–102.
Preuss, M. (2015). Multimodal optimization by means of
evolutionary algorithms. Springer, 1 edition.
Riesen, K. and Bunke, H. (2008). Iam graph database
repository for graph based pattern recognition and ma-
chine learning. In Joint IAPR International Work-
shops on Statistical Techniques in Pattern Recognition
(SPR) and Structural and Syntactic Pattern Recogni-
tion (SSPR), pages 287–297. Springer.
Rizk, Y., Awad, M., and Tunstel, E. W. (2018). Deci-
sion making in multiagent systems: A survey. IEEE
Transactions on Cognitive and Developmental Sys-
tems, 10(3):514–529.
Stone, P. and Veloso, M. (2000). Multiagent systems: A sur-
vey from a machine learning perspective. Autonomous
Robots, 8(3):345–383.
Theodoridis, S. and Koutroumbas, K. (2008). Pattern
Recognition. Academic Press, 4 edition.
Wong, K. (2015). Evolutionary multimodal optimization:
A short survey. CoRR, abs/1508.00457.
A Multi-agent Approach for Graph Classification
343
