
Towards a Rule-based Visualization Recommendation System
Arnab Chakrabarti
1
, Farhad Ahmad
1
and Christoph Quix
2
1
Information Systems & Databases, RWTH Aachen University, Germany
2
Hochschule Niederrhein, University of Applied Sciences & Fraunhofer FIT, Germany
Keywords:
Data Visualization, Recommendation Systems, Human-in-the-Loop.
Abstract:
Data visualization plays an important role in the analysis of data and the identification of insights and charac-
teristics within the dataset. However, visualizing datasets, especially high dimensional ones, is a very difficult
and time-consuming process that requires a great deal of manual effort. The automation of data visualization
is done in the form of Visualization Recommendation Systems by detecting factors such as data characteristics
and user intended tasks in order to recommend useful visualizations. In this paper, we propose a Visualiza-
tion Recommendation System, built on a knowledge-based rule engine, that takes minimal user input, extracts
important data characteristics and supports a large number of visualization techniques depending on both the
data characteristics and the intended tasks of the user. Through our proposed model we show the efficacy of
such recommendations for users without any domain expertise. Lastly, we evaluate our system with real-world
use case scenarios to prove the effectiveness and the feasibility of our approach.
1 INTRODUCTION
The enormous surge in data processing capabilities
in today’s world has boosted the exponential growth
of data that is collected, stored and analyzed to gain
valuable insights. This in turn has resulted in the
evolution of the processes for Knowledge Discovery
in Databases (KDD), which is a well-known proce-
dure to extract patterns and infer knowledge from raw
data. One of the proven methods of the KDD process
to efficiently communicate, comprehend and interact
with this complex and large amounts of information is
Data Visualization. However, the increasing dimen-
sionality and the growing volumes of the data pose a
challenge to the current data analytics systems to vi-
sualize high dimensional data and unfold the hidden
information. It not only requires a great deal of man-
ual effort but also a considerable amount of domain
knowledge related to the dataset in order to visual-
ize it in a meaningful way such that useful insights
existing within the data can be identified. The key
challenges faced in visualizing a dataset for analysis
include the identification of dimensions to be visual-
ized as well as the type of visualization technique to
be used.
Each of the visualization techniques has its own
merits. Determining the ”most meaningful” visual-
izations for a given dataset depends on the character-
istics of the data to be visualized as well as the re-
lationship between the dimensions. Another aspect,
that the type of visualization techniques rely upon,
is the type of data relationship to be visualized for
a set of intended tasks. Meaningful data relationships
include distribution, comparison, correlation, change
over time, to name a few. Applying the most efficient
visualization technique based on the characteristics of
the dataset as well as the nature of the intended task,
helps to improve the understandability of the data.
The increase in the dimensionality of data also results
in various challenges for data visualization. Visual-
izations based on more than three dimensions of data
require efficient ways to display the provided data
such that the visualization is easy to comprehend as
well as the data itself does not lose its meaningful as-
pect. This is mainly because human cognition limits
the number of data dimensions that can be visually
interpreted. The potential amount of overlapping data
points projected onto a two-dimensional display hin-
ders the interpretation of meaningful patterns in the
data.
To address these challenges, the process of ex-
tracting data characteristics and the generation of
task-oriented visualizations is automated. One impor-
tant factor for the automation of data visualization is
to make it accessible for all and not just for people
with technical expertise (Hu et al., 2019). This au-
Chakrabarti, A., Ahmad, F. and Quix, C.
Towards a Rule-based Visualization Recommendation System.
DOI: 10.5220/0010677100003064
In Proceedings of the 13th International Joint Conference on Knowledge Discovery, Knowledge Engineering and Knowledge Management (IC3K 2021) - Volume 1: KDIR, pages 57-68
ISBN: 978-989-758-533-3; ISSN: 2184-3228
Copyright
c
2021 by SCITEPRESS – Science and Technology Publications, Lda. All rights reserved
57

tomation is done in the form of Visualization Recom-
mendation Systems. As a result, there has been a sig-
nificant rise in the research and development of sys-
tems in recent years (Vartak et al., 2015)(Hu et al.,
2019)(Luo et al., 2018)(Krause et al., 2016). These
recommendation systems process the data and pro-
vide a set of visualizations providing insights which
could be helpful for the intended task of the analyst.
Most of the recommendation systems are designed
for the sole purpose of selecting the most relevant
features in the data and therefore, support a limited
number of visualization techniques. For example,
SeeDB (Vartak et al., 2015) aids the users to iden-
tify interesting visualizations using a deviation-based
metric, yet it only uses bar charts to display the result
and other recommendations whereas DEEPEYE (Luo
et al., 2018) only uses four common visualization
techniques namely bar charts, line charts, pie charts,
and scatter charts. SeekAView (Krause et al., 2016),
also has a fixed number of visualization techniques to
select the useful types of trends from, including fre-
quency plots, scatter plots and parallel coordinates.
The drawback of using a low number of visualization
techniques is that it is not possible to cover every type
of task using the same type of visualization technique.
The existing visualization recommendation sys-
tems that are proposed by the current literature face
several shortcomings. These shortcomings range
from the number of dimensions the recommenda-
tion system can handle to the number of visualiza-
tion techniques adopted. Moreover, most of these
systems require inputs from expert users having do-
main specific knowledge. Visualization recommenda-
tion systems that use a recommendation engine based
on supervised machine learning or neural networks
(Hu et al., 2019)(Luo et al., 2018) also suffer from
the problem of overfitting. Training the model for the
recommendation engine relies mainly on the training
data and a lack of available training data results in an
ineffective model that may be biased towards the data
similar to the training data.
To address these challenges, in this paper we pro-
pose a novel rule-based visualization recommenda-
tion system. We show how impartial and effective vi-
sualizations are recommended by using a knowledge-
based rule engine which is designed and developed
as a part of our work. The recommendation system
uses key factors such as data characteristics, intended
task and user feedback along with the knowledge-
base to decide the best suitable type of visualization
technique to be used. Furthermore, the recommen-
dations generated are ranked qualitatively based on
several statistical properties of the data.
Our contributions in this paper are summarized
below:
1. Classification of Data into Characteristics and
Proposing a Formal Visual Taxonomy:
The data is categorized based on several factors
such as the type of data (discrete, continuous) or
its format (e.g. Numerical, Categorical). These
factors are required as they influence the type of
visualization technique to be used and are there-
fore essential for the development of the rule en-
gine. A formal visual taxonomy is proposed as
well, which provides the theoretical foundation
for the construction of the knowledge base.
2. Mapping User Tasks to Visual Structures and
Creation of the Task based Visual Taxonomy:
The intended user task, required to generate vi-
sualization recommendations, is abstracted in the
form of a task based visual taxonomy which in
turn is mapped on to the type of visualization tech-
niques in order to generate the recommendations.
3. Creation of Rules for Knowledge-based Rule
Engine:
After the categorization of data based on its char-
acteristics, knowledge base rules are generated to
provide recommendations. The input factors for
the rules, apart from data categories, include as-
pects such as the intended task of the user and the
number of dimensions to be visualized. Based on
the input factors, the rule engine then decides the
best suitable visualization techniques in the form
of recommendations.
4. Ranking of Visualization Recommendations:
The recommendation system generates a set of vi-
sualizations as multiple rules could be applicable.
Therefore, a ranking algorithm is implemented
based on task dependant statistical measures so
that the visualizations are sorted in a descending
order based on their scores ensuring that the most
useful visualizations are displayed first to the user
resulting in an efficient process.
5. Evaluate the Designed System:
We test a sample scenario by using a real-world
dataset in order to evaluate the usefulness of the
generated and ranked recommendations and com-
pare the results with a popular visualization tool.
2 RELATED WORK
As discussed in the previous section, there has been
significant progress in the research and development
of visualization recommendation systems in recent
years. According to (Kaur and Owonibi, 2017), these
KDIR 2021 - 13th International Conference on Knowledge Discovery and Information Retrieval
58

systems generate recommendations based on one of
the four following strategies:
• Data Characteristics Oriented: Recommenda-
tion systems based on this strategy focus primar-
ily on the characteristics and type of data to gen-
erate visualizations. The data attributes are used
to create visual marks for the final visualization.
A key feature of this approach is the formaliza-
tion of visual mappings from data characteristics
to visual marks. The work done in this field in-
cludes VizQL (Mackinlay et al., 2007) (used in
the Show Me module of Tableau) and Vega-lite
(Satyanarayan et al., 2017). Both provide formal
declarative specifications to convert the data char-
acteristics into visual mappings. These include
mappings such as selecting the x and y axes di-
mensions, the data type, the mark type to be used
and the summaries (such as the mean) to be dis-
played. These formal mappings are then used to
create rules that can be applied to generate useful
visualizations based on the dataset provided.
• Task Oriented: This strategy uses the concept of
intended task to visualize the data. These intended
tasks may include identifying data relationships
such as correlation, comparison, distribution etc.
and the type of visualization technique to be used
by the recommendation system relies heavily on
this. Most of the current studies in this area cre-
ate the user task list manually (Kaur and Owonibi,
2017) and then apply the data characteristics ap-
proach based on the chosen intended task.
• Domain Knowledge Oriented: The research in
this area focuses on improving the recommenda-
tions based on the domain knowledge. This is
done by employing the task and data in the vo-
cabulary of the problem domain in order to sat-
isfy the user requirements in that specific do-
main (Kaur and Owonibi, 2017). This can be
done based on knowledge-sharing or gaining do-
main knowledge from existing knowledge bases.
RAVE (Klumpar et al., 1994) uses NASA’s do-
main knowledge along with user-selected tasks or
visualization type to generate a meaningful visu-
alization. RAVE is capable of generating visual-
izations such as a 2D scatterplot, bar graph and pie
chart using its knowledge base. Semantic-based
recommendations in the form of ontologies are
also a key research area for domain knowledge-
based recommendation systems.
• User Preferences Oriented: This approach ex-
plicitly requires user input to decide the user pref-
erence and generate recommendations accord-
ingly. This can, later on, be used to improve the
system. The visualization recommendation sys-
tems, using this strategy, constantly analyze and
record the actions performed by the user to gen-
erate visualizations so that the recommendations
preferred by the user can be displayed rather than
the irrelevant ones (Gotz and Wen, 2009). Recent
work in this area employs machine learning ap-
proaches to steadily improve the model and prune
out the irrelevant recommendations (Key et al.,
2012).
The following sections in this chapter include de-
tails regarding the recent studies and work done in the
field of visualization recommendation systems based
on one or more of the recommendation strategies dis-
cussed above.
SEEDB. Based on these recommendation strate-
gies, popular systems have been developed in recent
times. For example, SEEDB (Vartak et al., 2017)(Var-
tak et al., 2015) is a recently developed visualization
recommendation system. Using a subset of the data
extracted from a query, SEEDB is able to generate vi-
sualization recommendations that it regarded as use-
ful based on multiple metrics. However, SEEDB does
not support multiple types of visualization techniques
based on the data characteristics or intended tasks and
instead generates recommendations only in the form
of bar charts. The problem with this type of approach
is that bar charts are only able to visualize a certain as-
pect of data characteristics and tasks such as compar-
ison in magnitude. Another drawback is the depen-
dency on the user for query generation or selection of
dimensions. For this aspect, the user must have some
domain knowledge regarding the dataset or expertise
over the visualizations.
SeekAView. SeekAView (Krause et al., 2016) is a
visual analytics system that allows users to create sub-
spaces from a high-dimensional dataset. It also pro-
vides suggestions for the users to reconfigure their
views and identify interesting insights from the gen-
erated suggestions. Manual effort is required from
the user to detect dimensions that show an interest-
ing pattern. Despite being a very useful tool for high-
dimensional data visualization and identifying impor-
tant data trends, SeekAView is subject to deficiencies
as it recommends only a specific set of visualizations
like density plots for the dimensions while PCA scat-
terplot, parallel coordinates and a scatterplot matrix
is only used for the resulting subset. The fact that
SeekAView displays density plots for every dimen-
sion, makes it complex to use for data analysis for
high-dimensional datasets. Therefore, domain knowl-
edge and a high amount of manual effort is required
Towards a Rule-based Visualization Recommendation System
59
while using it to analyze the density plots for impor-
tant dimensions whereas some key relationships be-
tween dimensions may never be identified due to the
use of a low number of visualization techniques.
DeepEye. DeepEye (Luo et al., 2018) is a visual-
ization recommendation system developed recently
and employs machine learning to generate recom-
mendations. The motivation for using this approach
is to solve three individual problems. First, to de-
cide whether an individual visualization is useful or
not, second, to compare two visualizations and select
the better one and last, in the case of multiple visual-
izations, to find the top-k ones in a dataset. Though
DeepEye proposes an effective approach towards vi-
sualization recommendation system as it uses a hybrid
system based on machine learning and expert rules, it
is only able to suggest recommendations in the form
of pie charts, bar charts, line graphs and scatterplots
which are not sufficient to cover all types of useful vi-
sualization recommendations. Using machine learn-
ing models to decide the usefulness of a visualization
depends considerably on the training data that is used,
therefore, datasets from diverse fields are required
for the training of an unbiased model whereas expert
rules for only four visualizations techniques are not
enough to identify all possible types of intended tasks
VizML. VizML (Hu et al., 2019) is another Ma-
chine Learning approach for visualization recommen-
dation systems. VizML generates visualization rec-
ommendations using Neural Network and Baseline
models trained and tested on one million visualiza-
tions taken from the Plotly Community Feed (Plotly,
). Data collected from Plotly is cleaned by removing
the duplicate visualizations, the corpus is then used
for feature and design choice extractions which are
subsequently used to train the models in order to pre-
dict recommendations. Although VizML is an effi-
cient machine learning approach to visualization rec-
ommendation, it consists of a few limitations. VizML
utilizes training dataset obtained from Plotly (Plotly, )
only and while the dataset is large enough, it would
still be biased towards Plotly. Therefore, datasets
from diverse data sources and fields should be ob-
tained and used for training the models. Another dis-
advantage of using Plotly datasets is the fact that it
is used by both expert and non-expert users to create
visualizations. Visualizations created by non-expert
users are prone to error and may not be that useful.
3 OVERVIEW OF OUR
APPROACH
In this section, we present our proposed model of the
recommendation system. Our system is built on top
of a rule engine constructed by modeling data char-
acteristics and intended tasks into generic rules. The
data characteristics axis is used to identify key charac-
teristics of the data such as dimensionality, data type
and data format while the intended task axis takes into
account the goal of the user based on the type of data
relationship. As a first step, data characteristics are
extracted automatically from the input dataset, using
the data abstraction module while the intended tasks
are mapped using the task abstraction module. These
two different sets of inputs are used for the construc-
tion of rules which are modeled as generic rules and
are stored in the Knowledge Base. During the execu-
tion, dynamic data and task encodings are generated
which are looked up in the Knowledge Base in order
to retrieve the corresponding rule sets. These rules
are then ingested by the Rule Engine to trigger a spe-
cific event which consists of a set of visualizations.
These visualizations are then ranked and displayed
to the end-user as recommendations. The complete
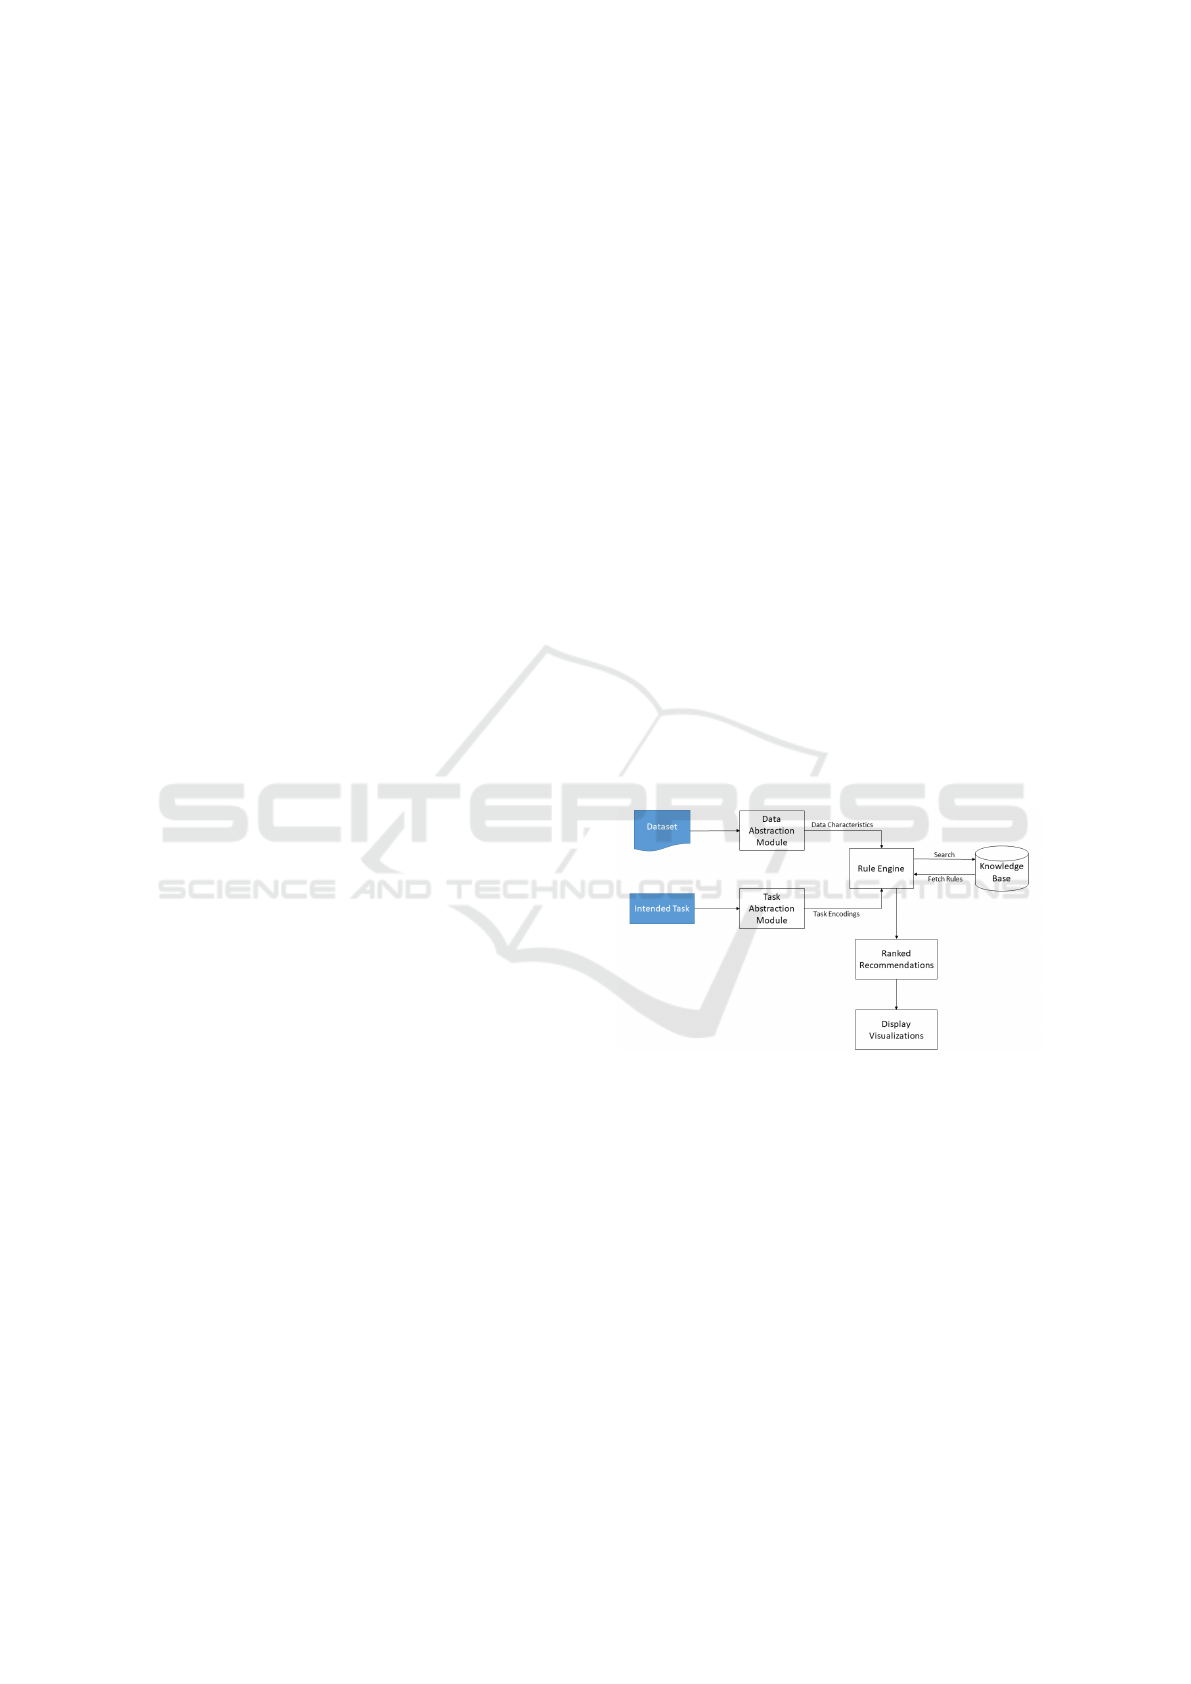
workflow of the developed system is given in Fig 1.
.
Figure 1: System architecture depicting the proposed work-
flow.
3.1 Workflow
As a first step for building our model, we construct a
forward-chained Knowledge Base, which is used for
storing recommendation rules. We justify the use of
a knowledge base for handling the cold start problem
as well as to ensure that the system is unbiased and
generic, regardless of the domain it is used in. The
Knowledge Base stores rules which are based on the
data characteristics (extracted in the Data Abstraction
module) and the intended tasks of the user which are
mapped from the user input in the task abstraction
module (see Figure 1).
KDIR 2021 - 13th International Conference on Knowledge Discovery and Information Retrieval
60
Data characteristics include aspects such as the
number of dimensions required for visualization, the
type of data in the dimension to be visualized (dis-
crete/continuous/temporal) as well the data format
(numerical/categorical). Whereas, the intended task
includes the type of relationship the user wants to ex-
plore within the dataset through the generated visual-
izations.
Data Abstraction Module:
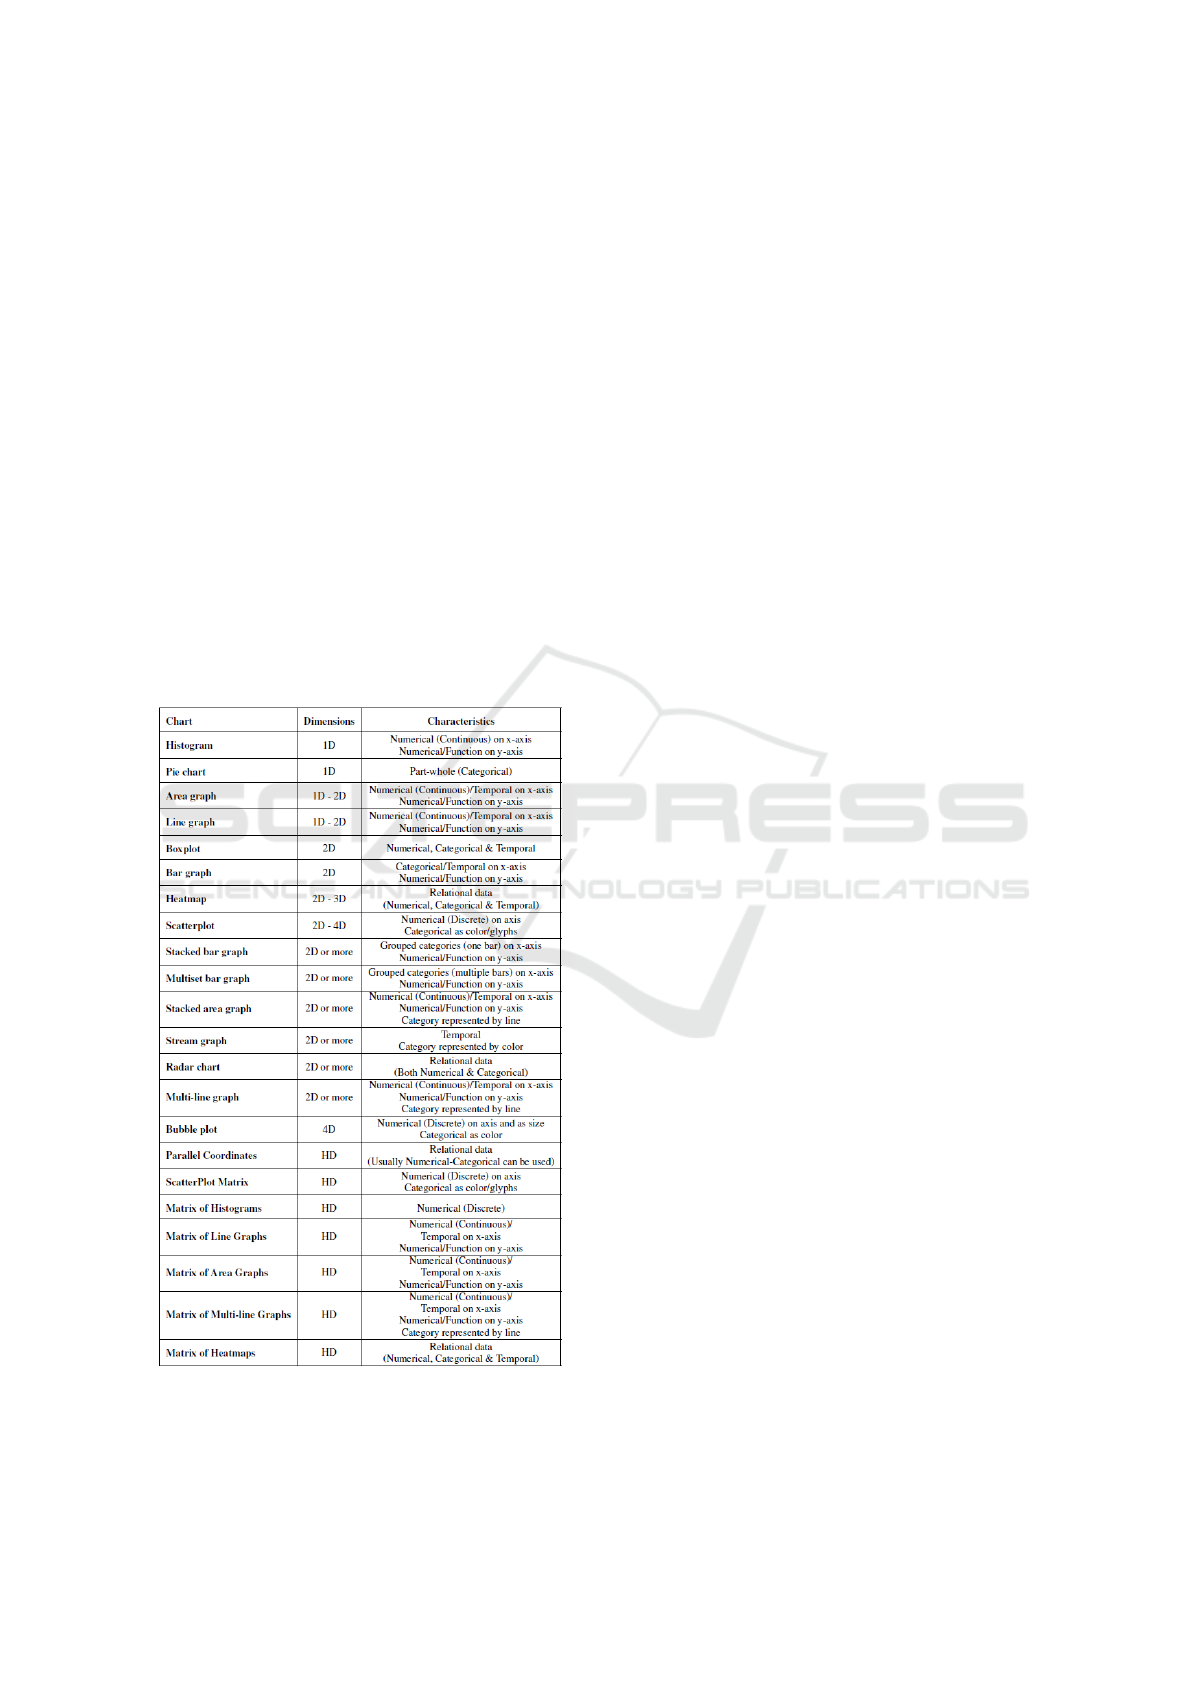
To generate visualization rules, based on data charac-
teristics, we first create a chart vocabulary consisting
of 16 visualization types and 6 matrix visualizations.
The purpose of this Chart Vocabulary is to map multi-
ple types of visualization techniques to the character-
istics of data with varied dimensions. In Table 1 we
present the complete chart vocabulary. Next, we will
explain how we use our proposed chart vocabulary to
construct the rules for the Knowledge Base.
Table 1: Visualization Chart Vocabulary.
Task Abstraction Module:
In Figure 1, we see that the intended tasks are encoded
into rules which would later be used to establish a
mapping between user tasks and recommended visu-
alizations. The intended task is a significant decision-
maker in the selection of the type of visualization
techniques. In order to ensure that no expertise do-
main knowledge is required for the recommendation
system, abstraction of the intended task from the user
is performed. The process of task abstraction is mod-
eled in a tree structure as shown in Figure 2. This
process consists of multiple levels of abstraction be-
ginning with a set of easy to understand questions for
the user, which is the only input required from the
user. The remaining levels are constructed automat-
ically within the recommendation system. We map
the user inputs to the abstracted tasks for the follow-
ing questions:
• Do you want to find the distributed range, average
or extrema of data dimensions?
• Do you want to split data into categories for filter-
ing and analysis?
• Do you want to sort or identify the trend of tem-
poral and continuous dimensions?
• Do you want to analyze the effect of one dimen-
sion on another?
• Do you want to retrieve specific values or identify
correlated dimensions, outliers or clusters?
The response is then mapped to high-level tasks
comprising of Distribution, Part-to-Whole, Change
over Time, Comparison and Relationship. These
high-level tasks were further mapped to several
atomic tasks. The atomic tasks provide finer gran-
ularity over the generic user-intended tasks and are
used to establish relationships between the user tasks
and supported visualization. Next, we would describe
how these relationships are captured into generic rules
that are stored in the Knowledge Base of the recom-
mendation system.
Rule Construction:
In this paper, we present a formal theory of gener-
ating recommendation rules which are stored in the
knowledge base. The purpose for the formalization
of rules is to help design a less error-prone and more
efficient knowledge base in a dynamic manner which
ensures further rules can easily be added to the rule
engine. This approach is a more flexible one as com-
pared to a hard-coded static knowledge-based rule set.
For defining the building block of our rule set, we in-
troduce the concepts of Attributes.
Towards a Rule-based Visualization Recommendation System
61
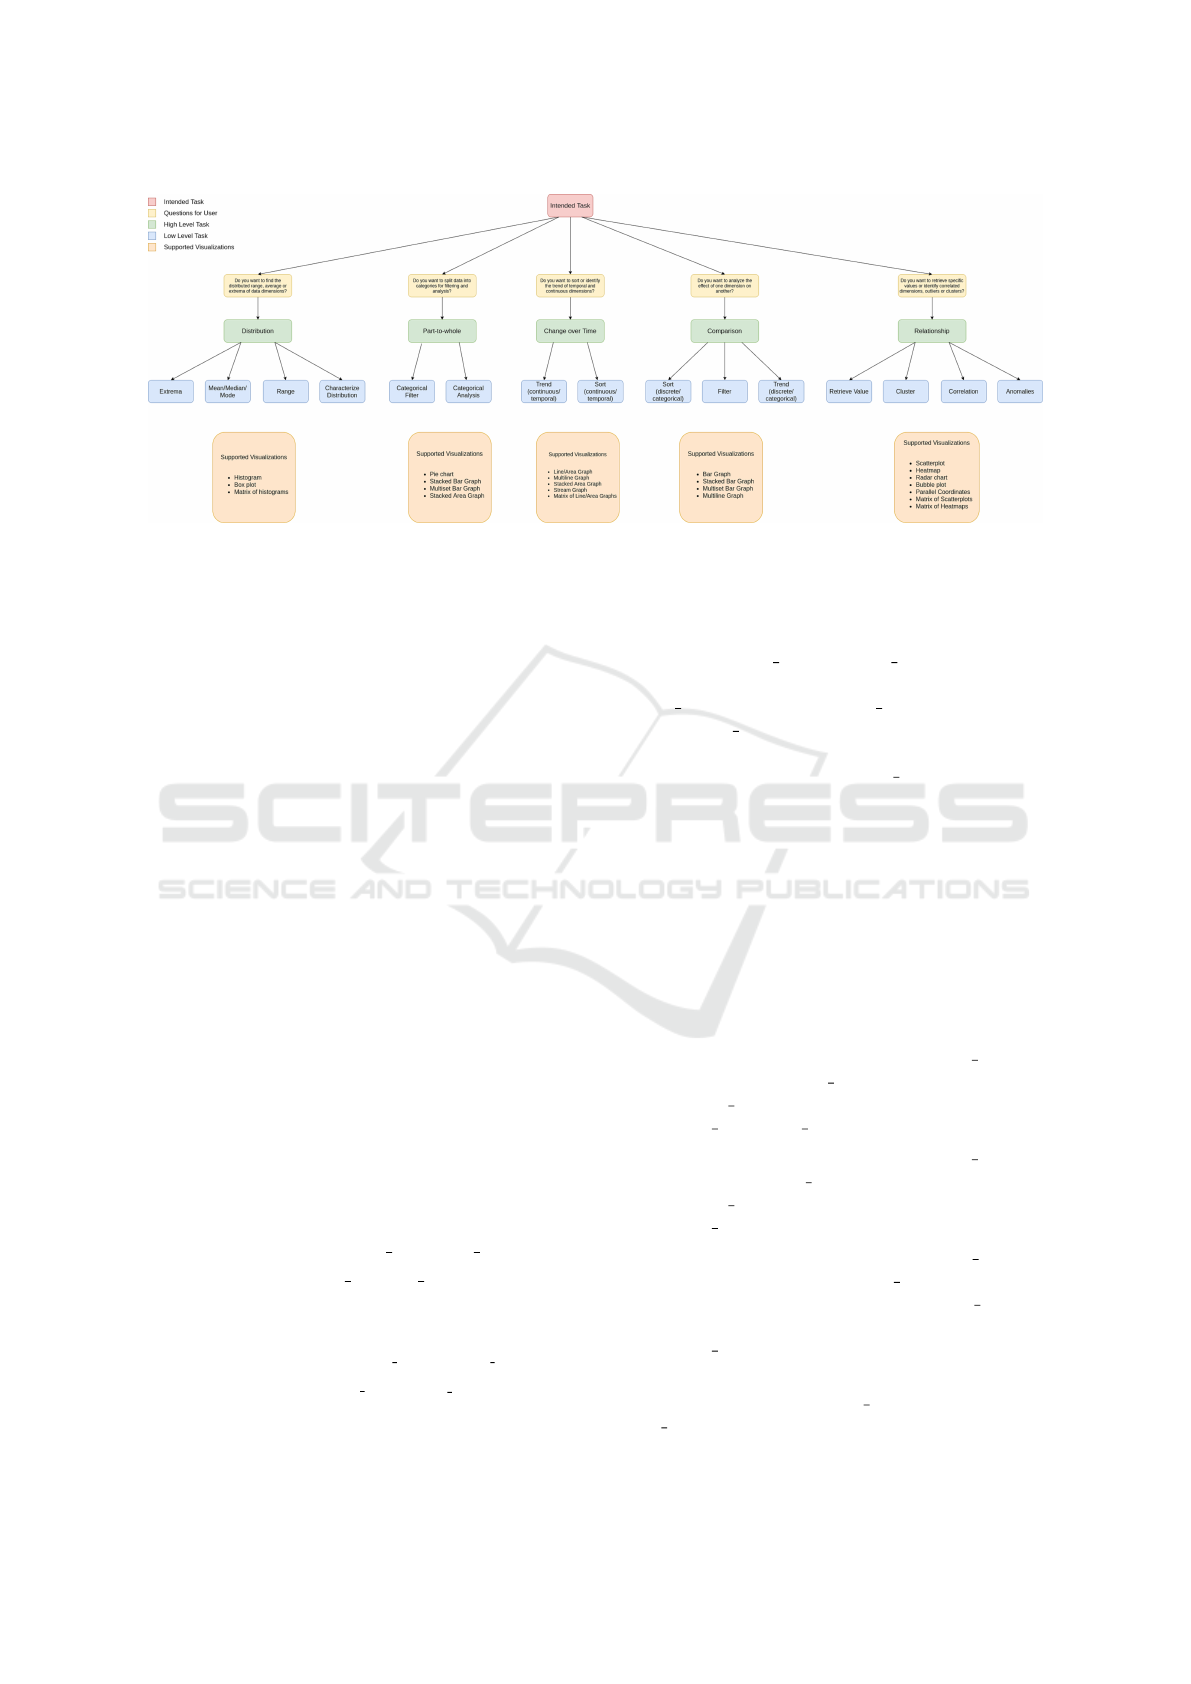
Figure 2: Task Abstraction Encodings.
We define Attributes (A) as the state of the system
based on which a rule is fired. Every attribute is as-
signed a value from a specified domain set D, where
D = D
1
∪ D
2
∪ . . . D
n
and D
i
is the finite domain for
attribute A
i
(A
i
∈ A, i = 1 . . . n). Attributes are further
divided into two types, atomic and composite. For-
mally, the distinction between atomic and compos-
ite attributes is given as A = A
a
∪ A
c
, A
a
∩ A
c
=
/
0.
An atomic attribute can only be assigned one do-
main value at a time and represented by the function:
A
i
: V → D
i
, while a composite attribute can be as-
signed multiple domain values and represented by the
function: A
i
: V → 2
D
i
, where V is a value or set of
values, D
i
is the domain for attribute A
i
and 2
D
i
is the
subset of values taken from D
i
.
The current state of a rule engine is defined as the
conjuction of the current values of all the attributes in
the system as is represented as:
s : (A
1
= V
1
) ∧ (A
2
= V
2
) ∧ ··· ∧ (A
n
= V
n
)
where V
i
is the current value for attribute A
i
and
V
i
∈ D
i
(atomic attributes) or V
i
⊆ D
i
(composite at-
tributes). Unknown or unspecified state value for an
attribute A
i
is denoted as A
i
= null.
Following is an example to further explain at-
tributes within our proposed visualization recommen-
dation system. We define the set of attributes in the
visualization recommendation system as:
A = {dimensionality, data type,data f ormat,
intended task, rec visualizations}
The domains are formulated as:
D = {D
dimensonality
∪ D
data type
∪ D
data f ormat
∪D
intended task
∪ D
rec visualizations}
The attribute dimensionality is an example of a
composite attribute and can be further divided
into low dimensionality (L
D
) and high dimension-
ality (H
D
), where L
D
⊂ D
dimensionality
, L
D
≤ 5D,
H
D
⊂ D
dimensionality
, H
D
> 5D and L
D
∩ H
D
=
/
0.
The attributes data type and data format are atomic
attributes and can have a single value at a time such
as data type = discrete and data format = numerical.
The intended task attribute is also a composite
attribute, e.g. for the intended task of comparison
of part data to total, the intended task attribute will
be {Part-to-Whole, Hierarchical}. The last attribute
consists of a set of recommended visualizations for
the user and is a composite attribute as well, having
one or multiple recommended visualizations as its
value. Using the above formalization of the rule
engine we define the generic rules for the recommen-
dation systems that are constructed and stored in the
Knowledge Base.
Below we show a sample set of our constructed
rules:
• r
1
: [(dimensionality = 1) ∧ (data type =
{continuous}) ∧(data f ormat = {numerical})∧
(intended task = changeOverTime)]
→ [(rec vis := line graph)]
• r
2
: [(dimensionality = 2) ∧ (data type =
discrete) ∧ (data f ormat = numerical) ∧
(intended task = Comparison)]
→ [(rec visualizations := {BarGraph})]
• r
3
: [(dimensionality = 4) ∧ (data type =
{discrete}) ∧ (data f ormat =
{numerical, categorical}) ∧ (intended task =
correlation)]
→ [(rec vis := scatterplot)]
Based on the above rules, if data abstraction attributes
(dimensionality > 3) ∧ (data type = {discrete}) ∧
(data format = {numerical}) are provided as the cur-
KDIR 2021 - 13th International Conference on Knowledge Discovery and Information Retrieval
62
rent state of the system, rule r
3
is fired and the gener-
ated recommendations set is {scatterplot}.
Knowledge Base Construction:
The above formalizations for the rule generations are
extended for the construction of the Knowledge Base.
We propose a formal design principle, using which
the Knowledge Base could be easily extended to in-
corporate rules on the fly.
Firstly, we define a rule r = (COND, DEC, ACT ),
where COND is the conjunction of a set of condi-
tions that are to be fulfilled for the rule to be fired
and can be represented as [µ
1
∧ µ
2
∧ ··· ∧ µ
n
], where
µ
i
∈ COND, i = 1. . . n and COND is the set of all con-
ditions. DEC is the decision part of the rule, which
assigns values to attributes when the rule is fired and
can be represented as [λ
1
∧ λ
2
∧ ··· ∧ λ
m
], where λ
i
∈
DEC, i = 1 . . . m and DEC is the set of all decisions.
ACT is the transition in the system by performing cer-
tain actions based on the rule. Hence, we define an
atomic rule r as LHS(r) → RHS(r), DO(ACT ), where
LHS(r) is the conditional part of the rule, RHS(r) is
the decision part and DO(ACT ) is the independent
set of actions performed by the rule. An ordered
set of knowledge-based rules having the same rule-
set schema can be grouped in the form of a table. A
table is formally defined as: t = (r
1
, r
2
, r
3
. . . , r
n
). In
the case of multiple tables, such as the decision ta-
bles for task abstraction to extract the intended task
for the recommendation system, the concept of inter-
table connection links is applied. A connection link
is an ordered pair: c = (r,t), c ∈ R × T , where R is
the set of rules in the knowledge base and T is the
set of tables. Each individual rule has its own con-
nection link and based on the rule fired, the respec-
tive connection link transfers control from the table
containing the rule to the next table connected by
it. All the tables and connection links grouped to-
gether form a knowledge base for the recommenda-
tion system. The complete knowledge base can for-
mally be represented as K = (T,C) where T is the
set of all tables in the knowledge base and C is the
set of all connection links that connect rules within
T . In context with the visualization recommenda-
tion system, the set F represents the set of features
of the dataset imported by the user. The set D
T
repre-
sents all possible supported data types for a feature f
i
where D
T
= {Discrete,Continuous, T emporal} and
f
i
∈ F, i = 1. . . n. The set D
F
represents all possi-
ble data formats for a feature f
i
and is defined as D
F
= {Numerical, Categorical, Relational, Part-whole}
whereas the set I
T
contains the list of intended tasks
supported by the recommendation system and defined
as I
T
= {Distribution, Part to Whole, Change over
time, Comparison, Relationship}. The intended task
is extracted in the form of a decision tree (represented
by Figure 2) with the help of user preferences to en-
sure meaningful and relevant visualization are recom-
mended. The type of visualization techniques sup-
ported by the recommendation system are represented
by the set V
T
= {V
1
,V
2
. . . ,V
v
} where v is the total
number of visualization techniques the recommenda-
tion system can generate. Details regarding these vi-
sualization techniques and their data characteristics
are provided in the Chart Vocabulary.
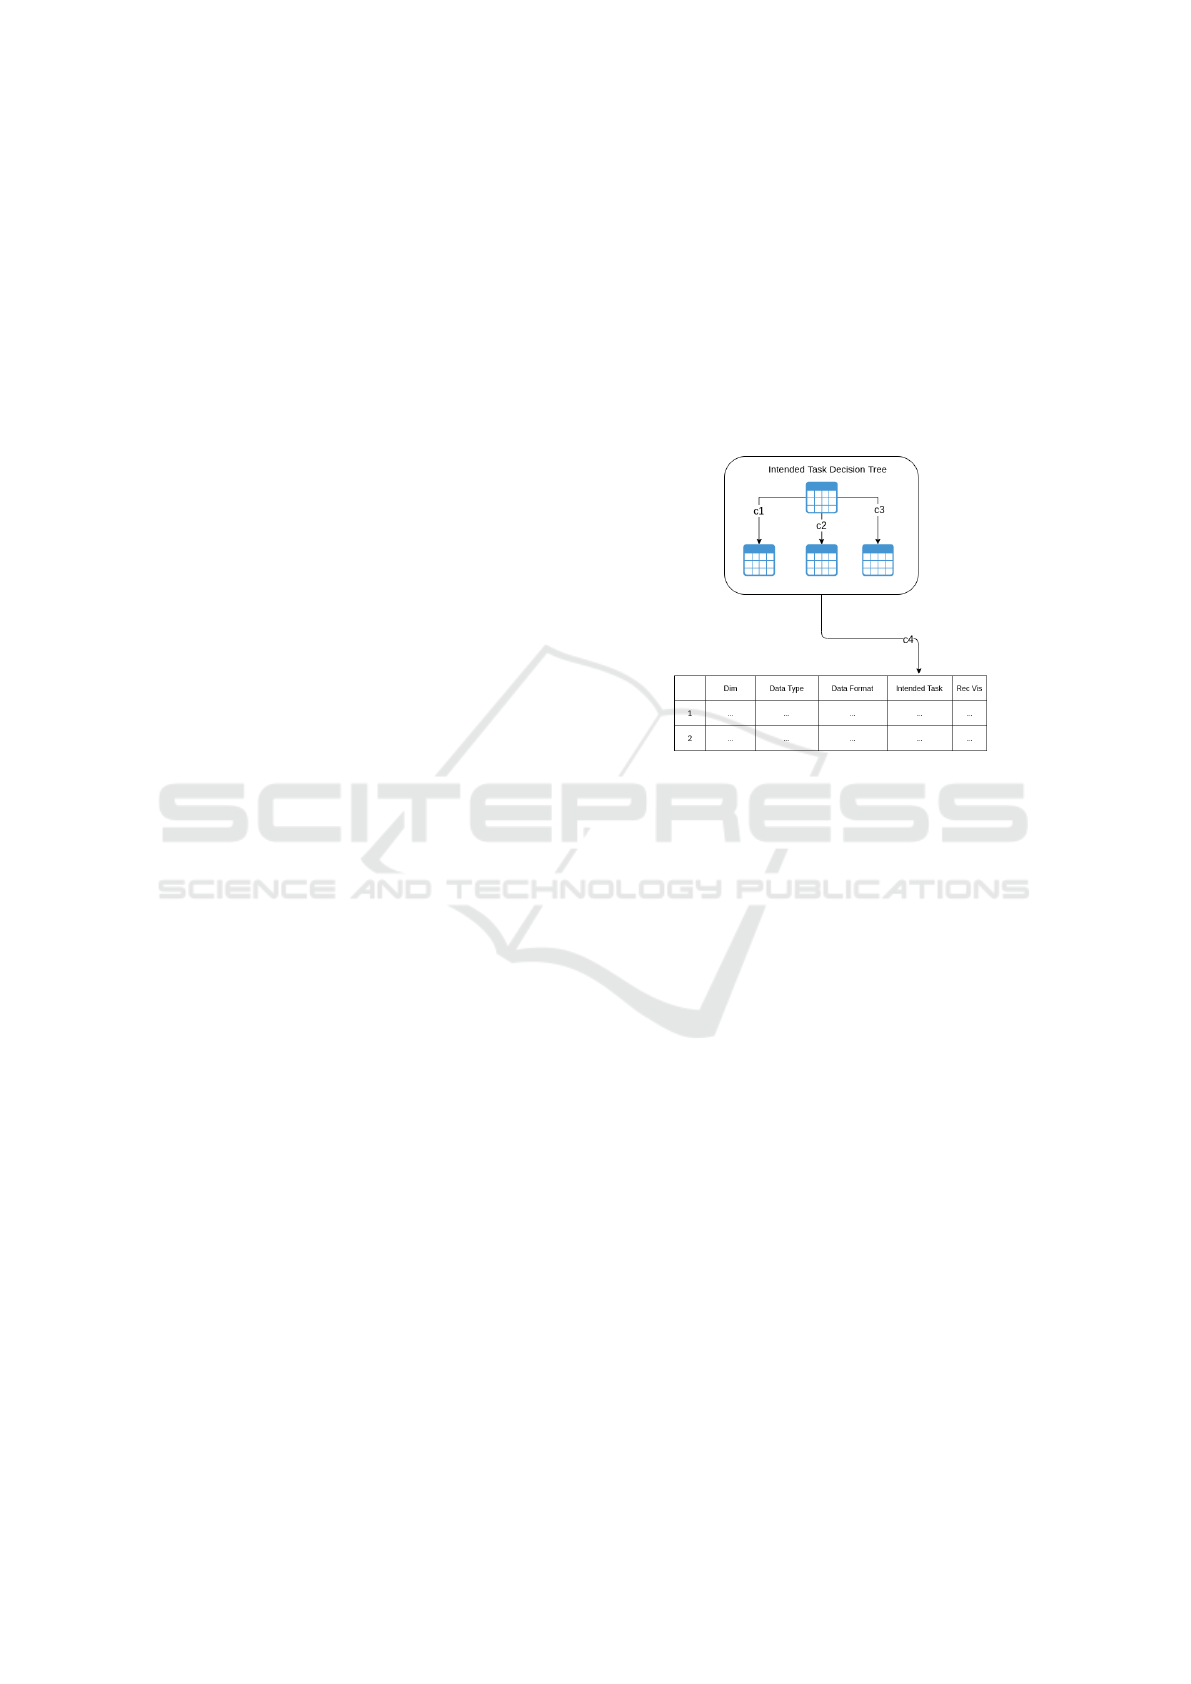
Figure 3: Conceptual Model of the Knowledge Base.
The structure of the knowledge base, based on the
constructed rules, is shown in Figure 3. The knowl-
edge base consists of a decision tree module (Fig-
ure 2) for the intended task as well as a main table
consisting of knowledge-based rules. The connection
links, c1, c2, c3, c4 are used to transfer control be-
tween the tables. The attributes in the main table con-
sist of Dim, Data Type, Data Format, Intended Task,
which are conditional attributes, and Rec Vis, which
is a decision attribute that decides the visualizations
to be recommended. The ACT for the decision tree
component would be to populate the intended task
whereas the ACT for the main table would be to gen-
erate the recommended visualizations. Based on the
domain attribute set A
dim
, D
T
, D
F
, I
T
,V
T
, the schema
for the Knowledge Base can be formally defines as
S
1
= ({A
dim
, D
T
, D
F
, I
T
}{V
T
}).
3.2 Generate Recommendations
Algorithm 1 presents our approach for generat-
ing the visualization recommendations based on the
Knowledge-Based rules. The Knowledge Base con-
structed based on the model, described above, is used
by the rule engine to generate a list of recommended
visualizations. The input parameters for the algorithm
are the list of generated rules, data characteristics ex-
Towards a Rule-based Visualization Recommendation System
63

tracted automatically from the input dataset and the
intended task mapped using task abstraction module.
The algorithm then matches the provided parameters
with the stored rules in a dynamic manner and adds
a visualization to the recommendation list only if all
parameters match the entire relevant visualization rule
fields. For example, Histogram is added to the list if
the dataset contains at least 1 Dimension, Data Type:
Continuous, Data Format: Numerical and High-Level
Task: Distribution. The list of recommendations is
then sent to the Ranking module to sort them based on
the ranking scores assigned to each of the visualiza-
tions and then displayed accordingly to the end-user.
Algorithm 1: Generate Recommendations.
Input: List of knowledge-based rules, data dict =
{task ∈ D
it
, dim ∈ D
dim
, dt ∈ D
dt
, df ∈ D
df
}
Output: List of recommended visualizations rec vis
∈ D
rec vis
1: rec vis = []
2: for rule in knowledge base rules do
3: bool add vis = true
4: for item key, item in data dict do
5: if item 6= rule[item key] then
6: add vis = false
7: end if
8: end for
9: if add vis then
10: rec vis.append(rule[rec vis])
11: end if
12: end for
13: return rec vis
3.3 Ranking
Given a dataset and the set of intended task, our Rank-
ing Module generates the set of top-k visualizations.
The set of recommended visualizations are ranked
based on the statistical properties of the data. We
present our visualization ranking strategy with Algo-
rithm 2. The proposed algorithm makes use of a list
of similarity metrics to sort n items. The source en-
tities (items) are sorted into target entities based on
the most important metric and put into multiple buck-
ets (items with the same score are put into the same
bucket). The items are counted starting from the first
bucket until n items are reached. In the case of mul-
tiple metrics, the remaining similarity metrics are ap-
plied iteratively in the same manner. We define the
ranking score as :
S(S, T ) =
∑
i=1...m
(M
i
(S, T ) ∗
∏
j=i+1...m
b
j
)
where S and T are the source and target entities, m
is the total number of metrics, M
i
(S, T ) is the score
for comparing a target entity against a source entity
based on the metric M
i
and b
j
is the upper bound on
the metric score such that b
j
> max(M
j
(S, T )). Sev-
eral statistical measures are used as metrics for rank-
ing depending on the intended task. These statistical
measures include the calculation of normal distribu-
tion (Task: Distribution), the calculation of increas-
ing/decreasing gradient (Task: Change over Time)
and the calculation of correlation (Task: Compari-
son/Relationship). Based on the user intended task,
the relevant ranking metric (normal distribution, gra-
dient or correlation) is selected along with its respec-
tive threshold value. A score is calculated for the di-
mensions within the dataset and the dimensions out-
side the threshold score are automatically pruned out.
The remaining dimensions are then sorted based on
the score to ensure the highest-scoring dimensions are
displayed first to the user. The calculation of such a
score makes it easier to filter out meaningless visu-
alizations and sort the remaining visualizations based
on their score ensuring the user finds the most useful
recommendations first.
Algorithm 2: Ranking Algorithm.
Input: D = Dimensions, R= rankingMetric
Output: SortedDimensions
1: sorted dims = []
2: for dims in D do
3: Score = calculateScore(dims, R)
4: if Score in Threshold then
5: sorted dims.append(dims)
6: end if
7: end for
8: Sort sorted dims based on Score
9: return SortedDimensions
4 RESULTS AND DISCUSSION
In order to show the usefulness of our approach,
we analyze the use case with the Singapore Airbnb
dataset
1
. We show the recommended visualization for
some of the intended tasks. The generated ranked rec-
ommendations were then compared with the recom-
mendations generated using the ”Show Me” feature
of Tableau
2
.
Experimental Setting. We have conducted our ex-
periments in a server running Ubuntu 14.04, with
two Intel Xeon X5647@2.93GHz CPUs (8 logical
cores/CPU) and 16G RAM. Because of limited space,
we describe the evaluation result only from one use
1
https://www.kaggle.com/jojoker/singapore-airbnb
2
https://www.tableau.com/
KDIR 2021 - 13th International Conference on Knowledge Discovery and Information Retrieval
64

case. However, the extensive evaluation report with
two more usage scenarios can be found here (https:
//figshare.com/s/ef97eb5e7e26374e45a1)
4.1 Singapore Airbnb Data
The Singapore Airbnb Dataset contains multiple fac-
tors that influence the price of the room available. It
consists of 15 influencing dimensions, one target di-
mension (price) and 7922 rows. The data abstrac-
tion layer automatically discards dimensions such as
the serial number (id) column and categorizes the
remaining dimensions based on their characteristics.
It detects two categorical dimensions, neighbour-
hood group and room type as well as three numeri-
cal continuous dimensions: latitude, longitude and re-
views per month. There are no temporal dimensions
in the dataset and the remaining dimensions are cat-
egorized as numerical discrete. Next, we show the
types of recommendations generated of various tasks.
Task: Comparison:
In Figure 4, we present the snapshot of our Recom-
mendation Dashboard. The Heatmap Matrix and
the Matrix of Bar Graphs were the highest ranked vi-
sualizations, recommended by our system. As dis-
cussed before, the user input for the system is two-
fold: (i) importing the dataset and (ii) selection of the
intended task. Once completed, the “Recommenda-
tion” button triggers the back-end engine to perform
data pre-processing and generate mappings according
to the selected tasks. These mappings were then used
by the rule engine to fetch rules from the knowledge
base, generate and rank recommendations and finally
display them in the visualization dashboard.
Task: Distribution:
The recommendation system generates a set of visu-
alizations and presents them in the constructed dash-
board, similar to the ones generated for the compari-
son task as shown in Figure 4. For the lack of space,
we show only the top ranked visualizations which
highlights the distributions of important variables in
the dataset. A histogram matrix and a boxplot matrix
as shown in Figure 5 are the two top ranked visual-
izations. The histogram matrix contains a set of his-
tograms for eight useful dimensions. Analysis regard-
ing multiple factors such as price, availability over the
year, minimum nights and latitude/longitude of avail-
able places can be made using this matrix. Whereas,
the boxplot matrix are generated using both categor-
ical dimensions, the neighbourhood dimension and
the room type dimension. The neighbourhood cate-
gory is split into five regions of the city while there
are three types of rooms (private, shared, entire apart-
ment) within the dataset. Our system recommends the
boxplots, which can easily be analyzed to show that
the Central Region of the city has the highest average
and maximum prices while the North-East Region is
the cheapest available option for a room.
Task: Relationship
(Clusters/Correlation/Outliers).
In order to identify existing relationships within the
dimensions of the dataset, the recommendation sys-
tem generated a Matrix of Heatmaps and two Parallel-
Coordinates charts for both categories, shown in Fig-
ure 6. These visualizations can be used to detect the
existence of clusters, correlation or outliers within the
dataset. For example, the heatmap matrix could iden-
tify the trend in the increasing price of listings moving
from the North Region (less expensive) to the West
Region (more expensive) as well as the magnitude of
the price difference between each room region-wise.
In addition, using the generated Parallel-Coordinates
charts, one can identify how multiple numerical dis-
crete dimensions rely on each other for the provided
categories.
Comparison with Tableau. As a qualitative evalu-
ation for our proposed system, we compare the gen-
erated visualizations for the same task with the rec-
ommendations generated using the Show Me feature
of Tableau. This resulted in a matrix of Stacked Area
graphs for every region. Figure 7 shows the result
with the reviews-per-month and year-of-last-review
on the x-axis, average values of multiple dimensions
on the y-axis and room-type as color. In order to gen-
erate other meaningful visualizations, manual dimen-
sions (room type, neighbourhood group and price)
were selected and the system recommended a Multi-
bar graph for each type of room using color for the
region and the average price on the y-axis (see Fig-
ure 7). Similar visualizations were recommended by
our system as shown in Figure 4 along with multi-
ple other ranked visualizations. Our proposed recom-
mendation system performed better in terms of qual-
itative analysis of results compared to Tableau by not
only generating the visualizations recommended by
Tableau but also generating multiple other ranked vi-
sualization charts based on various statistical metrics
and user intended tasks. Therefore, we conclude that
the recommendation system, presented in this paper,
proves its efficiency in generating automated visual-
izations in turn providing meaningful data insights.
Towards a Rule-based Visualization Recommendation System
65
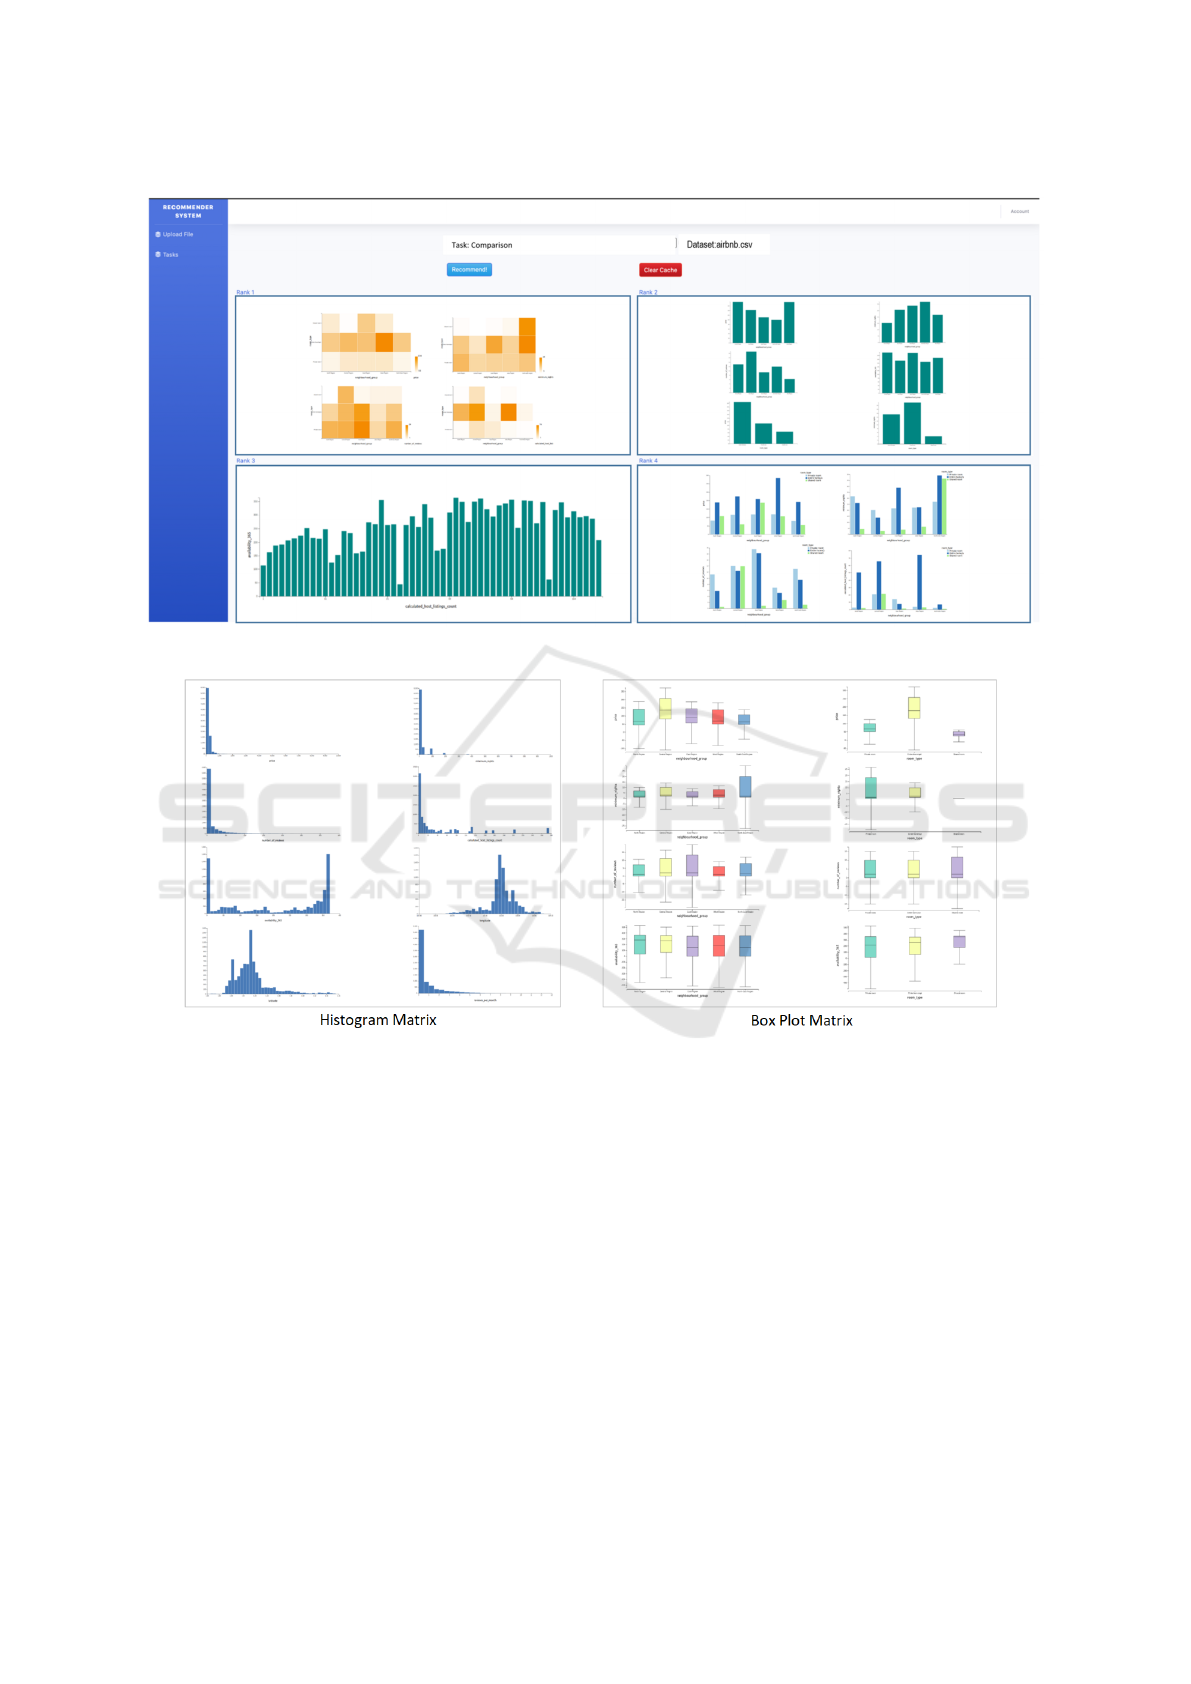
Figure 4: Visualization Recommendation Dashboard for Comparing Data Dimensions.
Figure 5: Recommended Visualization for the Distribution Task.
5 CONCLUSION
In this paper, we present a rule-based recommenda-
tion system that generates and ranks visualizations
by extracting data characteristics and abstracting the
user-intended task. An efficient Knowledge Base was
presented, which mapped the data and the task ab-
stractions as rules. Formal methods for constructing
such a knowledge base, as discussed in this paper,
provide a blueprint for modeling rule-based visual-
ization recommendation systems. What makes this
knowledge-base oriented rule-engine efficient is the
fact that it has been implemented in a completely dy-
namic manner for future enhancements. As far as our
knowledge, there exists no such system in the current
literature which provides a recommendation model
encompassing the entire visualization ecosystem. The
automated workflow, starting from data ingestion and
ending at the recommended visualizations being ren-
dered in the screen for the end-user, is achieved by the
capability of our system to automatically detect data
dimensions and sort them into categories. To address
the ”human-in-the-loop” factor for generating recom-
mendations, we have presented a generic task abstrac-
tion model in form of a hierarchical tree structure that
provides a mapping between the high and low level
intended tasks and the set of visualizations supported
by the relevant tasks.
KDIR 2021 - 13th International Conference on Knowledge Discovery and Information Retrieval
66
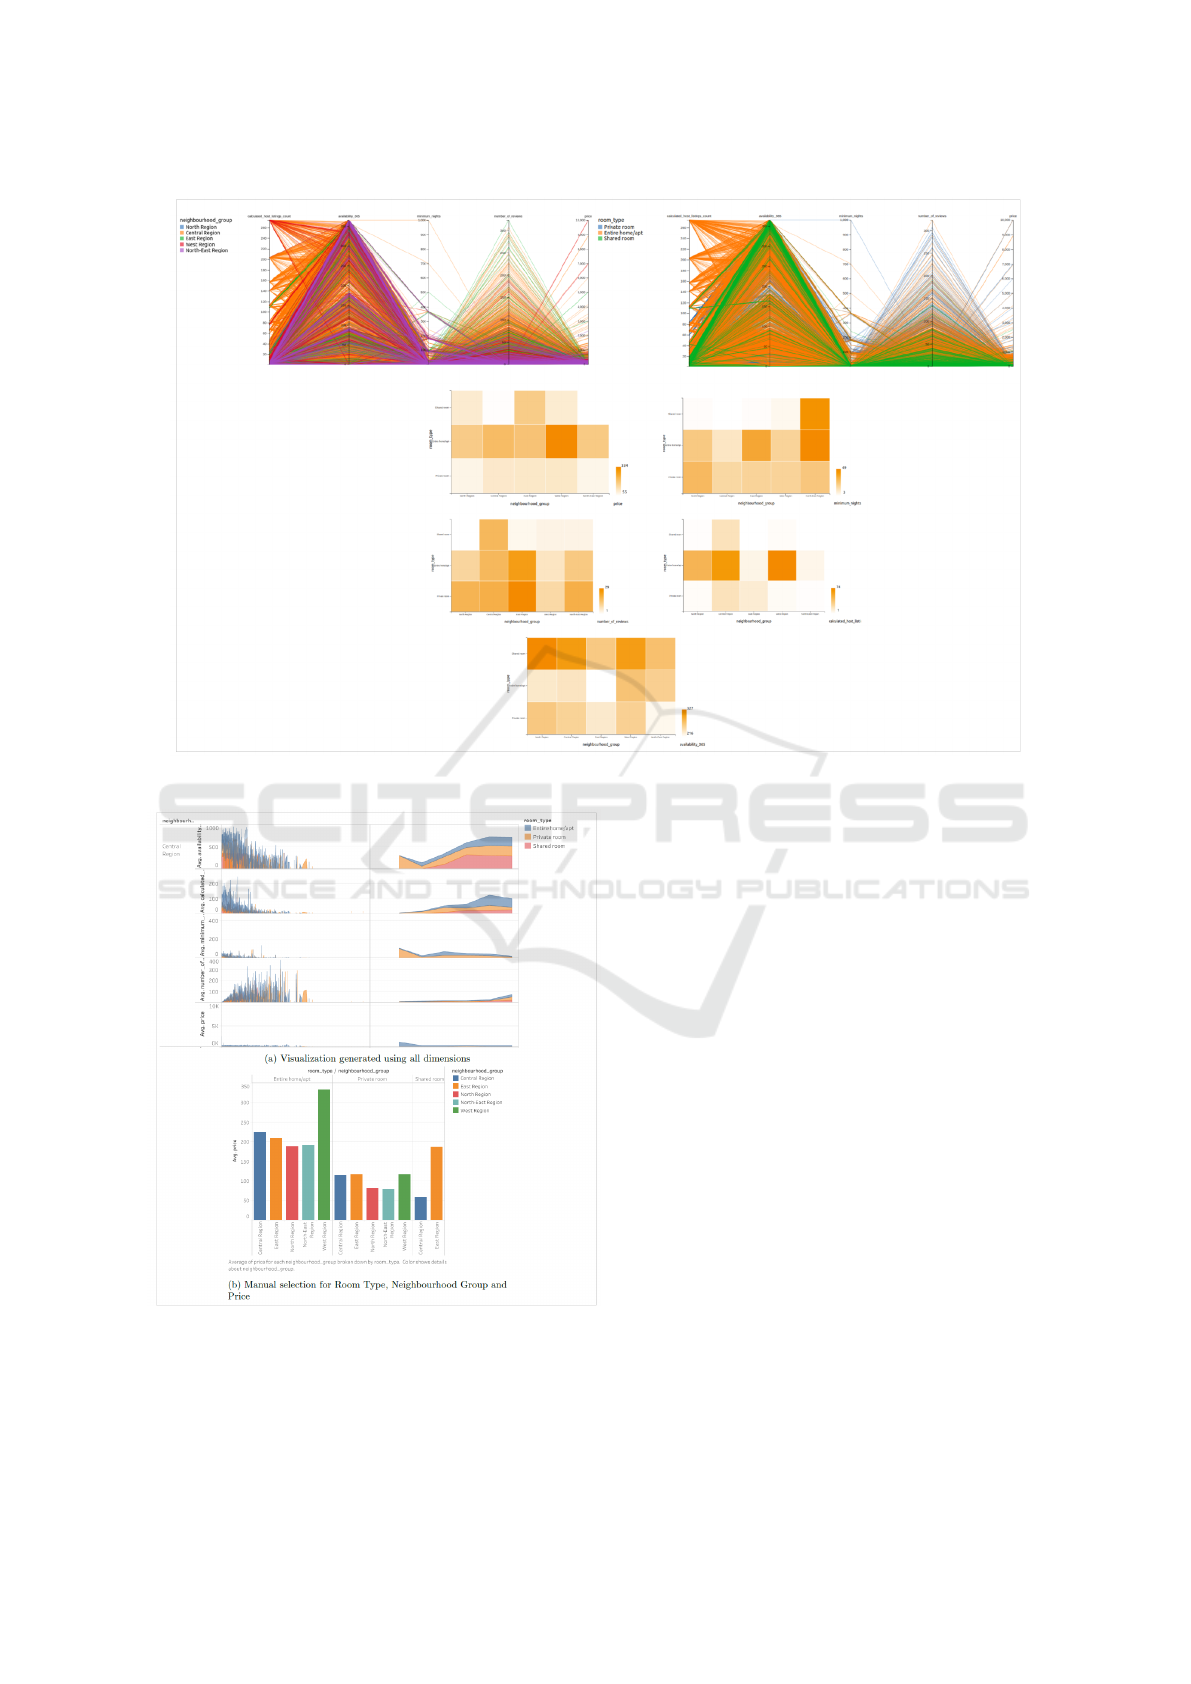
Figure 6: Recommended Visualizations Depicting Relationships.
Figure 7: Visualizations Recommended by the ShowMe
Function of Tableau.
Future Work. The system currently extracts key data
characteristics from each dimension to divide the di-
mensions into respective categories. This module can
further be enhanced by creating a scoring based al-
gorithm to sort the dimensions in terms of usefulness
which can then lead to filtering out irrelevant dimen-
sions in an automated manner. Finally, due to the
recommendation system being generic regardless of
any specific domain field, a large set of visualization
techniques and user intended tasks have been imple-
mented in the system. However, additional enhance-
ments can be made to the existing set of intended tasks
supported by the recommendation system as well as
multiple other visualization techniques not currently
supported, such as a Tree Map, in order to cover
a wider range of user tasks and visualization tech-
niques.
ACKNOWLEDGEMENTS
Funded by the Deutsche Forschungsgemeinschaft
(DFG, German Research Foundation) under Ger-
many’s Excellence Strategy – EXC-2023 Internet of
Production – 390621612.
Towards a Rule-based Visualization Recommendation System
67

REFERENCES
Gotz, D. and Wen, Z. (2009). Behavior-driven visualization
recommendation. In Proceedings of the 14th Interna-
tional Conference on Intelligent User Interfaces, IUI
’09, pages 315–324, New York, NY, USA. ACM.
Hu, K., Bakker, M. A., Li, S., Kraska, T., and Hidalgo, C.
(2019). Vizml: A machine learning approach to vi-
sualization recommendation. In Proceedings of the
2019 CHI Conference on Human Factors in Comput-
ing Systems, pages 1–12.
Kaur, P. and Owonibi, M. (27/02/2017 - 01/03/2017). A
review on visualization recommendation strategies.
In Proceedings of the 12th International Joint Con-
ference on Computer Vision, Imaging and Computer
Graphics Theory and Applications, pages 266–273.
SCITEPRESS - Science and Technology Publications.
Key, A., Howe, B., Perry, D., and Aragon, C. (2012).
Vizdeck: Self-organizing dashboards for visual ana-
lytics. In Proceedings of the 2012 ACM SIGMOD
International Conference on Management of Data,
SIGMOD ’12, pages 681–684, New York, NY, USA.
ACM.
Klumpar, D., Anderson, K., and Simoudis, A. (1994). Rave:
Rapid visualization environment.
Krause, J., Dasgupta, A., Fekete, J.-D., and Bertini, E.
(23/10/2016 - 28/10/2016). Seekaview: An intel-
ligent dimensionality reduction strategy for navigat-
ing high-dimensional data spaces. In 2016 IEEE 6th
Symposium on Large Data Analysis and Visualization
(LDAV), pages 11–19. IEEE.
Luo, Y., Qin, X., Tang, N., and Li, G. (16/04/2018 -
19/04/2018). Deepeye: Towards automatic data vi-
sualization. In 2018 IEEE 34th International Con-
ference on Data Engineering (ICDE), pages 101–112.
IEEE.
Mackinlay, J., Hanrahan, P., and Stolte, C. (2007). Show
me: automatic presentation for visual analysis. IEEE
transactions on visualization and computer graphics,
13(6):1137–1144.
Plotly. Plotly community feed. https://plot.ly/feed.
Satyanarayan, A., Moritz, D., Wongsuphasawat, K., and
Heer, J. (2017). Vega-lite: A grammar of interac-
tive graphics. IEEE transactions on visualization and
computer graphics, 23(1):341–350.
Vartak, M., Huang, S., Siddiqui, T., Madden, S., and
Parameswaran, A. (2017). Towards visualization
recommendation systems. ACM SIGMOD Record,
45(4):34–39.
Vartak, M., Rahman, S., Madden, S., Parameswaran, A.,
and Polyzotis, N. (2015). Seedb. Proceedings of the
VLDB Endowment, 8(13):2182–2193.
KDIR 2021 - 13th International Conference on Knowledge Discovery and Information Retrieval
68
