
The Economic Aspect of Sustainability in Russian Arctic Areas
Ludmila Babkina
1a
and Oksana Skotarenko
2,3 b
1
Northwestern Institute of Management, Branch of the Russian Presidential Academy of National Economy and Public
Administration under the President of the Russian Federation, 57 Sredniy Pr., Vasilievsky Island, 199178 Saint Petersburg
2
Murmansk Arctic State University, 57 Prospekt Lenina, 183034 Murmansk, Russia
3
Military Academy of Logistical Support named after General of the Army A. V. Khrulyov, 8 Naberezhnaya Makarova,
199034, Saint Petersburg, Russia
Keywords: Sustainability, National Project, Arctic Regions, Stability.
Abstract: The article explores different approaches to the term “sustainability” existing in academic literature and used
in practice. It describes three methods – two well-known ones and another one developed by the authors –
used for quantitative assessment of the degree of economic and financial sustainability in regions. The regions
include four Russian federal subjects in the Russian Arctic and three macroregions that include the aforesaid
regions. The indicators used for the assessment are grouped by the following aspects: relevance to national
projects, type of assessment scale, internal or external economic factors, and income or spending in a
consolidated regional budget. The article explores and draws a distinction between the influence of external
factors – indicators of the demographic and natural environments – on the economic sustainability of an area.
A comparative analysis is done for three Russian macroregions and four Arctic regions by degree of economic
and financial sustainability. The regions and macroregions are ranked based on the results of the comparative
analysis using the selected indicators. The ranking helps identify potential strategic vectors and their
succession as well as criteria for improvement of economic sustainability in the Russian Arctic.
1 INTRODUCTION
The relevance of the study is determined by the fact
that there are several approaches to the term
“sustainability”.
The first approach implies that sustainability is a
balanced and proportionate development of three
macro-environments – economy, demographics, and
(natural) environment – in any area. The approach
became widespread in the late 20
th
century after the
Rio de Janeiro UN Conference followed by the
signature of a number of environment-related
documents, including influential ones, such as the
Kyoto Protocol and the Paris Agreement. The
approach has dominated in many developed countries
with a post-industrial service-based economy
(Concept, 1993; Towards, 2018).
Russia is currently implementing its national
projects aimed at improved sustainability in its
regions, including land areas of the Russian Arctic
a
https://orcid.org/0000-0001-5018-0191
b
https://orcid.org/0000-0002-5255-5564
(On national projects, 2020). Therefore, out of all
interconnected processes, we have to focus on the
economic ones and view the achievement results of
demographic and environmental goals as external
factors to these economic processes (Bulletin, 2020).
The second approach to sustainability is used in
financial relations on both the micro level, i.e. in
business entities, and macro level, i.e. in regional
financial management systems. Therefore, financial
sustainability applies to both businesses and
territories, including regions. It is determined by
internal factors.
Consequently, economic sustainability is
determined by two groups of factors: internal and
external. In this study, factors are expressed as
indicators of annual government statistics reports.
The third approach is not based in research but
often used in practice, when sustainability is
understood as stability. Stability, in its turn, can be
understood either as a long-term stagnation or as a
distinct trend. Stagnation means lack of economic
342
Babkina, L. and Skotarenko, O.
The Economic Aspect of Sustainability in Russian Arctic Areas.
DOI: 10.5220/0010668200003223
In Proceedings of the 1st International Scientific Forum on Sustainable Development of Socio-economic Systems (WFSDS 2021), pages 342-348
ISBN: 978-989-758-597-5
Copyright
c
2022 by SCITEPRESS – Science and Technology Publications, Lda. All rights reserved

growth. A trend is determined by an increasing
positive or negative change in economic indicators. A
steady-state economy is an economy with relatively
stable major indicators, such as population or
consumption, whose scope does not exceed the
carrying capacity of the ecosystem. The term often
applies to national economies but can be used to
analyse economic systems of cities, regions, or the
world.
2 THE STUDY METHODOLOGY
The study is based on the main principles of the
systemic, comprehensive, and qualimetric
methodological approaches, employing a
proportionate and balanced assessment of the
condition of, pollution levels in the environmental
components, and conservation spending. The study
uses the statistical and index methods of regional
qualimetry and the methods of financial and
economic analysis.
Developing methodological approaches to
studying regional economies. For example, academic
literature suggests using economic digitalisation tools
to identify extreme structural components of
economic potential growth in regions (Babkin et al.,
2019).
It is possible to use the qualimetric
methodological approach to address the major issue
of using a novel scholarly and methodological
framework in managing territorial processes in the
Arctic (Kozin and Plotnikov, 2019).
A number of studies are dedicated to minimising
and mitigating environmental risks in the Russian
Arctic (Bykovskaia et al., 2021).
3 RESULTS AND DISCUSSION
Regional sustainability assessment is important
because development of Arctic areas has been
declared a priority strategic activity by the Russian
Government, where the Ministry for Development of
the Russian Far East and Arctic was established in
2012 (Concept, 1992). Out of all Russian Arctic land
areas, we have chosen only four regions as objects of
study. They all have their indicators in annual
government statistics reports. It is Murmansk Oblast
and three Autonomous Okrugs: Nenets, Yamalo-
Nenets, and Chukotka (On Land Territories, 2016).
Sustainability of Russian Arctic regions will be
improved, as a whole and in terms of economic
processes, by implementation of the respective
national and federal projects adopted in 2018 and
2020. The projects contain strategic development
goals until 2024 and 2030 and their implementation
criteria in each region for both internal and external
economic factors. (On national development goals,
2020).
In particular, scholarly literature contains studies
on how and to what extent (degree) the national
projects implemented in demographics and the
environment affect the upward and downward
changes in major economic indicators (National
Projects, 2020). Those national projects include
Demographics and Ecology implemented via their
respective five and ten federal projects.
The Ecology Project has had a generally positive
effect on economic growth in Russian regions, which
was 0,05% in 2020 and projected to reach 0,06% in
2021. The projections will, however, be adjusted
because of the pandemic.
Academic studies show that the Demographics
Project has had a negative influence on regional
economies. However, experts predict that the
negative effect on economic indicators will slightly
decrease in 2021 compared with 2020 (-0,23%).
Thus, the share of the National Projects for
Demographics and Ecology in the overall Russian
economic growth was 24,34% in 2020, expected to
reach 27,26% in 2021 or 30,96% given the projected
changes.
It should be noted that the National Project for
Demographics has influenced the annual economic
growth significantly more that the National Project
for Ecology: by a factor of 4,19 in 2020 and 3,92 in
2021 or 4,21 given the projected changes.
Not one but four national projects have been
developed for improvement of economic indicators:
Productivity and Employment, Digital Economy in
Russia, Small and Medium Businesses and Support to
Private Enterprise, and International Cooperation and
Exports. The biggest increase in economic
development, equal to 0,09% in 2020, resulted from
the Project for a Digital Economy in Russia, and the
Project for Productivity and Employment accounted
for the lowest increase of 0,01%, which is different
by a factor of 15,33. Lower growth degrees of the
indicator in question were obtained from the Projects
for International Cooperation and Exports (0,07%)
and Medium Businesses and Support to Private
Enterprise (0,05%), which is lower than the top value
by 26,03% and 76,92%. In 2021, the National Project
for a Digital Economy in Russia should account for a
0,1% economic growth, but, given the changing
internal and external factors, the figure is expected to
The Economic Aspect of Sustainability in Russian Arctic Areas
343

be 0,07%, which is lower by a factor of 1,32 or by
32,43% than otherwise would in favourable
conditions. The expected growth figures in 2021 for
the other three projects – Productivity and
Employment, Small and Medium Businesses and
Support to Private Enterprise, and International
Cooperation and Exports – will be lower than in 2020
by 20%, 30%, and 23,73%, respectively, given
favourable conditions. In unfavourable conditions,
the indicator will be lower by a factor of 3, 1,44, and
1,66, i.e. by 200%, 44, and 66%, respectively.
Consequently, the most significant negative effect
on growth rates in regional economies, including
those in the Arctic, is caused by the National Project
for Demographics. The other national projects have a
less significant yet positive effect. The second place
is held by the Project for a Digital Economy in Russia,
the third by International Cooperation and Exports.
Two projects hold the fourth place: Small and
Medium Businesses and Support to Private Enterprise
and Ecology. The final, fifth place is held by the
Project for Productivity and Employment.
We believe that the classification of the national
projects by their influence reflects the spending on the
projects. The share of spending for the National
Project for Demographics amounted to 4,19% of the
government spending on its social policy. The Project
for Ecology accounted for 38,46% of the environment
conservation spending.
The largest share, equal to 2,43% of the
consolidated government spending on the national
economy, belonged to the National Project for a
Digital Economy in Russia, one of the four economic
projects. The smallest share of 0,16% was spent on
the Project for Productivity and Employment. The
National Projects for International Cooperation and
Exports and Medium Businesses and Support to
Private Enterprise accounted for their respective
shares of 1,94% and 1,36%. As a result, the
cumulative share of spending on the four projects was
12,96% in 2019.
The comparative analysis of economic indicators
in the Arctic regions has been done using the
transparency principle. All of the required absolute
and relative indicators, including those required for
calculation of specific values, are taken from the
annual government statistics reports (Regions of
Russia, 2020). The main idea behind the comparative
analysis is to identify the positions of each region in
a reporting year by the selected quantitative indicators
in order to compare and rank them relative to the other
Arctic regions. Besides, the suggested comparative
analysis involves comparing the quantitative regional
indicators with, first, the average figures in the
respective macroregion (federal district), secondly,
with the quantitative indicator values in Russia as a
whole. A similar comparison is also made for each
indicator between the macroregions (federal
districts), identifying the position of the macroregion
relative to the other ones and the indicator value in
Russia as a whole.
For further studies, the available indicators were
grouped by several aspects.
The first aspect is whether the indicator applies to
national projects, e.g. Digital Economy in Russia. By
this aspect, the group includes the indicators required
for monitoring the performance of national projects.
The second aspect is the type of assessment scale
(direct or inverse), which means that the comparative
ranking of the region depends on the meaning of the
absolute or relative indicator. The aspect can also be
called a vector of influence: positive or negative.
Positive influence means the highest indicator value
is ranked the highest, with an increase in the value
improving the position of the region. Negative
influence means that an increase in the indicator value
describes a deteriorating situation in the region. The
first (direct) scale means that the top rank is assigned
to the region with the highest (maximum) indicator
value, the other ranks to be assigned in descending
order. The second (inverse) scale means that top rank
is assigned to the lowest indicator value, the other
ranks to be assigned in ascending order.
In the annual government statistics reports,
regional economic conditions are monitored using
just one performance indicator from the National
Project for a Digital Economy in Russia. It is the share
of households with broadband Internet access. The
share of those households is 73,2% in Russia on
average. In the Northwestern Macroregion, the share
is larger and equal to 76,5% (1
st
rank), with the share
being 75,4% (2
nd
rank) in the Urals and 71,2% (3
rd
rank) in the Far East. In the regions, the largest share
of households with Internet access is in Yamalo-
Nenets AO (96,3%), ranked first. The second rank
belongs to Murmansk Oblast (82,4%), the third to
Chukotka AO (59,1%), and the fourth to Nenets AO
(56,0%). The difference (96,3–56,0) is 40,3%, with
the maximum being different from the minimum by a
factor of 1,72.
There are no monitored indicators in the other
economy-related national projects: Productivity and
Employment, Digital Economy in Russia, Small and
Medium Businesses and Support to Private
Enterprise, and International Cooperation and
Exports. We will therefore use the main
socioeconomic indicators describing the conditions in
Russian regions as well as other statistical data
WFSDS 2021 - INTERNATIONAL SCIENTIFIC FORUM ON SUSTAINABLE DEVELOPMENT OF SOCIO-ECONOMIC SYSTEMS
344

(Regions of Russia, 2020).
To assess the performance of the National Project
for Productivity and Employment, we will use two
indicators. The first indicator is a specific one,
calculated as the gross regional product (GRP) per
employed person. The second indicator is a statistical
one: unemployment. The calculations show that the
gross regional product per employed person was
1047,024 thousand RUB in 2018 in Russia on
average. In the Ural Macroregion, the indicator was
1,61 times higher, equal to 1680,772 thousand RUB.
In the Northwest, the indicator value was 1157,47
thousand RUB, slightly exceeding the Russian
average by a factor of 1,1 or by 10,5%. The Far
Eastern Macroregion had a lower indicator value of
962,219 thousand RUB, which is lower than the
Russian average by 8,1% and by a factor of 1,75
(74,7%) and 1,2 (20,3%) that the Ural and
Northwestern Macroregions, respectively.
A comparison of the indicator in the Arctic
regions shows that the highest value of 8694,5
thousand RUB per capita belongs to Nenets AO
(1
st
rank), the lowest, 1225,048 thousand RUB per
capita, to Murmansk Oblast (4
th
rank). The second
rank is held by Yamalo-Nenets AO, with its GRP per
employed person being 5892,848 thousand RUB. The
third rank is held by Chukotka AO, where the
indicator value is 2063,93 thousand RUB per capita.
The respective values are lower than the maximum
value by a factor of 1,48 (47,54%) and 4,21
(321,26%). The difference is 7469,45 thousand RUB
per capita, with the ratio of the maximum value to the
minimum value being 7,1 (609,76%).
The second indicator, unemployment, was 4,8%
in Russia. The areas are ranked on an inverse scale,
and for the macroregions, it was as follows: the first
rank was held by the Northwest (3,9%), the second by
the Urals (4,7%), and the third by the Far East (6,3%).
The unemployment level was therefore lower that the
national average in two macroregions by a factor 1,23
and 1,02. In the third macroregion (Far East), it is 1,31
times higher.
A comparison of the unemployment level in the
Arctic regions has shown that the lowest indicator
value of 2,1% was observed in Yamalo-Nenets AO
(1
st
rank), the highest, 8,1%, in Nenets AO (4
th
rank),
with the variation of 6% or 3,86 times. That lowest
unemployment level is lower than the national
average and the Ural Macroregion by a factor of 2,29
and 2,24, respectively. It is noteworthy that the
Nenets region has both the highest GRP per employed
person and the highest level of unemployment.
Chukotka AO is ranked second (3,1%) and
Murmansk Oblast third (6,8%). The lowest
unemployment level is therefore exceeded by the two
regions by a factor of 1,48 and 3,24, respectively.
The average number of (non-outsourced) small
business employees per 1,000 people annually
employed in the regional economy can be considered
a performance criterion for National Project for Small
and Medium Businesses and Support to Private
Enterprise. There are no statistical data for medium
businesses.
On average, there are 149,8 people employed by
small businesses per 1000 employed people in
Russia. In the macroregions, the following numbers
of those employees were observed: 177,36 people in
the Northwest, 140,06 people in the Urals, and 134,42
people in the Far East. Therefore, the value exceeded
the national average only in the Northwestern
Macroregion, by a factor of 1,18 (18,4%). In the Ural
and Far Eastern Macroregions, the number was lower
by a factor of 1,07 (6,95%) and 1,11 (11,44%).
In the Arctic, the largest number of people
employed by small businesses was observed in
Murmansk Oblast: 110,74 people per 1,000 employed
people (1
st
rank). However, it is 1,35 times lower than
the Russian average (by 35,27%) and 1,6 times lower
than that of the Northwestern Macroregion (by
60,16%). The lowest value was in Nenets AO, where
the number was 50,31 people (4
th
rank), which is
lower than in leading Murmansk Oblast by 60,43
people or by a factor of 2,2 (by 120,1%).
Chukotka AO had a number almost identical to
that of Nenets AO: 54,05 people (3
rd
rank), 2,05 times
(by 104,88 %) behind the leading region and by
15,22% behind Nenets AO. The second rank belongs
to Yamalo-Nenets AO with its number of 62,49
people, lagging behind Murmansk Oblast by a factor
of 1,77 (77%).
To assess the performance of the National Project
for International Cooperation and Exports, an
indicator was calculated for exports to neighbouring
and other countries per employed person in the
regional economy. The value for Russia is 6,280
USD. In the Northwestern, Ural, and Far Eastern
Macroregions, it is 7184,4 USD, 6446,3 USD, and
7244,88 USD, respectively. Therefore, the indicator
in the Northwestern Macroregion exceeds the export
amount per employed person in Russia by a factor of
1,144 (by 14,4%). The positions of the Far Eastern
and Northwestern Macroregions are almost the same,
the difference being a mere 0,9%, with the Urals
exceeding the national average by a factor of 1,026 or
2,6%.
In the Arctic region, Murmansk Oblast was
ranked first, with its export amount of 10026,4 USD
per employed person in its economy. The second
The Economic Aspect of Sustainability in Russian Arctic Areas
345
rank was held by Yamalo-Nenets AO (7181,95 USD),
the third by Chukotka AO (4000 USD), with their
respective values below leading Murmansk Oblast by
a factor of 1,4 (39,6%) and 2,5 (150%). There are no
statistical data for Nenets AO. The variation was
6026,4 USD or 2,5 times.
Thus, as shown in Table 1, the macroregions are
ranked by five economic indicators, and the
Northwestern Macroregion has received an additive
rank of 6 points, the Ural Macroregion 9 points, and
the Far Eastern Macroregion 13 points.
The cumulative (additive) rank of the Arctic
regions by the five economic indicators is 9 points in
Murmansk Oblast and Nenets AO. The difference is
that Nenets AO was ranked by the four indicators
available in the statistical reports. Yamalo-Nenets AO
is ranked higher (7 points) and Chukotka AO lower
(11 points).
The second approach is based on the following
factors determining regional financial sustainability:
solvency of all economic agents;
good regional balance of payments;
low internal and external debt;
deficit-free regional budget.
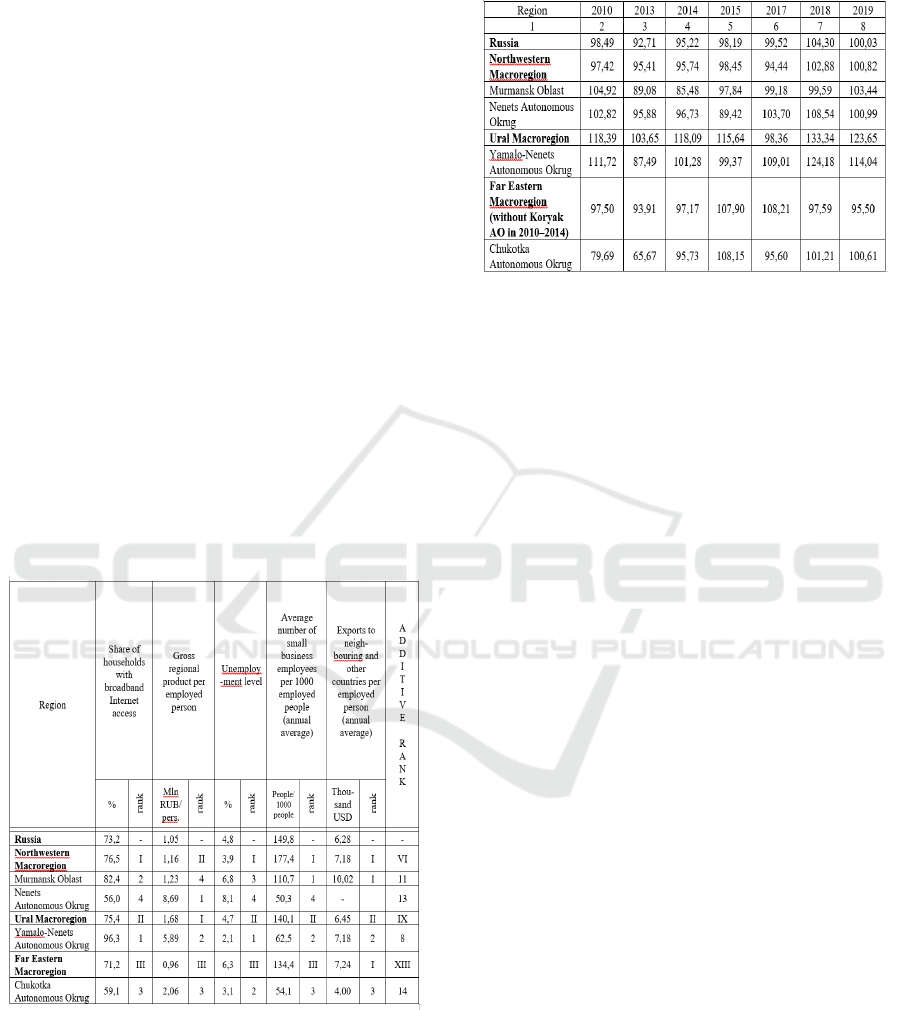
Table 1: Positions of Russian Arctic regions in 2018 by
economic situation.
Table 2 shows a history of macroregional and
regional budget performance in the Arctic land areas
in order to find out whether there is a budget deficit
and how financially sustainable the regions are.
Table 2: Historical budget performance in Arctic regions,
%.
As seen from the data in Table 2, regional budget
performance is defined as the proportion of the
budget income to the spending. In Russia, a federal
budget deficit existed until 2018, varying from the
maximum of 7,28% to the minimum of 0,48% within
the range of 6,8%.
In the Northwestern Macroregion, a budget deficit
also existed for the same period, albeit to a smaller
extent, from 5,56% to 1,55% within the range of
4,01%.
In Ural Macroregion, a budget deficit was
observed only once in 2017. It was 1,64%, and the
variation is therefore 0%.
The budget deficit in the Far Eastern
Macroregion was 6,09% at its highest and 2,41% at
its lowest, with no deficit in 2015 and 2017. The
variation was 3,68%. Thus, the macroregions were
more financially sustainable than Russia as a whole,
given the variation range.
However, if financial sustainability means a
budget deficit or surplus lower than 1%, i.e. applying
the principle of balance, Russia had that balance in
2017 and 2019, the Northwestern Macroregion in
2019, with no such balance observed in the Ural and
Far Eastern Macroregions.
In Murmansk Oblast and Nenets Autonomous
Okrug, both parts of the Northwestern Macroregion,
the highest budget deficit was 14,52% and 10,58%
and the lowest 0,41% and 3,27% within the respective
ranges of 14,11% and 7,31%. Murmansk Oblast had
a balanced budget in 2017 and 2018 and Nenets
Autonomous Okrug in 2019.
Similar to the Ural Macroregion as a whole,
Yamalo-Nenets Autonomous Okrug generally had a
budget surplus. A budget deficit was observed in that
Autonomous Okrug only in 2013 and 2015, its
maximum value being 12,51% and the minimum
value 0,63%. The 2015 budget was therefore
balanced. The figure varied within the range of
11,68%.
WFSDS 2021 - INTERNATIONAL SCIENTIFIC FORUM ON SUSTAINABLE DEVELOPMENT OF SOCIO-ECONOMIC SYSTEMS
346

The budget deficit in Chukotka Autonomous
Okrug was 34,33% at its highest and 4,6% at its
lowest within the range of 29,73%. The budget was
balanced only in 2019.
Consequently, given the variation ranges, the
Urals was the most financially sustainable
macroregion and the Northwest the least financially
sustainable one. Out of the four Arctic regions, the
first place by financial sustainability is held by Nenets
Autonomous Okrug, the second by Yamalo-Nenets
AO, the third by Murmansk Oblast, Chukotka
Autonomous Okrug holding the worst and the least
financially sustainable position.
The third approach involves studying changes in
the gross domestic product as the main indicator of
economic sustainability. In the annual government
statistics reports on Russian regions, it is the gross
regional product (GRP) (Regions of Russia, 2020).
There are, however, two essential conditions.
First, the GRP has to be adjusted for inflation.
However, the indicator shown in Russian statistical
reports is called the fixed-price index of the actual
GRP volume. We will therefore analyse the changes
in this indicator value. Instead of an inflation level
indicator, which is also unavailable, we will use two
similar indicators: consumer price index and
industrial producer price index.
It is believed that the actual price-adjusted
(inflation-adjusted) GRP volume in a sustainable
economy has to be sufficiently stable, without growth
or reduction from year to year. Put differently, this
state is called stagnation, as we have already
described above.
Secondly, additional investment amounts and
sources have to be excluded. To assess whether this
condition is fulfilled, we will use the statistical
indicator call the comparable-price index of capital
investment volumes.
In order to analyse the changes in the indicators
and identify the degree of sustainability in the
macroregions and the regions included therein, we
will use a stage-by-stage methodology.
At the first stage, we will find the maximum and
minimum deviation of the indicator in question from
100%, expressed as a positive value (growth) or a
negative value (reduction).
At the second stage, we will calculate the
variation range based on the identified growth or
reduction values. To do that, we will sum up the
extreme positive and negative values of growth and
reduction.
At the third stage, we will find the variation
interval, using a formula where a double value of the
minimum deviation from 100%, irrespective of its
positive or negative sign, is subtracted from the sum
of deviation expressed as the variation range.
At the fourth stage, we will rank the macroregions
and regions separately, assigning the first rank to the
smallest variation interval and the third rank for the
macroregions and the fourth rank for the regions to
the largest interval.
At the fifth stage, we will sum up the ranks of the
areas to get an additive rank.
At the sixth stage, we will identify the degree of
sustainability for each area relative to the others in
accordance with their additive ranks.
An analysis of the changes in the first indicator –
fixed-price index of the actual GRP volume – from
2010 to 2018 has shown that, in Russia as a whole,
the maximum growth as a deviation from 100% was
4.6% and the minimum was minus 0.6%. The
corresponding variation range was 5,2% and the
variation interval was 4,0% (4,6%+0,6%-0,6×2).
In the macroregions, the largest variation interval
(7,4%) was observed in the Urals, a slightly smaller
one (6,2%) in the Far East, and the smallest (4,2%) in
the Northwest. In the Arctic regions, the negative
leadership by the variation interval belonged to
Chukotka Autonomous Okrug (31,4%). In Nenets
and Yamalo-Nenets Autonomous Okrugs, the values
were 16,7% and 12,9%, respectively. The smallest
interval of 1,1% was in Murmansk Oblast.
By the second indicator – consumer price index –
the variation intervals from 2010 to 2019 varied from
the highest value of 10,6% in the Ural Macroregion
to the lowest value of 9,9% in the Far East. In the
Northwestern Macroregion, the value was 10,1%. In
Russia, it was 10,4%. In the Arctic regions, the
difference in the variation intervals was more
pronounced because it was 13,7% in Nenets AO and
9,0%. In Chukotka AO and Murmansk Oblast, the
variation interval was 9,7% and 10,3%, respectively.
The third indicator is the industrial producer price
index. An analysis of how it changed from 2013 to
2019 has shown that the Russian average variation
interval was 9,4%, with the deviation values in the
areas varying more significantly than those of the
consumer price index did. For instance, in the Ural
Macroregion, the value was the highest, equal to
15,7%. In the Far Eastern and Northwestern
Macroregions, the respective variation intervals were
15,7% and 13,7%, much lower than in the Urals. In
the Arctic regions, the variation intervals were even
larger, from 37,2% in Chukotka AO to 23,9% in
Murmansk Oblast. In Yamalo-Nenets and Nenets
Autonomous Okrugs, those values were 30,0% and
29,4%, respectively.
Finally, the fourth indicator is the comparable-
The Economic Aspect of Sustainability in Russian Arctic Areas
347

price index of capital investment volumes. An
analysis of positive and negative deviations from
2010 to 2019 has shown their most significant
differences. In Russia as a whole, the difference
between the maximum investment growth in 2010
(6,3%) and the minimum growth in 2015 (-10,1%)
accounted for a respective variation range of 16,4%.
The variation interval adjusted for the minimum value
was 16,0%. In the macroregions, the variation
intervals were as follows: 25,7% in the Northwest,
25,2% in the Far East, and 16,6% in the Urals. In the
Arctic regions, the negative leadership belonged to
Chukotka AO, where the difference between the
positive and negative extremes (variation range) was
122,3%, the variation interval being 122,1%. In
Murmansk Oblast, the variation range was more than
two times smaller, equal to 53,8%. The variation
interval was 51,0%. In Nenets and Yamalo-Nenets
Autonomous Okrugs, the variation range was below
50%, equal to 45,2% and 41,6%, respectively, the
variation intervals being 40,8% and 40,2%.
In accordance with the ranking rule, we will
assign ranks to the macroregions and regions, the first
rank being for the smallest variation interval. The
additive rank is a sum of the ranks for the four
indicators in question. As a result, the Northwestern
Macroregion has a rank of 6 points (1+2+1+2)
relative to the other two macroregions. The additive
ranks of the Far Eastern and Ural Macroregions had
more points, equal to 7 (2+1+2+2) and 10 (3+3+3+1),
respectively.
4 CONCLUSIONS
We can therefore conclude that the degree of
economic sustainability in the Northwestern Region
is higher than in the Urals. The Far Eastern Region is
insignificantly behind the Northwest as far as this
indicator is concerned. The highest degree of
economic sustainability in the four Arctic regions has
been identified in Murmansk Oblast (1+3+1+2) and
Yamalo-Nenets AO (2+1+3+1). These two areas
have received identical additive ranks of 7 points. A
lower degree of sustainability is found in Nenets AO
with its additive rank of 10 (3+4+2+1). The lowest
degree of economic sustainability has been identified
in Chukotka Autonomous Okrug. Its additive rank is
13 (4+2+4+3).
The study can be continued further to identify the
positions of the Russian macroregions and Arctic
regions in all national projects and their respective
incorporated federal projects.
REFERENCES
Babkin, N., Bespalova, S., Senetskaya, L., and Skotarenko,
O. (2019). Tools for digitalization of economic
processes for supporting management decision-making
in the Arctic region. IOP Conference Series: Earth and
Environmental Science, 302(1):6 012147
Bykovskaia, E., Maiurova, A., Kustikova, M., Timofeeva,
I., and Tyurikova, E. (2021) Assessment of the
environmental risks in the development of fossil fuels
deposits in the Arctic zone of the Russian Federation.
IOP Conference Series: Earth and Environmental
Science, 723(5): 0520332021
Byulleten o tekushchikh tendentsiyakh rossiyskoy
ekonomiki [Bulletin of current trends in Russian
economy], Retrieved, 2020, https://e-
cis.info/upload/iblock/520/520a5eee087274f9007f341
e5865b0b3.pdf
Concept of Sustainable Development in Countries United
Nation Conference on Environment and Development
(1993), New York, 1-3.
Kozin, M., Plotnikov, V., and Skotarenko, O. (2019).
Assessment of challenges, threats, and prospects in
development of cities and towns in the Arctic zone, IOP
Conference Series: Earth and Environmental Science,
302(1): 012103
National Projects: expectations, results, and prospects,
Ekspert RA Rating Agency,
https://raexpert.ru/researches/national_project_2020/
On Land Territories in the Arctic Zone of the Russian
Federation Decree of the President of the Russian
Federation of 2 May 2016 No. 296 (Collected Laws of
the RF 05.05.2014 No 18 Part I Art. 2136)
On national development goals in the Russian Federation
until 2030: Decree of the President of the Russian
Federation of 21 June 2020 No 474,
https://www.garant.ru/products/ipo/prime/doc/743042
10/
Regions of Russia. Socioeconomic indicators – 2020
Official website of the Russian Federal State Statistics
Service, https://rosstat.gov.ru
Towards a Global Pact for the Environment of 10 May
2018: Resolution A / 72 / L.51,
https://undocs.org/en/A/RES/72/277
WFSDS 2021 - INTERNATIONAL SCIENTIFIC FORUM ON SUSTAINABLE DEVELOPMENT OF SOCIO-ECONOMIC SYSTEMS
348
