
Sustainable Regional Development based on the Inflation Forecasts:
The Adaptive Models Application
I. A. Astrakhantseva
a
, M. D. Ermolaev
b
and A. S. Kutuzova
c
Ivanovo State University of Chemistry and Technology, Sheremetev Avenue, 7, Ivanovo, Russia
Keywords: Sustainable Regional Development, Consumer Price Index, Inflation, Forecasting, Mathematical Models,
Neural Networks.
Abstract: The article proves the dependence of the regions sustainable development on the inflationary processes
dynamics. The practice of using various mathematical models to predict the consumer price index is
considered. The experience in the regional inflation forecasting on the basis of a recurrent neural network is
presented. The mechanism of forecasting the inflation level on the basis of adaptive models is shown. The
algorithm was tested on the basis of indicators for the Ivanovo region. The source of the primary data was the
monthly data of the chain consumer price indices (CPI) in the Ivanovo region in 2009-2020. The predictive
model was validated on the basis of the consumer price index data for the first three months of 2021.
Independently, the issue of assessing the federal-level inflation dynamics impact on the regional-level
inflation dynamics is considered.
1 INTRODUCTION
The regions sustainable development and the
maximum uniformity achievement of such
development is a necessary condition for the entire
state progressive development. The inflation level has
always been one of the key macroeconomic indicators
that reflect the current state of economy. The inflation
dynamics affects many important areas of public life,
i.e. the investment processes flow, the production
growth, the population standard of living and the level
of social tension, which ultimately contributes to or,
on the contrary, restrains the economy progressive
development. Therefore, the inflation forecasting (as
accurate as possible) is an urgent task for various
political, financial and social institutions.
The model and methodological apparatus for
inflation forecasting is diverse. The typology and
comparative analysis of the predictive qualities of
such methods are presented in sufficient detail, for
example, in the works of (Faust, 2013; Balackij and
YUrevich, 2018; Duncan and Martínez-García, 2018;
Gorshkova and Sinel'nikova, 2016)
a
https://orcid.org/0000-0003-2841-8639
b
https://orcid.org/0000-0002-9502-3621
c
https://orcid.org/0000-0002-7511-1667
Among the various approaches to forecasting the
price rate dynamics, two areas stand out significantly.
The first direction is based on the assessments of
experts in the economic functioning field and on the
ordinary economic actors opinions survey (for
example, the monthly survey of the University of
Michigan (Lahiri and Zhao, 2016)).
The inflation forecasting within the framework of
the second direction is carried out on the econometric
methods and models basis. At the same time, for
short-term forecasting, as a rule, various models of
scalar time series (single-factor models) are used.
These include:
Random walk models (RW models). A random
walk determines the movement of a random
variable (in our case, the inflation rate), the
direction of which changes randomly at certain
points in time. The change in the inflation rate
in this model does not depend on all previous
values and does not affect all subsequent
changes, while obeying an identical probability
distribution with the same parameters, i.e. the
average value and the mean square deviation.
Astrakhantseva, I., Ermolaev, M. and Kutuzova, A.
Sustainable Regional Development based on the Inflation Forecasts: The Adaptive Models Application.
DOI: 10.5220/0010667800003223
In Proceedings of the 1st International Scientific Forum on Sustainable Development of Socio-economic Systems (WFSDS 2021), pages 313-319
ISBN: 978-989-758-597-5
Copyright
c
2022 by SCITEPRESS – Science and Technology Publications, Lda. All rights reserved
313

Models of direct and recursive autoregression.
The prediction in autoregressive models is
based on the analysis of the variable previous
values. Within the framework of such a
forecast, it is assumed that the inflation rate is
in a linear relationship with this indicator in the
previous time steps. Statistical indicators are
used to calculate the correlation between the
output inflation indicator and its values in
previous time steps with different lags.
ARIMA models are created in the
autoregressive models development process.
They allow to bring the series to a stationary
one and implement forecasting by
extrapolation, to identify the trend, seasonality
in the change in the inflation indicator. Based
on these models, for example, monthly
forecasts of the main Russian macroeconomic
indicators are made, published by the staff of
the E.T. Gaidar Institute for Economic Policy.
For medium-term forecasting, multi-factor
models are usually applied. They are expressed
as a system of simultaneous equations. The
greatest number of different techniques and
technical tools for constructing inflation
forecasts have been accumulated within the
framework of these models.
Among them, first of all, the following models are
distinguished:
Models based on the Phillips curve. Thise
models estimate the inverse relationship
between the inflation rate and the
unemployment rate. Currently, the modern
modification of these models is used in the
form of a "triangular model", where the
inflation rate is dependent on its past values, the
unemployment rate and cost shocks.
Vector autoregression models (VAR models)
study the macroeconomic variable reactions (in
our case, the inflation rate) to its previous
values and other variables that are responsible,
among other things, for regime changes in
economic policy or individual shocks in the
economy. These models are represented by the
independent regression equations systems.
Dynamic models of general equilibrium. The
DSGE models are based on modeling the
micro-level economic entities behavior. These
models illustrate the dependence of the
inflation rate and many other variables: total
output, the costs rate, the imports volume, the
interest rate, the wages rate, consumption,
savings and investments, and the exchange
rate.
Neural networks. We shall emphasise that for
the study of such a multi-factorial and complex
phenomenon as inflation, this tool can show
high efficiency and accuracy of the forecast.
The following classes of neural networks are
used for time series analysis: multilayer
perceptron, deep neural networks, recurrent
neural networks, and convolutional neural
networks.
We assume the use of a recurrent neural network
based on LSTM (Long Short-Term Memory) blocks
with a dual attention mechanism (in the encoder and
decoder) as the most preferable method. This is a
special type of recurrent neural network architecture
capable of learning long-term dependencies, which
meets the task of the inflation rate forecasting
(Astrakhantseva, Kutuzova and Astrakhantsev,
2020).
At the same time, the application of this set of
models in practice tends to use a combination of
private forecasts made by different methods and
instrumental approaches, including the expert ones
(Dou., Lo, Muleu and Uhlig, 2017; Andreev, 2016).
For example, the Central Bank of the Russian
Federation uses the DSGE model of a "small" open
economy with the following types of agents:
households, firms, the external sector and the central
bank. The inflation factors are the interest rates, the
exchange rate, the consumption and savings level,
wages, the volume of imports, the costs rate, etc. The
inflation forecast is constructed by combining the
forecasts of different models (Balackij and YUrevich,
2018).
Thus, it is noted that to date, more than 20 types
of models for forecasting inflation are used. However,
all of them are oriented and used within the national
economies framework. The regional specifics of the
inflation dynamics within individual countries are not
reflected in these models. There are no serious
developments related to the modeling of inflationary
processes at the regional level. Meanwhile, in the
context of regional heterogeneity, significant
fluctuations within the national picture of inflation are
quite possible. At the same time, in order to apply
sound monetary policy measures, the regulator needs
to assess the inflationary processes dynamics in
regions, since the country sustainable development
requires adequate sustainable development of all its
parts.
WFSDS 2021 - INTERNATIONAL SCIENTIFIC FORUM ON SUSTAINABLE DEVELOPMENT OF SOCIO-ECONOMIC SYSTEMS
314
2 MATERIALS AND METHODS
We suggest that it is important to consider the specific
factors on the meso-level. Traditionally, more
attention is paid to the inflation monetary factors,
which are directly influenced by regulators (interest
rates, exchange rate, lending volumes, consumption
volumes, saving volumes). These factors can be
accurately quantified and taken into account in
mathematical models and machine learning
algorithms. However, non-monetary factors also have
a significant impact on the consumer price index.
For example, the economic entities and the
population inflationary expectations can become a
significant factor in the inflationary processes
development. This factor is traditionally very
significant for Russia. Additionally, non-monetary
factors can be the following: the rise in the imports
cost, the economy monopolization and, accordingly,
the monopolistically set prices "inflating", the shadow
sector of the economy presence, the peculiarities in the
movement of goods between regions and the system
of movement of goods within networks. If, for
example, there are no large warehouses in the region,
this will lead to an increase in the prices of goods
imported into the region for the final consumer. Thus,
the Ivanovo Region under study is an outsider region
in terms of price attractiveness for short-term loan
banks, along with the Kursk and Belgorod regions.
The cost of medium-term loans for individuals here is
often lower than the market average (Ahmatov,
Astrahanceva, Kutuzov, Votchel and Vikulina, 2020).
This can provoke an increased demand for credit
resources, increasing the money supply in circulation
and stimulating the inflationary processes.
Previously, the authors used a recurrent neural
network to analyze a number of inflation factors at the
regional level, such as: the amount of the population
income, the average monthly wages, the population
monetary expenditures, the retail turnover, the
volume of paid services to the population, the volume
of individuals deposits, the amount of citizens debt on
loans, the dollar-ruble exchange rate, etc. Having
identified potential factors of inflation, the authors
conducted a correlation and regression analysis and
marked the dollar-ruble exchange rate and the
increase in citizens debt, with the exception of
currency revaluation, as parameters with a
characteristic dependence. Next, all the identified
potential inflation factors were taken for forecasting
using a neural network.
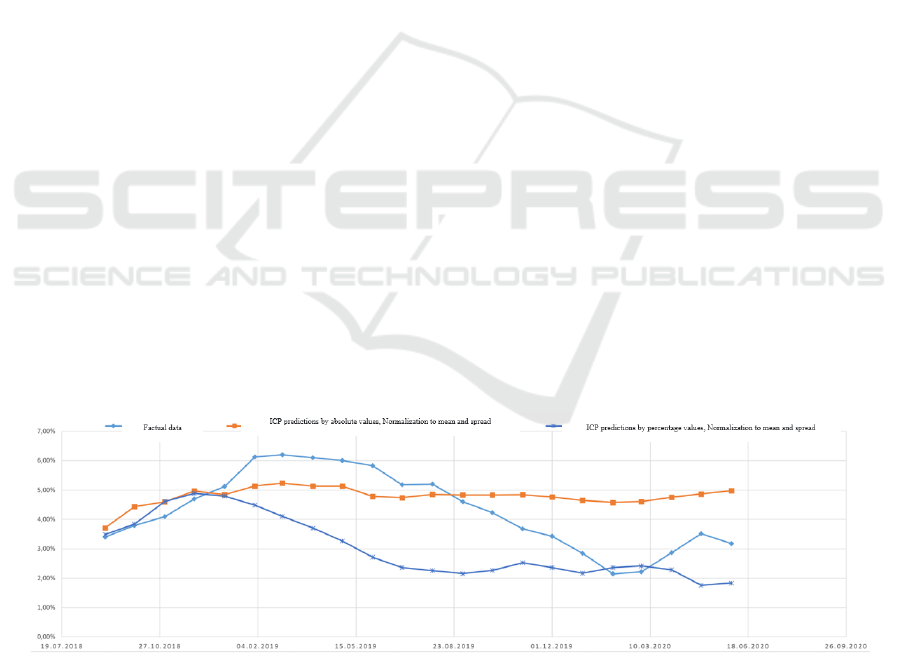
The results of the forecast are presented in Figure
1. These results indicate that the direction of changes
in the actual indicator and the planned indicator
coincides almost over the entire time horizon,
however, the algorithm could not accurately predict
the fluctuations amplitude. We shall note the
divergence between the fact and the forecast in the
first half of 2019 and in the spring of 2020. The
increase in inflation in January-February 2019 and its
increased values compared to the forecast in the first
half of 2019 is explained by the increase in utility
tariffs and the rise in the price of fruit and vegetable
products. In addition, the increase in prices at the
beginning of 2019 could be due to the factor of high
inflation expectations already mentioned above,
which, according to the Bank of Russia, were formed
under the influence of the dynamics of prices for
gasoline, food and fluctuations in the ruble exchange
rate. We shall note that the model could not
accurately account for these factors (Figure 1).
Figure 1: The comparison of predicted data with actual CPI figures.
However, while considering the importance of
specific meso-level factors, it seems fair that the
processes occurring in lower-level systems are
formed and largely reflect the dynamics of processes
occurring in higher-level systems. Obviously, the
same applies to inflation. Therefore, at the first stage
of the study, it is expected to assess the degree of CPI
dynamics correlation at the federal and regional levels
over a sufficiently long time interval.
Sustainable Regional Development based on the Inflation Forecasts: The Adaptive Models Application
315

The applied part of the study concerns the actual
forecasting of the inflation rate in a particular region
(in the Ivanovo region). The initial statistical basis for
the predictive models construction was the monthly
data of the Ivanovo branch of the Central Bank of the
Russian Federation on indicators reflecting the
inflation rate in the region (CPI). The period relative
to which the models were built, 2009-2020, the period
relative to which the quality of the models was
checked, the first three months of 2021.
In the first part of the study, we compared the
inflation rates dynamics (December to December last
year) in the Central Federal District regions with the
inflation rate dynamics in Russia as a whole for the
period 2000-2020. The comparison was carried out
by the methods of correlation and regression analysis.
As follows, the linear regression models of the
dependence of the regional level of inflation on the
federal level were constructed. The quality of models
was traditionally evaluated by the value of the
determination coefficient. The comparison of the
inflation rates dynamics in the Russian Federation
and in the Ivanovo Region is shown in Figure 2.
Figure 2: Comparison chart of inflation rates in the Russian
Federation and in the Ivanovo region by year in the period
2000-2020.
All constructed models are statistically significant
at a significance level of 0.01. The values of the
determination coefficient for all regions are within the
range of 0.874<R2<0.983, which indicates the high
quality of the constructed models.
For the Ivanovo region, R2=0.891. It can be
interpreted as follows: the price variation in this region
is on average 89% due to the impact of inflationary
processes at the macro level. It should be noted that in
terms of this indicator, the Ivanovo Region occupies
the penultimate place among the Central Federal
District regions. Taking into account the internal
annual dynamics, we can conclude that there are
certain features of the inflationary processes in this
region.
In the context of comparing the inflationary
processes at the meso-and macro-levels, another
important indicator is a matter of concern, in
particular, the total price growth in the region over the
entire period under review. In contrast to the
determination coefficient, which reflects the degree of
price dynamics synchronicity at the federal and
regional levels, this indicator represents the main
inflationary outcome in the region or country under
consideration. At the same time, it is obviously
equivalent to consider the actual values of consumer
price growth in the regions or the ratio of these values
at the regional and federal levels. Figure 3 shows the
growth of prices in the Central Federal District
regions, as well as in Russia as a whole for the period
2000-2020.
In general, in most regions of the Central Federal
District, the growth rate exceeds the national level.
The leader is the Yaroslavl region (the growth is
771%), the outsider is the Oryol region (the growth is
639%). The growth in Russia is 655%.
Thus, we can talk about a certain differentiation of
inflationary processes in the regions. At the same time,
it is possible to assume the existence of some
typologically similar realizations of price dynamics
for certain groups of regions. Therefore, at the next
stage of the study, we conducted a cluster analysis of
the Central Federal District regions based on the two
above-mentioned indicators, i.e. on the determination
coefficient of the regional inflation rate dependence on
the federal level, as well as the amount of consumer
price growth in the regions for the period 2000-2020.
After the necessary data standardization
procedure, the clustering itself was carried out using
the k-means method. The choice of the optimal
number of clusters n was carried out on the results
variance analysis basis, in particular, for the first n, for
which the p-values for both variables were less than
the accepted significance rate α=0.01. This condition
was achieved at n=3. Thus, the Central Federal
District regions were divided into three groups with
typologically similar characteristics of price
dynamics. The most interesting cluster is the one
containing four regions – Ivanovo, Kursk, Ryazan,
and Tula. The distinctive features of the cluster are,
first, relatively low determination coefficient values
and, on the contrary, a significant increase in
consumer prices in the period under review. That is,
the inflation rate dynamics in these regions is the most
individualized and unstable. We shall also note that
the Ivanovo Region is the closest to the center of this
cluster.
y = 0,9383t + 7,4927
R² = 0,8913
102
104
106
108
110
112
114
116
118
120
122
100 105 110 115 120 125
WFSDS 2021 - INTERNATIONAL SCIENTIFIC FORUM ON SUSTAINABLE DEVELOPMENT OF SOCIO-ECONOMIC SYSTEMS
316
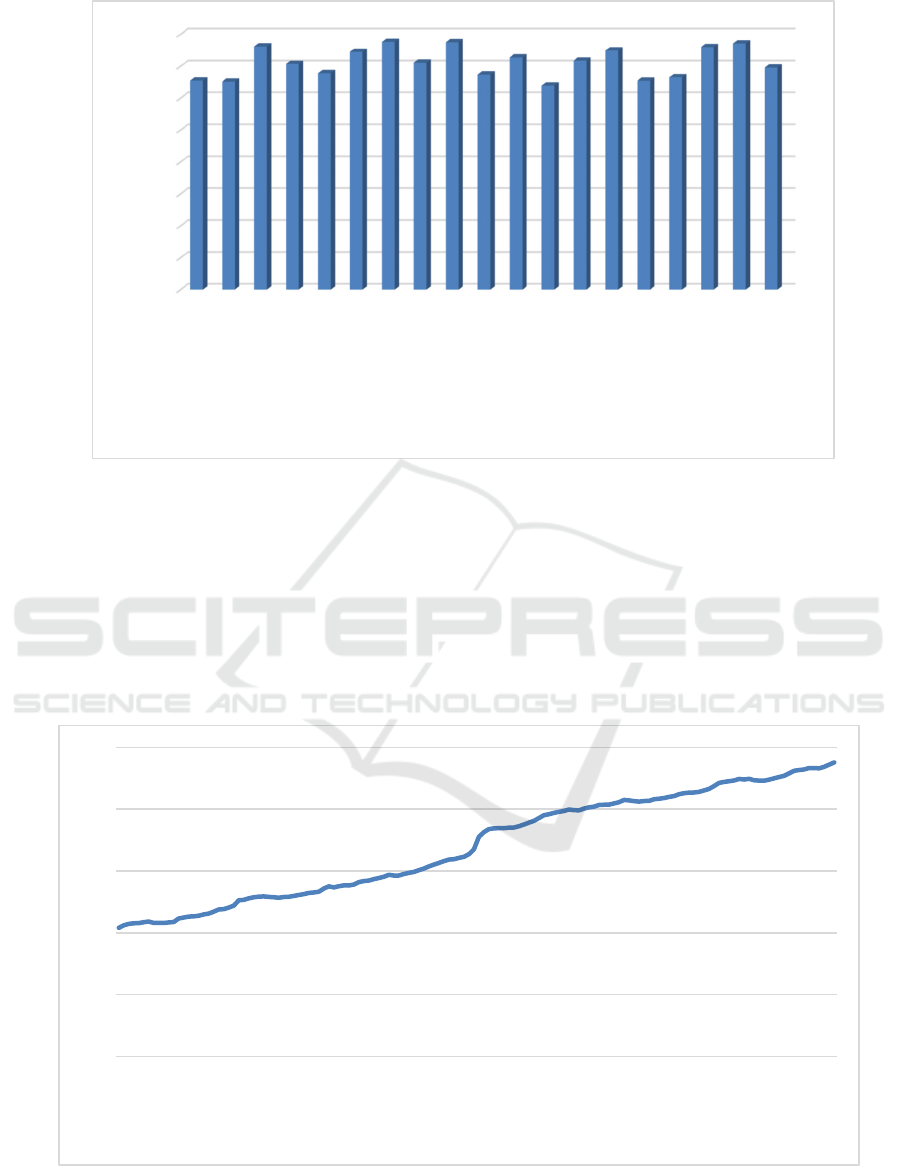
Figure 3: The consumer price growth in the Central Federal District and the Russian Federation as a whole for the period
2000-2020 (in %)
3 RESEARCH RESULTS
The forecast of the inflation rate in the Ivanovo region
was carried out on the basis of adaptive models (or
exponential smoothing models). Methodically, this
can be represented as follows.
At first, the initial series of chain consumer price
indices is converted into a series of basic indices (the
base is December 2008).
The resulting series represents the generalized
price level dynamics in the Ivanovo region relative to
the prices of December 2008 (Figure 4).
Figure 4: The dynamics of basic consumer price indices in the Ivanovo region in the period 2009-2020 (the basis is 100% –
December 2008).
0,0
100,0
200,0
300,0
400,0
500,0
600,0
700,0
800,0
RussianFederation
Central
federaldistrict
Belgorodregion
Bryanskregion
Vladimirregion
Voronezhregion
Ivanovoregion
Kalugaregion
Kostromaregion
Kurskregion
Lipetskregion
Moscowregion
OryolRegion
RyazanOblast
Smolenskregion
TambovRegion
Tverregion
Tularegion
0
50
100
150
200
250
2009‐01‐01
2009‐07‐01
2010‐01‐01
2010‐07‐01
2011‐01‐01
2011‐07‐01
2012‐01‐01
2012‐07‐01
2013‐01‐01
2013‐07‐01
2014‐01‐01
2014‐07‐01
2015‐01‐01
2015‐07‐01
2016‐01‐01
2016‐07‐01
2017‐01‐01
2017‐07‐01
2018‐01‐01
2018‐07‐01
2019‐01‐01
2019‐07‐01
2020‐01‐01
2020‐07‐01
Sustainable Regional Development based on the Inflation Forecasts: The Adaptive Models Application
317
It is easy to see that the dynamics are quite regular
and generally close to linear. Notable deviations from
the general trend are visible at the end of 2014 (to a
greater extent) and at the end of 2010 (to a lesser
extent). In addition, at the turn of 2014-2015, there is
a certain slowdown in the inflation rate.
The visual analysis of the dynamics allows us to
conclude that it is advisable to use the adaptive
forecasting methods that take into account the fact
that the data obtained chronologically last. These data
are considered the most important in forecasting,
since they give an idea of the direction in which the
development of the current trend will go.
Adaptive models were built using the
STATISTICA 10 application software package. At
the same time, we proceeded from two premises.
Firstly, we proceeded from the existing but changing
trend of the dynamics under consideration and,
secondly, from the presence of an inflation seasonal
factor, although visually it is difficult to grasp, but
theoretically it occurs quite reasonable.
The STATISTICA package allows to build
several types of adaptive models, differentiated on the
basis of the microtrends types (linear, exponential,
damped), as well as the seasonal dynamics nature
(additive or multiplicative). The selection of adaptive
parameters for each model type was carried out
according to the criterion of minimizing the mean
absolute percentage error (MAPE).
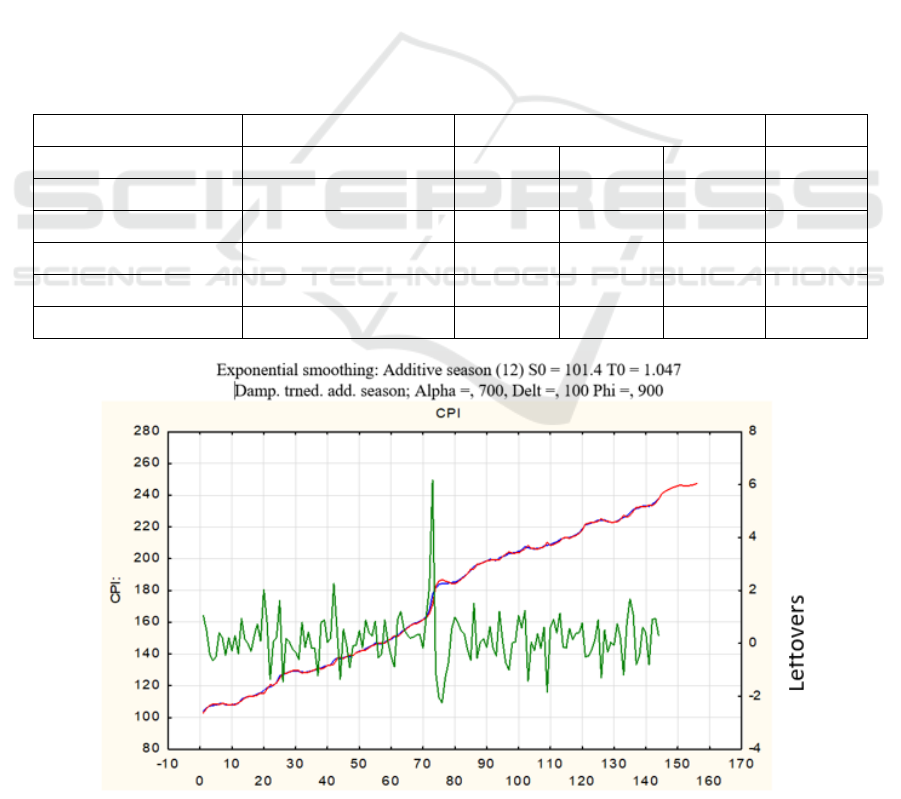
Table 1 shows the results of constructing the
optimal adaptive models of each type. In general, the
MARE index minimum value corresponds to a model
with the damped microtrends and additive
seasonality. The optimal adaptation parameters are
0.7, 0.1, and 0.9 (VM model (0.7; 0.1; 0.9)).
The inflation post-forecast for 2021 was carried
out precisely on the basis of this model.
Figure 5 shows the results of forecasting based on
this model.
Table 2 shows the inflation rate forecast values in
the Ivanovo region in 2021.
Table 1: The results of the inflation dynamics adaptive models constructing in the period 2009-2020.
The seasonality nature
The microtrends type Parameters MAPE
additive linear 0.9 0.1 0.6
0.406
additive exponential 0.9 0.1 0.7
0.416
additive damped 0.7 0.1 0.9
0.400
multiplicative linear 0.9 0.1 0.4
0.414
multiplicative exponential 0.9 0.1 0.3
0.415
multiplicative damped 0.7 0.1 0.9
0.416
Figure 5: The demonstration of the results of forecasting the basic inflation indices in the Ivanovo region
WFSDS 2021 - INTERNATIONAL SCIENTIFIC FORUM ON SUSTAINABLE DEVELOPMENT OF SOCIO-ECONOMIC SYSTEMS
318

Table 2: The inflation rate forecast in the Ivanovo region in 2021 (in the YoY - Year over Year format).
Month Forecast Fact Month Forecast Fact
January 6.61 6.33 July 5.65 -
February 6.78 6.97 August 5.38 -
March 6.36 6.64 September 5.55 -
April 5.82 - October 5.10 -
May 5.89 - November 4.50 -
June 5.94 - December 4.00 -
Within this format, the average monthly forecast
error was 4.4% in January, 2.7% in February, and
4.2% in March. If we consider the inflation growth as
a whole for three months, the error will be less than
1%, which indicates the adequacy of the chosen
forecasting methods.
4 CONCLUSION
Thus, the study revealed differences in the course of
inflationary processes in regions. Based on the cluster
analysis, three classes of regions with typologically
similar dynamics of consumer prices were identified.
As a hypothesis, we can assume that each of these
typologies determines the choice of a particular
model for predicting the regional inflation rate.
For the Ivanovo region (the region of the most
"unstable" cluster) an adaptive model for forecasting
monthly data on the inflation rate was built. The
forecast results in the post-forecast period (the first
three months of 2021) showed a fairly high accuracy.
This study complements the domestic and foreign
methods of studying the inflation factors and its
forecasting, taking into account regional specifics.
The identification of these specifics in the inflationary
processes formation will allow us to adjust the
regulator monetary policy and create conditions for
ensuring the progressive development of the regions
within the country.
REFERENCES
Faust J. (2013). Wright J.H. Forecasting inflation.
Handbook of economic forecasting. Vol. 2, pages 2–56.
Balackij E.V., YUrevich M.A. (2018). Prognozirovanie
inflyacii: praktika ispol'zovaniya sinteticheskih
procedur. Mir novoj ekonomiki, 4 pages 20–31.
Duncan R., Martínez-García E. (2018). New Perspectives
on Forecasting Inflation in Emerging Market
Economies: An Empirical Assessment. Working paper.
https://www.dallasfed.org/~/media/documents/institute
/wpapers/2018/0338.pdf.
Gorshkova T., Sinel'nikova E. (2016). Sravnitel'nyj analiz
prognoznyh svojstv modelej rossijskoj inflyacii.
Nauchnyj vestnik IEP im. Gajdara, 6, pages 34–41.
Lahiri K., Zhao Y.(2016). Determinants of consumer
sentiment over business cycles: Evidence from the US
surveys of consumers. Journal of Business Cycle
Research, Vol. 12, 2, pages 187–215
Astrakhantseva I., Kutuzova A., Astrakhantsev R. (2020).
Artificial Neural Networks in Inflation Forecasting at
the meso-level. SHS Web of Conferences. 93. 3rd
International Scientific Conference on New
Industrialization and Digitalization, 2020. 02005. DOI:
10.1051/shsconf/20219302005 https://www.shs-
conferences.org/articles/shsconf/abs/2021/04/shsconf_
nid2020_02005/shsconf_nid2020_02005.html
Dou W., Lo, A., Muley A., Uhlig H. (2017).
Macroeconomic models for monetary policy: a critical
review from a finance perspective SSRN working
paper. https://ssrn.com/abstract=2899842.
Andreev A. (2016). Prognozirovanie inflyacii metodom
kombinirovaniya prognozov v Banke Rossii. Bank
Rossii. Seriya dokladov ob ekonomicheskih
issledovaniyah, 14, pages 2–11.
Ahmatov K, Astrahanceva I., Kutuzova A., Votchel L.,
Vikulina V., (2020). Harmonization of banking
business models with the needs of the economy by
encouraging the exogenous social responsibility.
Journal Quality-Access to Success” Journal, Vol.
21,174, pages 81-87.
Inflyacionnye ozhidaniya (2020).
https://cbr.ru/statistics/ddkp/inflationary_expectations/
Federal'naya sluzhba gosudarstvennoj statistiki. (2020).
https://rosstat.gov.ru/priceVuiT, 4(32).:
https://cyberleninka.ru/article/n/ekologicheskaya-
sostavlyayuschaya-pri-razrabotke-strategii-
ustoychivogo-razvitiya-regionalnogo-apk (Accepted:
13.04.2021).
Dudin M.N., Kalendzhyan S.O., Lyasnikov N.V. 2017.
Green economy: a practical vector for Russia's
economic development. Ekonomicheskaya politika,
12(2), pages 86–99.
Mirzekhanova Z.G. 2018. Ecological aspects of the modern
development of remote regions in the format of the
"green economy" model. Regional'naya ekonomika:
teoriya i praktika, 6, pages 1082-1096.
Sustainable Regional Development based on the Inflation Forecasts: The Adaptive Models Application
319
