Improving the State Policy in the Field of Intellectual Property
Management in the Context of Sustainable Economic Development
Lyudmila N. Perepechko
1a
and Dmitry M. Zukerblat
2b
1
Kutateladze Insitute of Thermophysics of SB RAS, Novosibirsk, Russia
2
Russian National Public Library for Science and Technology, Novosibirsk, Russia
Keywords: Sustainable Development, Management, Public Policy, Intellectual Property, Patent Maintenance Index,
Scientific and Educational Complex.
Abstract: The article considers the problem the state research institutes and universities intellectual property
management effectiveness. The features of the structure and intellectual property protection dynamics in
research institutes of the Russian Academy of Sciences and in Russia as a whole are determined. Intellectual
property in Russia is characterized by an expanded list of indicators, in contrast to those available in the
literature: the industrial property objects protection, the patent holders structure, technology areas, the
protection areas, and other characteristics. The authors compare the indicators of the innovative level of
science and industry development in Russia and the United States. A simple definition of calculating the
patent maintenance index is proposed. The diagnostics of the quality of patent portfolios in the institutes of
the Novosibirsk Scientific Center was performed. The diagnostics was made on the basis of the results of the
natural science profile institutes survey. As a result of the study, a low degree of intellectual property
protection was established, which is the reason for the decline in its demand in the market. The
recommendations to modify the intellectual property management system in state research institutions were
developed, i.e. to move from quantitative volume indicators (the number of applications, patents, license
agreements) to indicators that reflect the patents quality (the maintenance and duration of patents protection,
the protection areas, maintenance in priority areas of technology, etc.). The recommendations for the
development of a State strategy for the intellectual property management in order to improve the intellectual
activity effectiveness in the context of sustainable economic development are presented.
1 INTRODUCTION
In the last half century, the key factor in the
development of economic systems is innovation,
which has determined the qualitative changes in the
interaction of science, business and State. The
modern era of the knowledge economy development
in Russia has its own characteristics, i.e. our country
has a high scientific potential in the field of basic
research and low efficiency of its implementation in
the economy, which is confirmed, in particular, by its
low ratings in the global innovation indices system.
The intellectual property management, its transfer
and use accompanies all innovation commercializa-
tion processes, which should be an integral part of
a
https://orcid.org/0000-0002-0613-2907
b
https://orcid.org/0000-0001-7298-9055
State and regional innovation development strategies.
Meanwhile, governmental and regional documents
lack a well-founded and mutually agreed system of
targets in the field of intellectual property (IP). At the
present stage, characterized by the structural
slowdown of the economy and the deterioration of the
macroeconomic situation, the IP management process
improvement is a necessary condition for the economy
sustainable development, an urgent and promising
management task.
As one of the key determinants of sustainable
development, economic indicators should be
emphasised, the functional components of which are
the reporting indicators of State research institutes
and universities, which contain only quantitative data
on intellectual property and its transfer to the industry
278
Perepechko, L. and Zukerblat, D.
Improving the State Policy in the Field of Intellectual Property Management in the Context of Sustainable Economic Development.
DOI: 10.5220/0010667300003223
In Proceedings of the 1st International Scientific Forum on Sustainable Development of Socio-economic Systems (WFSDS 2021), pages 278-286
ISBN: 978-989-758-597-5
Copyright
c
2022 by SCITEPRESS – Science and Technology Publications, Lda. All rights reserved
(according to Rospatent, State research institutes and
universities are increasing their patent portfolios).
There is a question about the quality of patents, the
solution of which will determine the origins of this
problem and will help to form one of the indicators of
the research institutes and universities intellectual
property management effectiveness. In the
intellectual activity management mechanism, public
policy can be considered as a controlling influence
that contributes to sustainable development, which
ensures the achievement of strategic goals defined by
State programs and national projects (Nekhoroshkov
and Aroshidze, 2016).
2 RESEARCH RESULTS
According to the Higher School of Economics (HSE)
"Science Indicators 2019" in 2017, 2.5 thousand
organizations, out of 3.85 thousand organizations that
performed R&D, belonged to the Federal State
property, where 476 organizations are the research
institutes that are subordinate to the Ministry of
Education and Science (Website of the Ministry of
Education and Science). The intellectual property of
the Russian Academy of Sciences research
institutions subordinated to the Ministry of Education
and Science (Research Institute of the Russian
Academy of Sciences), consists of inventions, utility
models, computer programs, databases, know-how,
and, to a lesser extent, industrial designs and
trademarks. The share of inventions, computer
programs and databases belonging to the Research
Institute of the Russian Academy of Sciences, out of
the total number of IP protected by Rospatent, is
growing over time (Tables 1, 2).
Table 1: Intellectual property of the Research Institutes of
the RASs. Inventions, pcs. (of them valid as at 01/04/2018)
according to Rospatent.
2000 2005 2010 2015 2019
Issued for a year
of patents for
inventions
534 (19) 558
(63)
1,084
(444)
1,070
(719)
1,056
Share of all
Russian patents
issued during
the year, %
2.2 2.1 3.5 3.0 3.6
Total ammount
of patents for
inventions
4,461
(26)
7,243
(259)
11,352
(1,463)
16,314
(4,244)
20,752
The share
among all
Russian patents
for inventions,
%
1.83 (2.0) 2.04
(1.6)
2.3 (2.1) 2.5
(2.6)
2.5
Table 2: Intellectual property of the Research Institutes of
the RAS. Computer programs and databases according to
Rospatent data.
2,013 2015 2017
Registered for the year by
the Research Institute of
the RASs, computer
p
rograms
337 487 668
Total registered computer
programs for the year in
Rospatent
9,757 13,410 15,021
Share of Research
Institutes of the RASs, % 3.45 3.63 4.45
Registered for the year by
the Research Institute of
the RASs, DB
86 88 139
Total DB ammount
registered for the year in
Ros
p
atent
1,394 1,829 1,531
Share of Research
Institutes of the RASs, %
6.2 4.8 9.1
Table 3: Number of employees (thousand people)
according to Rosstat.
Yea
r
2000 2010 2015 2017
Number of
research staff,
total over country
426 369 379 360
Of them in the
institutions of the
RASs
62 55.2 52.9
(2012)
45
Despite the reduction in the number of personnel
from 2000 to 2017 by one and a half times (Table 3),
changes in funding, legal status, the scientific
institutions of the RASs show a slight increase in the
number of applications submitted for inventions and
utility models, databases and computer programs.
Meanwhile, the growth of intellectual property
objects transmitted to industrial production is not
observed.
Despite the large share of universities and
research institutes among patent holders, their
participation as sellers or buyers in the IP market is
more modest than the share of industrial enterprises.
Table 4 shows the dynamics of changes in the activity
of participants in registered contracts, depending on
the category of economic entities.
Improving the State Policy in the Field of Intellectual Property Management in the Context of Sustainable Economic Development
279
Table 4: Activity of participants in registered contracts for
the transmission of exclusive rights to inventions, utility
models, and industrial designs. The share of economic
entities categories from the total number of agreements, in
percentage (Site of Rospatent).
Category 201
0
2012 2014 201
6
201
0
2012 2014 201
6
Transmitting party Receiving part
y
Physical
entities
34.5 31.6 25.4
6
26.1 9.7 9.09 8.28 7.5
State-owned
Enterprises,
Research
Institutes,
Design
Bureaus,
Universities
13.8 19.9
3
10.6
7
13.2 7 6.39 3.12 5.9
Non-
governmenta
l
Organization
s, including:
51.7 48.4
7
63.8
7
60.7 83.3 84.5
2
88.6
0
86.6
Foreign
companies
7.6 6.59 11.9
5
15.4 7.1 5.3 10.9 13.9
License agreements are made at the stage of
inventions readiness for industrial production,
between the R&D final stage performers and
industrial enterprises, which is confirmed by the
structure of the participants in the license agreements.
Industrial enterprises filed 23% of applications for
patents for inventions in 2016, made 61% of license
agreements, and universities and research institutes,
respectively, 32.8 and 13.2%.
Table 5: Patent activity of Russian applicants for 9 months
in 2017-2018 by categories of economic entities (units)
(Effective use of intellectual property. Report. Moscow,
2017).
Managing
subjects
9
mont
hs.
2017
In %
of
the
total
num
ber
9
mont
hs.
2018
In %
of
the
total
num
ber
Increa
se, 9
month
s 2018
to 9
month
s 2017
1 Universities 3,613
22.83
3,695
21.14
+2.3
%
2
Research
institutes/scie
ntific
institutions
1,339
8.46
1,618
9.26
+20,8
%
3
Legal
Entities
4,253
26.87
3,694
21.14
-
13,1%
4
Physical
entities
6,509
41.13
8,142
46.59
+25.1
%
Table 4 shows that the receiving country is
dominated by commercial (non-state) enterprises.
Their share in 2016 was 86.6%. The activity of state-
owned enterprises, research institutes, design
bureaus, and universities is low both as a transmitting
and receiving party (Table 5).
The structure of patent holders. A feature of the
Russian residents patent holders structure is, first of
all, a high proportion of research institutes and
universities, and, secondly, a high proportion of
physical entities (Table 5).
Protection areas and protection coefficients. In
2019, Russian Federation was among the top 10
States in terms of resident applications submitted to
the National Patent Office (NPO), it was on the 21st
place in terms of applications for inventions
submitted abroad, on trademark applications, i.e. on
the 13th place to Rospatent and on the 27th place
abroad, and on applications for industrial designs – on
the 14th place to Rospatent and on the 32nd place
abroad (according to WIPO). Moreover, on
applications for inventions abroad, the lag behind the
leader was 40 times (6 thousand in Russia and 236
thousand in the United States). On applications for
trademarks abroad there was a lag by 20 times (30
thousand in Russia and 718 thousand in the United
States), on applications for industrial designs abroad
by almost 100 times (2.6 thousand in Russia and the
209 thousand applications has filed the leader –
China). If we consider the changes in the Russian
situation since 2000, Table 6, then a positive trend can
be noted only for abroad applications for trademarks.
Table 6: Russia place in the world ranking for patents for
inventions and applications for trademarks and industrial
designs to Rospatent and abroad from 2000 to 2017.
Calculated by the author according to WIPO data (WIPO
website, statistics).
2000 2005 2010 2017 2019
Patent grants
for inventions
to the NPO
5 6 6 6 7
On the
received
patents for
inventions
abroa
d
22 19 21 21 22
Patents in
force
Regulatory
documentation
4 5 6 7
For operative
patents for
inventions in
a given year,
abroa
d
Regulatory
documentation
23 23 25 27
WFSDS 2021 - INTERNATIONAL SCIENTIFIC FORUM ON SUSTAINABLE DEVELOPMENT OF SOCIO-ECONOMIC SYSTEMS
280
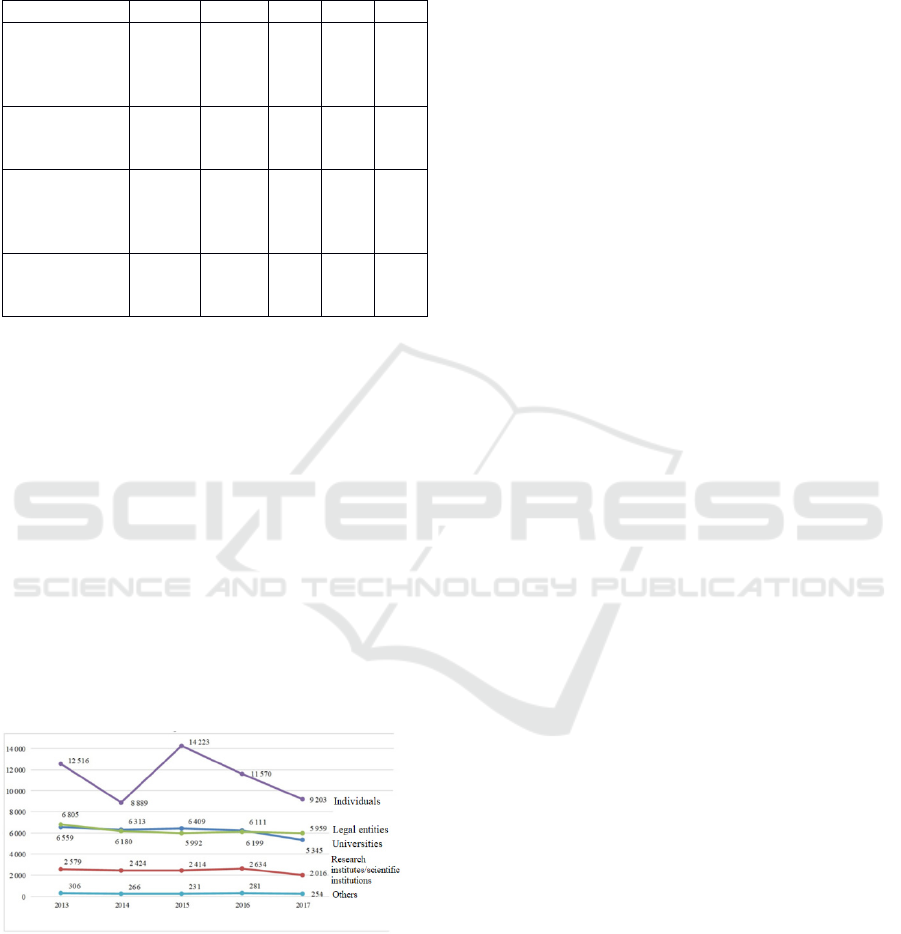
Table 6: Russia place in the world ranking for patents for
inventions and applications for trademarks and industrial
designs to Rospatent and abroad from 2000 to 2017.
Calculated by the author according to WIPO data (WIPO
website, statistics).
2000 2005 2010 2017 2019
On trademark
applications to
the NPO (by
residents)
13 16 17 17 13
On Trademark
applications
abroa
d
32 38 49 47 27
On applications
for industrial
designs to the
NPO
16 15 18 13 14
On applications
for industrial
designs abroa
d
33 42 40 41 32
By the number of patents for inventions, Russia
constantly holds 5-7 places, by the number of patents
abroad Russia is usually in the thirties. By the number
of applications for trademarks and industrial designs
to Rospatent, Russia is in the middle of the twenties
places, by the number ofapplications for trademarks
and industrial designs abroad Russia is in the thirties
or fourties.
Figure 1 shows the applications distribution
dynamics for inventions by copyright holders
categories (Effective use of intellectual property.
Report. Moscow, 2017). This graph shows that
research institutes/institutions and universities
consistently have a large share among applicants,
which is also confirmed by the results of 2018. The
share of research institutes and universities as patent
holders in Russia exceeds the global average.
Figure 1: Graph of Russian applicants patent activity in
2013-2017 by category of economic entities (units)
(Effective use of intellectual property. Report. Moscow,
2017).
As shown, for example, in the WIPO reports,
universities in the world, together with research
organizations, are increasing their presence in the
intellectual property market. In Russia, in 2016, the
share of researchers in higher education institutions,
according to the draft Strategy for scientific and
technological development, reached 9% (62 thousand
people) and became equivalent to the number of
researchers in the academic sector of science (67
thousand people), at the same time, the amount of
research and development costs reached 10% (83
billion rubles), while in the academic sector costs
reached 6% (50.1 billion rubles).
The university science priority funding in Russia
and the introduction of the number of patents in the
reporting indicators in the tenth years led to an
explosive increase in patents owned by Russian
universities. In Russia, the number of patents granted
to universities from 2000 to 2015 increased by 3
times, from 1,823 to 5,726! In total universities in
Russia have received 57.2 thousand patents for
inventions from January 1, 2000 to August 3, 2018,
but only 9 thousand of them are valid as at
03/08/2017. Universities in the United States and
Russia covered almost the same number of inventions
per year by patents. At the same time, Russian
universities have fewer active patents, which are no
longer supported in the absence of prospects for their
use. For example, Russian universities do not have
any US patent, and the possession of IP in the United
States is one of the signs of the developed
technologies high competitiveness (Website of the
US National Patent Office).
Currently, in 2019-2020, universities in Russia, in
contrast to state research institutions, show a decrease
in the number of patents for inventions: if in 2014
Rospatent issued 4,987 patents, in 2017 issued 5,564
patents, then in 2020 issued 4,469 patents. In 2014,
Russian universities received the same number of
patents for inventions in Rospatent as American
universities received in the USPTO. In the same year,
there were 2,700 small enterprises established under
Federal Law 217 at Russian universities, and 4,700
small enterprises operated at American universities
(according to Rospatent, USPTO, WIPO, OECD, and
Rosstat). Despite the significant number of patents
and small innovative enterprises in Russian
universities, the contribution of Russian university
science to the economy innovative development
indicators was modest in the same year. Table 7
shows a comparison between the Russian and
American indicators.
On the other hand, analysts note the increased
demand for Russian university inventions. In 2012 —
2016, the share of intellectual property transferred
under license agreements in universities reached only
1.7%, and in 2020 the indicator was almost 5%. At
Improving the State Policy in the Field of Intellectual Property Management in the Context of Sustainable Economic Development
281
the same time, the number of foreign university
patents has increased almost two and a half times,
although their total number still remains insignificant
and in 2020 did not exceed 400. This trend (a decrease
in the number of patents and an increase in the
commercialization degree) is associated with a
change in the policy on intellectual property
management in Russian universities.
According to the selected criteria, the state of
affairs in Russian science and economics in
comparison with the United States was considered
(Table 7) in 2016. The table shows that science in
Russia slightly lags from the science in the United
States in terms by the number of researchers. As for
the State science and the innovative development of
industry financing, there is a striking difference. The
indicators differ by tens of times, and the number of
foreign patents differs by more than 100 times.
Table 7: Indicators of the science and industry innovative
level in Russia and the United States in 2016. According to
(Site of Rospatent, Rosstat, WIPO, US National Patent
Office, Science and Engineering Indicators 2018;
Perepechko, Yagolnitser and Rakhmanova, 2017; Voronov,
2012; World Bank Database)
Indicato
r
Russia USA
Number of researchers, million
p
eople.
0.43 1.4
Science funding in billion US
dollars
14.1 510
Export of high-tech products,
b
illion US dollars
9.8 155.6
Applications for inventions to
the NPO, thousand units.
27 295
Filed applications for inventions
abroad, thousand units.
4.7 227
Applications for trademarks
(TM) submitted by residents to
the NPO, thousand units.
41.5 300.5
Applications for technical
design submitted abroad by
residents, thousand units.
21 619
Applications for Industrial
Design (ID) submitted by
residents to the NPO, thousand
units.
2.4 21
Applications for Industrial
Design (ID) submitted abroad
b
y residents, thousand units.
1.5 97
The metalworking equipment
production, in 2015, billion US
dollars
0.49 4.6
IP revenue, billion US dollars 0.55 124.5
GDP, trillion US dollars 1.28 18.7
Technology areas. The structure of protected
industrial property objects according to the
technology area varies in different countries. But
around the world, the information and
communication technologies (ICTs) are a priority. IP
protection in the field of information technology in
Russia requires separate consideration. In our
country, inventions in the field of ICT are not
numerous and until 2014, according to WIPO, were
not included in the top 10 industries in terms of the
number of patents. In Russia, software and methods
of processing and storing information are protected
mainly as computer programs and databases, i.e. their
text appearance is protected, but algorithms are not
protected (Perepechko and Zuckerblat, 2020).
In 2017, this situation did not change qualitatively
(Perepechko and Zuckerblat, 2020). If we consider
the patent dynamics, it is more optimistic. The
inventions in the ICT show better dynamics than the
average for all areas compared to 2000 and 2010.
For example, from 2010 to 2018, the largest
increase in the number of patents issued per year was
shown by the following areas of technology: "digital
communications" by 2.2 times, "computer
technologies" by 2.5 times and "measurement
methods" by 5.1 times. But even such performance is
not enough to catch up with the leading countries in
the field of ICT patents in the upcoming years (USA,
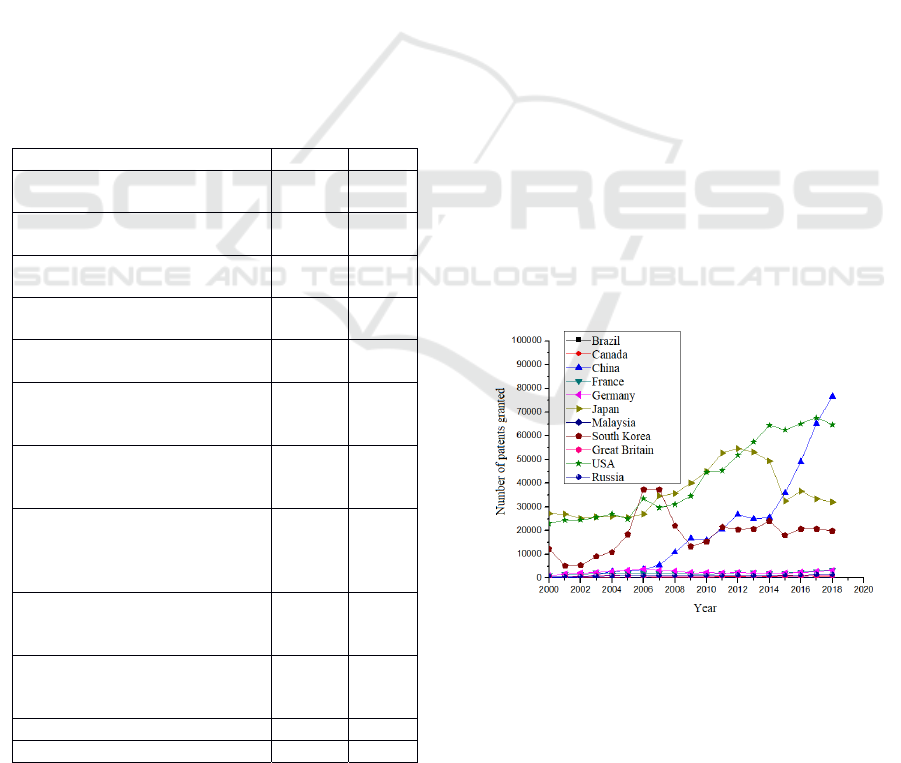
China, Japan, South Korea), Figure 2. While
maintaining this performance, ICT inventions will
soon take the first place by the number of issued
patents in Russia, but their number itself will remain
small compared to the world leaders (Perepechko and
Zuckerblat, 2020).
Figure 2: Number of patents for ICT inventions issued to
the country residents by the National Patent Office (NPO).
According to the WIPO (WIPO website).
As for patenting abroad, patents in one of the
technology areas in ICT, "computer technologies",
according to WIPO, occupy the 3rd place in the
number of patents issued to Russian residents in 2017,
WFSDS 2021 - INTERNATIONAL SCIENTIFIC FORUM ON SUSTAINABLE DEVELOPMENT OF SOCIO-ECONOMIC SYSTEMS
282

their share is almost 6%. But the number of patents
granted abroad in 2017 is small (3,149 pcs). Getting
patents to computer technologies inventions abroad is
associated with the growing export of Russian
software (Munshi Naser Ibne Afzal, 2014).
According to the non-profit partnership Russoft, its
volumes have doubled in seven years from US $ 4
billion in 2011 to US $ 9.7 billion in 2018, increasing
annually by more than 10% since 2003 (Russian
software industry, 2019).
It should also be noted that the number of
registered computer programs and databases has
increased over the past decade from 10.6 thousand in
2013 to 17.9 thousand in 2020. An increase is almost
by 1.7 times, it confirms that RIA in the field of ICT
in Russia are protected mainly not as inventions, but
as computer programs. While being protected in the
form of inventions, Russian and foreign patents,
information and communication technologies can
become one of the most profitable items of Russian
exports, which is determined primarily by the high
qualification of specialists, the level of Russian
developments and the low ruble exchange rate. On the
other hand, the NP Russoft annual report does not
mention the importance of intellectual property
protection in the field of ICT (Russian software
industry, 2019).
Patent maintenance index. The term "patent
maintenance" refers to both a single patent and a
company patent portfolio. For example, in relation to
a single patent, the research conducted at Cass
Business School (Munshi Naser Ibne Afzal, 2014)
showed that the number of references, claims, and
classes in a patent can be informative about the degree
of protection that a patent provides. Novelli suggests
using the number of invention claims and the number
of technological classes in which patent examiners
classify these claims to measure the amount of rights
covered by a patent (Novelli, 2015).
Methods for determining the patent and patent
portfolio maintenance indices are also modified and
patented (Russian software industry, 2019; US
application for invention US20080154767A1). In the
United States, successful industrial systems have
been created on the basis of such studies. For
example, The Patent Board (The Patent Board
website) conducts independent research on the
characteristics of companies patents and intellectual
property investments, as well as develops tools and
metrics for evaluating them. And the private company
Pantros IP, Inc. offers clients a tool for patents
individual in-depth analysis. This tool includes an
assessment of about 30 patent factor indices that
characterize and consider the relationship between
the commercial value, technological level and legal
force of the patent. There is direct links contribution,
back links contribution, licensing potential, market
activity, the total number of different classes, etc.
among these indeces than can be taken into account.
A fundamentally different high-performance
patent analysis algorithm was created with the
support of the financial company ICAP Ocean Tomo
(USA). This algorithm is based on the statistical
relationship of a large ammount of information
indicators and accurate data on the patents
maintenance (Barney, 2002). We shall emphasise that
this technique is difficult to use to determine the
research institute or university patents and the patent
portfolio maintenance index.
Patent statistics are also used to calculate a new
group of financial coefficients that reflect the
company innovation activity, help analyze the
financial indicators dynamics and see trends in the
company financial and economic state, make the
necessary management decisions, using the huge
opportunities of the company patent portfolio
(Russian software industry, 2019; Barney, 2002;
European Commission, 2005). In particular, such
coefficients are the value of intangible assets to the
company book value ratio or the intangible assets
book value to the total costs ratio that the company
has generated to conduct R&D and obtain these
patents.
Intellectual property management systems
presented in the Russian literature (Rosstat: Federal
State Statistics Service, Website of the US National
Patent Office; Science and Engineering Indicators,
2018; Perepechko, Yagolnitser and Rakhmanova,
2017) do not contain recommendations on achieving
targets or monitoring the intellectual property
management effectiveness. Meanwhile, the patent
protection can be one of the important indicators of
the research institutes and universities intellectual
property protection quality. In essence, the patent
maintenance index is a complex indicator formed on
the basis of a number of indicators, such as the patent
duration, the family geographical coverage, the patent
quotation, the availability of licenses or disputes on
the family documents, the amount of rights in the
patent claim, etc. Thus, the patent maintenance index
is one of the indicators of "the operative patent
protection" general concept. This paper selects easily
measurable numerical indicators to assess the patent
maintenance index (Table 8).
Improving the State Policy in the Field of Intellectual Property Management in the Context of Sustainable Economic Development
283
Table 8: Indicators for calculating the patent maintenance
index, F
P
.
Indicato
r
p
c.
1 number of backlinks К
1
2 number of independent formula items К
2
3 number of de
p
endent formula items К
3
4 number of classes in the
p
atent К
4
5 number of
g
ra
p
hic ima
g
es К
5
6
p
atent age К
6
The patent maintenance index is calculated by the
formula (1).
F
p
=
∑
20 𝐾
20
⁄
(1)
Using formula (1) we shall introduce the
following indicators: the main patent index (the sum
of the patents maintenance for all objects), formula
(2); the average patents maintenance index, formula
(3). These indicators are calculated for eleven natural
science institutes of the SB RAS (SB RAS) and
Novosibirsk State University (NSU).
𝐼
∑
𝐹
(2)
𝑃𝐼
/𝑁 (3)
When calculating the patents maintenance index,
it turned out that the data on back links are not clearly
defined, i.e. there are links in patent search reports,
links to analogues in the description, links occurred
during the examination, and they are divided into
patent and literary links. Therefore, for the sake of
homogeneity, this parameter was removed. As a
result of the analysis, we assume that the patents
maintenance index in the SB RAS and in NSU in
general is not high, and is in the range of 1.24 - 2.2
(Table 9).
Table 9: Main patent indexes of institutes of SB RAS, NSU
and companies.
Number
of
patents
N
Main
patent
Index, I
p
Avera
ge
mainte
nance
p
atents
index
P
1
Institute of
Geology and
Mineralogy of the
SB RAS 36 49.5 1.38
2
Institute of
Mining of the SB
RAS 36 60.25 1.67
3
Institute of
Petroleum
Geology and 13 16.1 1.24
Geophysics of the
SB RAS
4
Geophysical
Center of the SB
RAS 1 2.15 2.15
5
Institute of
Inorganic
Chemistry, SB
RAS 27 46.55 1.72
6
Federal Research
Center "Institute
of Catalysis" of
the SB RAS 264 554 2.09
7
Institute of Laser
Physics of the SB
RAS 7 14.15 2.02
8
Institute of
Nuclear Physics
of the SB RAS 39 57.45 1.47
9
Institute of
Molecular and
Cell Biology of
the SB RAS 2 2.75 1.38
10
Federal Research
Center "Institute
of Cytology and
Genetics" of the
SB RAS 39 63.9 1.64
11
Federal Research
Center for
Information and
Computing
Technologies of
the SB RAS 2 4.35 2.2
12
Institute of
Thermophysics of
the SB RAS 92 138.7 1.51
13
Indian Institute
Technolo
gy
Delhi 51 187.7 3.68
14 NSU 151 252 1.68
15 Sibur Holding 79 252 3.19
Separately, the experience of the Institute of
Catalysis SB RAS (IC SB RAS) should be noted, the
average patents maintenance index of the SB RAS is
2.09, and the foreign patents maintenance index of
this institute is 5.0. In particular, the Institute
international applications and foreign patents have
much greater "strength", and as a result, have the
highest rates of commercialization and distribution.
NSU has 151 patents of the Russian Federation, the
average strength of which is 1.68. Except for the
Federal Research Center "Institute of Catalysis" of
the SB RAS, other institutes and NSU have no foreign
patents. For comparison, the main patent index of the
WFSDS 2021 - INTERNATIONAL SCIENTIFIC FORUM ON SUSTAINABLE DEVELOPMENT OF SOCIO-ECONOMIC SYSTEMS
284

Indian Institute of Technology Delhi was calculated
for patents from the Espacenet database. As at August
30, 2019, the institute owned 51 patent families, the
main patent index was 1 87.7, the average patents
maintenance index was 3.7.
According to the World Intellectual Property
Organization, among the first 10 Russian companies
applying for patents under the PCT system there is
PJSC SIBUR Holding ( Tomsk). The company has 79
patents of the Russian Federation, 37 international
applications and patent families. In general, the
average Russian patents maintenance index is 3.19.
Thus, the research institutes and universities
intellectual property protection is poor, which
explains its low demand on the market. It is possible
to correct the situation if the main patent index and
the average patents maintenance index are included in
the reporting indicators of research institutes and
universities as a measure of the intellectual property
management effectiveness.
3 CONCLUSION
The range of goods and services innovative
improvement should be carried out on the basis of
scientific achievements and high-tech production. As
a result of the analysis, it turned out that the quality
of patents protected by Russian companies and state
research institutes and universities is low, which
explains their low demand in the market. Therefore,
improving the quality of patents can be included in
the research institutes and universities tasks for the
intellectual property management, and the main
patent index and the average patents maintenance
index can be recommended as reporting indicators of
the effectiveness of activities in this area. Improving
the patents quality will lead to the use of the
intellectual activity results created in research
institutes and universities by companies in the
business sector, and will allow to achieve a positive
economic effect by increasing the share of high-tech
products.
REFERENCES
Nekhoroshkov, V. P., Aroshidze, A. A., 2016. Economic
stability and sustainable development as a category of
management of an economic entity, Economic
Sciences, 5: 25–29.
HSE Static Collections. Science Indicators: 2019.
https://www.hse.ru/primarydata/in2019
Website of the Ministry of Education and Science.
https://www.minobrnauki.gov.ru/
Site of Rospatent. http://www1.fips.ru/
Rosstat: Federal State Statistics Service,
https://rosstat.gov.ru/.
Effective use of intellectual property. Report. Moscow,
2017. Center for Strategic Research, web: csr.ru.
WIPO website, statistics. https://www.wipo.int/ipstats/en/
Website of the US National Patent Office www.uspto.gov
Science and Engineering Indicators 2018, available at:
https://www.nsf.gov/statistics/ 2018 / nsb20181 / assets
/ nsb20181.pdf, accessed August 16, 2019.
Perepechko, L.N., Yagolnitser, M.A., Rakhmanova, A.R.,
2017. Features of the development of the intellectual
property market in the world and in Russia, Economy
and entrepreneurship, 3 hours 1 (80-1): 54 -64.
Voronov, V.S., 2012. Indicators of the value of the
corporate patent portfolio and their role in the formation
of a new group of financial ratios, Financial analytics.
Problems and Solutions, 39 (129): 15–23.
Perepechko, L.N., Zuckerblat, D.M., 2020. Forecasting
scientific and technological development based on
patent information, Information Society, 4: 63-79.
Russian software industry, 2019. 16th annual survey. NP
Russoft. 2019.www.russoft.org.
Munshi Naser Ibne Afzal, 2014. An empirical investigation
of the National Innovation System (NIS) using Data
Envelopment Analysis (DEA) and the TOBIT model,
International Review of Applied Economics, 28 (4):
507-523.
Novelli, E., 2015. An examination of the antecedents and
implications of patent scope. Cass Business School,
City University London, 106 Bunhill Row, London
EC1Y 8TZ, UK Research Policy, 44: 493-507.
US application for invention US20080154767A1 "Method
for assessing the strength of patent portfolios and
valuating them for purposes of monetization".
The Patent Board website (URL: http: //patentboard.сom).
Barney, J.A., 2002. A Study of patent mortality rates: using
statistical survival analysis to rotate and value patent
assets, AIPLA Quarterly Journal, 30 (3).
European Commission, 2005. Towards a European
Research Area: Science, Technology and Innovation,
Key Figures. Luxembourg: Office for Official
Publications of the European Communities ..
World Bank. World Bank Database. E-resource: http //
data.worldbank.org / topic / science-and-technology.
Smirnova, V. R., 2019. Foundations of the institutional and
innovation ecosystem in universities and research
institutions. Proceedings of the National Seminar on
Intellectual Property Policy of Universities and
Research Institutions, March 26-27, Omsk.
http://conf.ict.nsc.ru/files/conferences/intellectual_pro
perty2010.
Smirnova, V.R., Shulgin, D.B., Kortov, S.V., Terlyga,
N.G., 2016. Experience in the formation of an
intellectual property management system in UrFU,
University management: practice and analysis, 2 (102):
72-83.
Improving the State Policy in the Field of Intellectual Property Management in the Context of Sustainable Economic Development
285

Loseva, O. V., Bakulina, A. A., 2019. The system of
evaluation and commercialization of scientific research
results in scientific organizations and higher
educational institutions, Digest of scientific life of the
Financial University, 3: 87. http://bit.ly/ 2kgZcdX.
Seliverstov, Y.I., 2012. On the assessment of the efficiency
of accumulation and use of intellectual property of the
enterprise, Creative Economy, 7.
WFSDS 2021 - INTERNATIONAL SCIENTIFIC FORUM ON SUSTAINABLE DEVELOPMENT OF SOCIO-ECONOMIC SYSTEMS
286
