
Socio-economic Policy of the Eurasian Economic Union Countries
and Regions and Its Modernization Specifics: Problems and
Contradictions
Tatiana S. Malakhova
1a
, Boris E. Markov
2b
and Natalia V. Poluyanova
3c
1
Kuban State University, Krasnodar, Russia
2
Krasnodar University of the Ministry of Internal Affairs of the Russian Federation, Krasnodar, Russia
3
Belgorod State National Research University, Belgorod, Russia
Keywords: Socio-economic Policy, Integration, Eurasian Economic Union, Employment, Unemployment, Charged
Services, Expenses.
Abstract: In modern conditions, the EEU countries socio-economic situation is transforming under the influence of
external challenges and threats related to the current crisis, the change in the world economic system, the
world monetary system transformation, etc. All these factors directly affect the Eurasian Economic Union
countries socio-economic policy. This article is aimed at studying the key socio-economic indicators of the
Eurasian Economic Union countries, at building a linear model of the households and monetary expenditures
actual final consumption and expenditures for the goods and services purchase in Russia ratio, as well as
calculating forecasts of individual economic indicators in the given area. Moreover, special attention is paid
to the Russian socio-economic policy and its relation with the Eurasian Economic Union partner countries
through the deepening integration processes prism. As a theoretical and methodological basis, the article uses
historical, logical, dialectical principles and contradictions, the scientific abstraction method. The process-
system approach, which was used in an in-depth analysis of key indicators in the given area, has become
especially important in the argument about the need to strengthen the relations between the countries of the
integration group in the socio-economic sphere. Based on an in-depth analysis of the EEU countries socio-
economic indicators and the formation of a linear model, the key directions for the integration processes
development in the region are identified. The emphasis is shifted towards strengthening the inter-country
relations in key socio-economic areas of the partner countries and focusing on a coordinated economic policy
in these areas. On the basis of the presented econometric model and the key EEU countries socio-economic
indicators, the problems and contradictions in the socio-economic field are investigated, also the directions
for the contradictions elimination are identified. This will lead to the development and strengthening of
relations between the partner countries.
1 INTRODUCTION
In modern conditions, the world economy as a whole
is experiencing serious transformations associated
with the transition of countries to a new world
economic and technological order, with the neoliberal
model crisis, with changes in the monetary and
financial systems, the appearance of new economic
leaders in the world, etc. (Malakhova and
a
https://orcid.org/0000-0002-5971-8178
b
https://orcid.org/0000-0003-4798-6906
c
https://orcid.org/0000-0003-2978-9124
Kolesnikov, 2019). All these changes directly affect
both individual countries and other subjects of the
world economy, including integration groups
(Malakhova, Dubinina, Maksaev, Fomin, 2019). The
EEU is no exception, as it is actively internationalized
in global economic relations with partner countries.
Despite the strengthening of inter-country relations in
the Eurasian Economic Union, there are problems and
contradictions in the socio-economic sphere in each
country, based on their development models. The
254
Malakhova, T., Markov, B. and Poluyanova, N.
Socio-economic Policy of the Eurasian Economic Union Countries and Regions and its Modernization Specifics: Problems and Contradictions.
DOI: 10.5220/0010666900003223
In Proceedings of the 1st International Scientific Forum on Sustainable Development of Socio-economic Systems (WFSDS 2021), pages 254-260
ISBN: 978-989-758-597-5
Copyright
c
2022 by SCITEPRESS – Science and Technology Publications, Lda. All rights reserved

article focuses on the current state of Russian socio-
economic policy through the prism of integration
processes with the EEU countries.
2 RESEARCH METHODOLOGY
In Russia, many scientists and experts are engaged in
research in the field of the country socio-economic
policy through the integration processes prism. One
of the notable scientists is the academician Glazyev
S.Yu., who emphasizes that the key task of the EEU
development is to build a proper single economic
space and further implement a common policy in
industry, agriculture, energy and other areas
(Glazyev, 2020). Scientists Greenberg R.S. and Pylin
A.G. note in their research that the integration group
is at a critical stage of its development, and serious
economic contradictions remain between the key
participants of the Eurasian Economic Union
(Greenberg and Pylin, 2020). Special attention in
Borodushko I.V. research is paid to the coordination
in the Eurasian Economic Union countries economic
policy through the convergence of the countries
socio-economic development level, increasing
competitiveness in domestic and foreign markets
(Borodushko, 2017). The scientists Pak Kh.S.,
Ushakova E.V., Borisova T.A. in their research
propose the system that uses the principle of
coordinated integration interaction in the EEU
countries. This principle will allow to identify and
assess the risk of potential threats, etc. (Pak Kh.S.,
Ushakova E.V., Borisova T.A., 2020). Knobel A.
evaluates the EEU development prospects and
problems, examines this integration group with other
world economy subjects (Knobel’, 2019). J. Garlick
and G. Shakhanova emphasize that it is important for
the Eurasian Economic Union countries to work on
joint projects with China in the field of infrastructure,
trade procedures, etc. (Garlic and Shakhanova, 2020).
We can draw a conclusion that the scientists study the
EEU countries economies from different sides and
positions, which makes it possible to assess their
socio-economic policies more deeply.
3 RESEARCH RESULTS
There is a number of key indicators for assessing and
analyzing the current socio-economic policies in the
EEU countries. They are presented in Table 1. The
population in the EEU countries did not change
significantly from 2016 to 2019. In Armenia from
2016 to 2019 it was 3.0 million people. In the
Republic of Belarus, the population also did not
change (from 2016 to 2019, the figure was at the level
of 9.5 million people). Only in 2020, this indicator
decreased by 0.1 million people compared to 2019. In
Kazakhstan, the population in 2016 was 17.7 million
people, in 2017 it was 17.9 million people, in 2018 it
was 18.2 million people, in 2019 it was 18.4 million
people. This indicator in Kazakhstan was unstable for
the analyzed period. In 2019, compared to 2016, it
increased by 0.7 million people. Every year there was
an increase in the Kazakhstan population. In 2020,
compared to 2019, the indicator increased by 0.2
million people. In Kyrgyzstan, the population in 2016
was 6.0 million people, in 2017 it was 6.1 million
people, in 2018 it was 6.3 million people, in 2019 it
was 6.4 million people. The Kyrgyzstan population is
also increasing. In 2019, compared to 2016, the
growth was 0.4 million people. In 2020, compared to
2019, the population increased by 0.1 million people.
In Russia, the population in 2016 was 146.5 million
people, in 2017 it was 146.8 million people, in 2018
it was 146.9 million people, in 2019 it was 146.8
million people, in 2020 it was 146.7 million people.
In 2020, compared to 2016, there was an increase in
the population by 0.2 million people. If we study the
countries that are members of the CIS, but do not
function in the Eurasian Economic Union, according
to this indicator, then they also have an increase in the
population. For example, in Uzbekistan in 2016, this
figure was 31.6 million people, in 2017 it was 32.1
million people, in 2018 it was 32.7 million people, in
2019 it was 33.3 million people, in 2020 it was 33.9
million people. A significant socio-economic
indicator is the employment rate in the EEU countries
for 2016-2019. In Armenia, the employment rate was
52.1% in 2016, 51.9% in 2017, 49.7% in 2018, and
51.2% in 2019. In 2019, compared to 2018, this
indicator increased by 1.5%. In the Republic of
Belarus, the employment rate in 2016 was 72.9%,
73.5% in 2017, 74.5% in 2018, 75.1% in 2019. As
statistics show, the employment rate in the Republic
of Belarus increases every year. In Kazakhstan, it was
73.7% in 2016, 73.3% in 2017, and 74.4% in 2018. In
2018, compared to 2017, the employment rate
increased by 0.7 million people.
In Kyrgyzstan, this indicator was unstable over
the analyzed time period. In 2016, it was 60.4%,
59.3% in 2017, 59.5% in 2018, 60.3% in 2019. In
2019, compared to 2016, the employment rate
decreased by 0.1%. In Russia, it was 70.0% in 2016,
70.3% in 2017, 71.0% in 2018, and 70.8% in 2019. In
2019, compared to 2016, the employment rate
increased by 0.8%.
Socio-economic Policy of the Eurasian Economic Union Countries and Regions and its Modernization Specifics: Problems and
Contradictions
255

Table 1: The key socio-economic indicators in the Eurasian
Economic Union countries assessment through the prism of
strengthening integration processes in the region for 2016-
2019 (compiled by the authors based on the materials
(Population and social indicators of the CIS countries and
world separate countries 2016-2019, 2020)).
Countrie
s
Population, in million people /
Employment rate, in % /
Unemployment rate, in % /
Unemployment rate among young people
aged 15-24, in %
The income ratio of the 20% groups of
the most and least well-off population, in
times / Total number of pensioners, per
1,000 population
Years
2016 2017 2018 2019
Armenia
3.0 /
52.1 /
18.5 /
36.6 /
9.4 /
157
3.0 /
51.9 /
18.4 /
38.4 /
8.3 /
154
3.0 /
49.7 /
19.3 /
33.5 /
8.3 /
156
3.0 /
51.2 /
18.4 /
31.9 /
8.3 /
158
Belarus
9.5 /
72.9 /
5.9 /
10.7 /
4.2 /
276
9.5 /
73.5 /
5.6 / 9.3
/
3.9 /
273
9.5 /
74.5 /
4.8 /
10.7 /
4.0 /
270
9.5 /
75.1 /
4.1 /
10.2 /
4.0 /
267
Kazakhs
tan
17.7 /
73.7 /
5.0 / 3.8
/
4.0 /
155
17.9 /
73.7 /
4.9 / 3.8
/
4.2 /
157
18.2 /
74.4 /
4.9 / 3.7
/
4.2 /
157
18.4 /
– /
4.9 /
3.6 /
4.2 /
157
Kyrgyzst
an
6.0 /
60.4 /
7.3 /
15.5 /
8.4 /
123
6.1 /
59.3 /
7.0 /
14.8 /
7.7 /
123
6.3 /
59.5 /
6.2 /
12.4 /
7.1 /
124
6.4 /
60.3 /
5.5 /
12.8 /
6.6 /
125
Russia
146.5 /
70.0 /
5.6 /
16.3 /
8.9 /
294
146.8 /
70.3 /
5.2 /
16.1 /
8.8 /
296
146.9 /
71.0 /
4.8 /
16.6 /
8.9 /
299
146.8 /
70.8 /
4.6 /
15.5 /
8.8 /
297
Now we shall proceed to the analysis of the
socially significant indicator that is the
unemployment rate. In 2016, the unemployment rate
in Armenia was 18.5%, 18.4% in 2017, 19.3% in
2018, 18.4% in 2019. In 2019, compared to 2018, this
indicator decreased by 0.9%. However, the analysis
showed that there were no significant changes during
this period. In the Republic of Belarus in 2016, the
unemployment rate was 5.9%, 5.6% in 2017, 4.8% in
2018, 4.1% in 2019. In 2019, compared to 2016, it
decreased by 1.8%. In Kazakhstan, no significant
changes were observed during the analyzed period. In
2016, the unemployment rate was 5.0%, 4.9% in
2017, 4.9% in 2018, 4.9% in 2019. In Kyrgyzstan, the
unemployment rate was 7.3% in 2016, 7.0% in 2017,
6.2% in 2018, and 5.5% in 2019. In Kyrgyzstan, there
was a significant reduction in the given indicator. In
2019, compared to 2016, the unemployment rate
decreased by 1.8%. It remains to analyze this
indicator for Russia. In 2016, the unemployment rate
in the country was 5.6%, 5.2% in 2017, 4.8% in 2018,
4.6% in 2019. In 2019, compared to 2016, it
decreased by 1.0%. Special attention should be paid
to the youth unemployment rate in the countries of the
Eurasian Economic Union. The dynamics of the
given indicator is also presented in Table 1. In
general, the unstable dynamics in this indicator was
observed in the EEU. In Armenia, the youth
unemployment rate was 36.6% in 2016, 38.4% in
2017, 33.5% in 2018, and 31.9% in 2019. In 2019,
compared to 2016, the youth unemployment rate
decreased by 4.7%. In the Republic of Belarus, there
was an unstable dynamics in this indicator. In 2016,
it was 10.7%, 9.3% in 2017, 10.7% in 2018, 10.2% in
2019. In 2019, compared to 2017, the youth
unemployment rate increased by 0.9%. In
Kazakhstan, it was 3.8% in 2016, 3.8% in 2017, 3.7%
in 2018, and 3.6% in 2019. In 2019, compared to
2016, this indicator decreased by 0.2%. In
Kyrgyzstan, the youth unemployment rate was 15.5%
in 2016, 14.8% in 2017, 12.4% in 2018, and 12.8% in
2019. In 2019, compared to 2016, this indicator
decreased by 2.7%. In Russia, the youth
unemployment rate was unstable over the analyzed
time period. In 2016, it was 16.3%, 16.1% in 2017,
16.6% in 2018, 15.5% in 2019. This indicator in 2019
decreased by 0.8% compared to 2016.
A significant socio-economic indicator is the
income ratio of the 20% groups of the most and least
wealthy population. In Armenia, this indicator was
9.4% in 2016, 8.3% in 2017, 8.3% in 2018, and 8.3%
in 2019. In 2019, compared to 2016, it decreased by
1.1%. There were no significant fluctuations in this
indicator in the Republic of Belarus during the
analyzed period. In 2016, it was 4.2%, 3.9% in 2017,
4.0% in 2018, 4.0% in 2019. This indicator decreased
by 0.2% in 2019 compared to 2016. In Kazakhstan, in
2016, the income ratio of the 20 percent groups of the
most and least wealthy population was 4.0%, 4.2% in
2017, 4.2% in 2018, 4.2% in 2019. In 2019, compared
to 2016, in Kazakhstan, on the contrary, this indicator
increased by 0.2%. In Kyrgyzstan, it was 8.4% in
2016, 7.7% in 2017, 7.1% in 2018, and 6.6% in 2019.
In 2019, compared to 2016, this indicator decreased
WFSDS 2021 - INTERNATIONAL SCIENTIFIC FORUM ON SUSTAINABLE DEVELOPMENT OF SOCIO-ECONOMIC SYSTEMS
256

by 1.8%. As for Russia, there were no significant
changes in the analyzed indicator. In 2016, it was
8.9%, 8.8% in 2017, 8.9% in 2018, 8.8% in 2019. It
is important to note that in Russia this indicator is the
highest not only among the countries of the Eurasian
Economic Union, but also among the CIS countries.
For example, in Uzbekistan in 2017 it was 4.1%,
4.1% in 2018, 4.1% in 2019. In the Republic of
Moldova in 2016, this indicator was 6.9%, 6.4% in
2017, 5.8% in 2018, 6.2% in 2019. In 2019, compared
to 2016, it decreased by 0.7%. Another important
socio-economic indicator is the total number of
pensioners and their social support. Within the
framework of this article, the total number of
pensioners from 2016 to 2019 per 1,000 people of the
population is analyzed. In Armenia, in 2016, this
figure was 157 people, 154 people in 2017, 156
people in 2018, 158 people in 2019. In 2019,
compared to 2016, it increased by 1 person. In the
Republic of Belarus, this indicator was unstable
during the analyzed period. In 2016, it was 276 people
per 1,000 population of the Republic of Belarus, 273
people in 2017, 270 people in 2018, 267 people in
2019. In 2019, compared to 2016, this indicator
decreased by 9 people. In Kazakhstan, there were no
significant changes in the total number of pensioners.
In 2016, the figure was 155 people, 157 people in
2017, 157 people in 2018, 157 people in 2019. In
2019, compared to 2016, this indicator increased by 2
people. It remains to analyze this indicator in
Kyrgyzstan and Russia. In 2016, the total number of
pensioners in Kyrgyzstan was 123 people per 1,000
people, 123 people in 2017, 124 people in 2018, 125
people in 2019. In 2019, compared to 2016, this
indicator increased by 2 people. In Russia, in 2016, it
was 294 people, 296 people in 2017, 299 people in
2018, 297 people in 2019. In 2019, compared to 2016,
this indicator increased by 3 people. In general, there
were no significant changes in this indicator
(Population and social indicators of the CIS countries
and world separate countries 2016-2019, 2020).
The Russian Federation socio-economic
development forecast or the period up to 2024 pays
special attention to the development of economic and
social sectors (education, health, culture, physical
culture and sports). The main directions of education
development for the period up to 2024 are approved
by the Decree and the State program "The Education
Development". In the health care system in 2019-
2024, certain measures will be taken to reduce the
mortality rates of the working-age population, to
develop infrastructure, to strengthen the preventive
orientation of health care sphere, etc. The priority
measures for the cultural sphere development, the
State cultural policy strategic objectives, as well as
the key principles for the culture implementation until
2024 are provided for by the Decree, the Strategy of
the State Cultural Policy for the period up to 2030,
etc. The physical culture and sports development until
2024 will be carried out in accordance with the
Decree, the State program "The Physical Culture and
Sports Development", etc. (Forecast of socio-
economic development of the Russian Federation for
the period up to 2024, 2019). Despite the
implementation of the presented programs, strategies,
etc. in the field of the Russian Federation socio-
economic development there is a trend towards an
annual increase in charged services (Table 2).
Table 2 generally shows the volume of charged
services to the Russian population. In 2019, compared
to 2010, this indicator increased by 5,451,737 million
rubles. The volume of transport services to the
population in 2010 was 940,545 million rubles, in
2015 it was 1,481,518, in 2016 it was 1,699,442, in
2017 it was 1,850,446, in 2018 it was 1,928,971, in
2019 it was 2,060,506 million rubles. In 2019,
compared to 2010, this indicator increased by
1,119,961 million rubles. The next socially
significant indicator is the volume of housing services
to the population. In 2010, it was 286,552 million
rubles, in 2015 it was 525,594 million rubles, in 2016
it was 580,614 million rubles, in 2017 it was 677,773
million rubles, in 2018 it was 722,209 million rubles,
in 2019 it was 765,342 million rubles. In 2019,
compared to 2010, the volume of housing services to
the population of Russia increased by 478,790 million
rubles.
The volume of charged medical services to the
population in 2010 was 250,474 million rubles,
528,359 million rubles in 2015, 572,445 million
rubles in 2016, 626,626 million rubles in 2017,
677,686 million rubles in 2018, 734,365 million
rubles in 2019. In 2019, compared to 2010, the
volume of charged medical services to the population
of Russia increased by 483,891 million rubles. Also,
special attention should be paid to the volume of
charged services in physical culture and sports in
Russia. In 2019, compared to 2010, this indicator
increased by 62,497 million rubles. A similar trend
was observed in the volume of charged tourist
services to the population. In 2010, this indicator was
99,879 million rubles, in 2015 it was 158,252, in 2016
it was 161,344, in 2017 it was 166,520, in 2018 it was
172,090, in 2019 it was 186,839 million rubles. In
2019, compared to 2010, the volume of charged
tourist services to the population of Russia increased
by 86,960 million rubles. At the figure 1 there is a
Socio-economic Policy of the Eurasian Economic Union Countries and Regions and its Modernization Specifics: Problems and
Contradictions
257

calculated forecast of the volume of charged services
in the education system until 2025.
Table 2: The dynamics of indicators of individual charged
services in Russia for 2010-2019, in million rubles
(compiled from the materials (Charged service to the
population in Russia, 2019))
Indicators
Years
2010 2015 2016 2017 2018 2019
Volume
of charged
services to
the
p
opulation
4,943,
482
8,05
0,808
8,636
,277
9,211,
441
9,703,
358
10,39
5,219
Volume
of
transport
services to
the
p
o
p
ulation
940,5
45
1,48
1,518
1,699
,442
1,850,
446
1,928,
971
2,060,
506
The
volume of
housing
services to
the
p
o
p
ulation
286,5
52
525,
594
580,6
14
677,7
73
722,2
09
765,3
42
The
volume of
charged
medical
services to
the
p
o
p
ulation
250,4
74
528,
359
572,4
45
626,6
26
677,6
86
734,3
65
The
volume of
charged
services in
the
education
system
326,1
00
539,
685
567,3
12
613,2
94
655,4
72
696,0
39
The
volume of
charged
services in
physical
culture
and s
p
orts
30,08
9
62,2
09
70,27
4
78,46
6
87,68
4
92,58
6
The
volume of
charged
tourist
services to
the
p
o
p
ulation
99,87
9
158,
252
161,3
44
166,5
20
172,0
90
186,8
39
Figure 1: The volume of charged services in the education
system from 2015 to 2019
and the calculation of the
forecast until 2025. (compiled and calculated by the authors
based on the materials (Charged service to the population
in Russia, 2019))
Calculations
have shown that the volume of
charged services in the education system will increase
with high and low probability until 2025. With a high
probability, this indicator in 2021 will be 788,258
million rubles, in 2022 it will be 828,768, in 2023 it
will be 869,271, in 2024 it will be 909,767, in 2025 it
will be 950,257 million rubles. Based on calculations,
in 2025, the volume of charged services in the
education system will increase by 294,785 million
rubles compared to 2018.
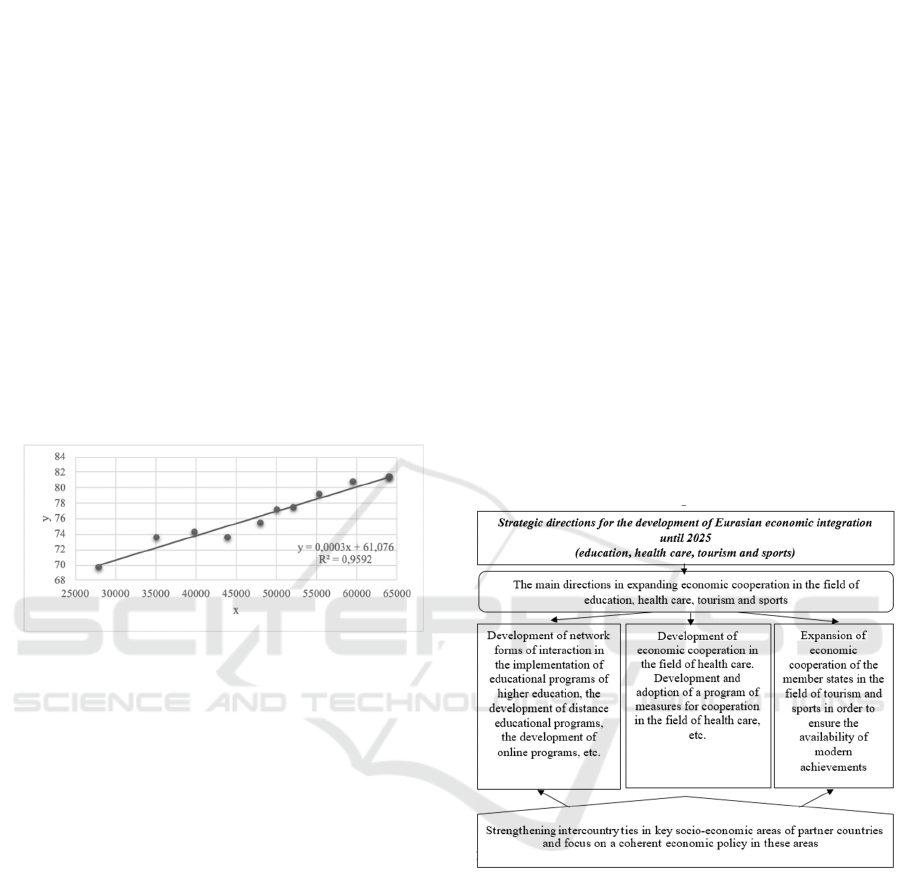
Let's build a linear model that includes the
following indicators: the households actual final
consumption and monetary expenditures for the
goods and services purchase in Russia (Figure 2). In
general, the Figure 2 shows the observations
uniformity presence, also there is the regression
equation and the determination coefficient (R2). The
equation of the linear pair regression model
describing the relationship between these indicators
has the following form 1:
y = 61.076+0.0003*x (1)
It is important to analyze the quality of the
presented model. To do this, we will estimate the
regression coefficients significance using the
Student's t-criteria. Then we will evaluate the model
using variance and correlation analysis. The Student's
test value is 2.262. It is important to establish the
significance of the coefficients a and b, so we assume
that:
No_a: a = 0 - not
statistically
significant
No_b: b = 0 - not
statistically significant
N1_b: b = 0 - not
statisticall
y
si
g
nifican
t
WFSDS 2021 - INTERNATIONAL SCIENTIFIC FORUM ON SUSTAINABLE DEVELOPMENT OF SOCIO-ECONOMIC SYSTEMS
258
N1_a: a = 0 - not
statistically
si
g
nifican
t
55.570 > 2.262
Ho_a is rejected with
a probabilit
y
of 95%
14.550 > 2262
Ho_b is rejected with
a probabilit
y
of 95%
Coefficient a is
statistically
si
g
nifican
t
Coefficient b is
statistically significant
The next way to analyze the quality of the model
is the Fisher F-criteria or regression dispersive
analysis. The hypothesis is as follows:
Ho: b=0 (there is no linear relationship
b
etween x and
y
)
F critical
–
5.318
F observed 211.704 > F critical 5.117, hence,
the Ho: b=0 hypothesis is deviated, i.e. there
is a linear relationship between the x and y
variables.
Figure 2: Linear model of the households actual final
consumption and monetary expenditures for the goods and
services purchase in Russia ratio (calculated by the authors)
The multiple R is the correlation coefficient value
(the linear relationship tightness measure between the
x and y variables). The multiple R was 0.959. Next,
we transfer the correlation coefficient into a
percentage and it is 95.9%. The 95.9% variation in the
variable y (monetary expenditures for the goods and
services purchase) is due to the variability of the
variable x (households actual final consumption). The
effect of x on y is 95.9%. Consequently, 4.1% is
accounted for by other factors not taken into account
in the model. The average approximation error is
0.756%. It is important to calculate the forecast of the
analyzed data. Thus, x amounts to 50,601.28 billion
rubles, and y amounts to 77.14%. Thus, if x increases
by 3% of the average value, then y will be 77.14%.
Forecast value intervals are the following: y min is
75.24%, y max is 79.04%. With a 95% chance of
increasing the x score by 3%, the y score will be in
the range of 75.24% to 79.04%. The analysis showed
that, based on the current situation in the Russian
socio-economic sphere, the maximum increase in the
y indicator is most likely. On this basis, there is a need
for further development of the socio-economic policy
not only in Russia, but also in other Eurasian
Economic Union countries. In December 2020 the
members of the Supreme Eurasian Economic Council
approved the Strategic Directions for the
Development of the Eurasian Economic Integration
until 2025 (On the Strategic Directions for the
Development of the Eurasian Economic Integration
until 2025, 2020). The document pays special
attention to the expansion of economic cooperation in
the fields of education, health, tourism and sport.
Figure 3 shows only individual directions and their
elements in the given areas. The presented strategic
directions for the development of the Eurasian
economic integration until 2025 will strengthen inter-
country relations in key socio-economic areas of the
partner countries and orient them towards a
coordinated economic policy in these areas. The
experience exchange between the Eurasian Economic
Union countries will provide an opportunity to
mitigate the problems and contradictions that exist in
Russian socio-economic sphere (Malakhova, 2018).
Figure 3: Key directions in the economic cooperation
expansion in the field of education, health, tourism and
sport (compiled by the authors based on the materials (On
the strategic directions of the development of the Eurasian
Economic Integration until 2025, 2020))
4 DISCUSSION OF RESULTS
The calculations and analysis have shown that certain
socio-economic indicators in Russia are unstable,
which directly affects relations with the Eurasian
Economic Union countries. Any integration implies
the economies convergence, the strengthening of
cooperative ties within the association. However,
internal problems and contradictions in the country
Socio-economic Policy of the Eurasian Economic Union Countries and Regions and its Modernization Specifics: Problems and
Contradictions
259

economic development can negatively affect these
processes. The forecasts have shown that the volume
of charged services in the Russian education system
will grow until 2025 (forecasts with high and low
probability show an increase in this indicator). Not
only Russian socio-economic policy, but socio-
economic policies of other EEU countries include a
system of measures that should be implemented in the
interests of society, national economies economic
entities. This policy is focused on the economy
dynamic development, on the elimination of social
problems and contradictions that exist in the
countries.
5 CONCLUSION
Thus, first, the article analyzes the key socio-
economic indicators of the EEU countries for 2016-
2019 through the prism of strengthening integration
processes in the region. Special attention is paid to the
problems and contradictions that arise in the partner
countries of the association in the implementation of
the current socio-economic policy.
Secondly, individual charged services indicators
assessment and analysis for 2010-2019 in Russia was
carried out. There was an increase in volumes for all
types of services presented. On this basis, special
attention is paid to the volume of charged services in
the Russian education system from 2015 to 2019 and
the calculation of the forecast until 2025. The
calculation showed a similar increase in this
indicator.
Third, a linear model of the households actual
final consumption and monetary expenditures for the
goods and services purchase in Russia ratio has been
formed. The 95.9% variation in the variable y
(monetary expenditures for the goods and services
purchase) is due to the variability of the variable x
(households actual final consumption). In addition,
the strategic directions of the Eurasian economic
integration development until 2025 in the field of
education, health, tourism and sport were studied.
REFERENCES
Borodushko, I. V. (2017). Trends and problems of socio-
economic development of the countries of the Eurasian
Economic Union, Scientific Notes of the St. Petersburg
named after V.B. Bobkov branch of the Russian
Customs Academy, 2: 9–15.
Glazyev, S.Yu. (2020). On the strategic directions of
development of the EAEU, EURASIAN
INTEGRATION: economics, law, politics, 1: 11-30.
Greenberg, R.S., Pylin, A.G. Eurasian Economic Union.
Key development trends against the backdrop of global
uncertainty, Regional Economy, 16 (2): 340–351.
Malakhova, T.S. (2018). Development and improvement of
forms of economic interaction between countries (using
the EU experience in building the EAEU), Hypothesis,
3 (4): 62-70.
Population and social indicators of the CIS countries and
individual countries of the world 2016-2019. Interstate
Statistical Committee of the CIS. - M. 2020, pages 20-
32.
On the Strategic Directions for the Development of
Eurasian Economic Integration until 2025. URL. http:
https://www.economy.gov.ru/material/directions/makr
oec/prognozy_socialno_ekonomicheskogo_razvitiya/p
rognoz_socialno_ekonomicheskogo_razvitiya_rf_na_p
eriod_do_2024_goda_.html
Pak, Kh.S., Ushakova, E.V., Borisova, T.A. (2020). EAEU
Countries: Assessment of Economic Security,
Economics and Management, 5: 455–463.
Paid services for the population in Russia. Federal State
Statistics Service. - M. 2019.
Forecast of the socio-economic development of the Russian
Federation for the period up to 2024. http:
https://economy.gov.ru/material/file/35693c2d192c17
24a623ce71663edcea/prognoz24svod.pdf.
Garlick, J., Shakhanova, G. (2020). The Belt and Road
Initiative and the Eurasian Economic Union: Exploring
the “Greater Eurasian Partnership”, Journal of Current
Chinese Affairs, 49(1): 33–57.
Knobel’, A. (2019). The Eurasian Economic Union:
Development Prospects and Possible Obstacles,
Russian Social Science Review, 60(2): 137–161.
Malakhova, T.S., Dubinina, M.A., Maksaev, A.A., Fomin,
R.V. (2019). Foreign Trade and Marketing Processes in
the Context of Sustainable Development, International
Journal of Economics and Business Administration, 2:
195202.
Malakhova, T.S., Kolesnikov, N.P. (2019). Trends and
contradictions of the global economy crisis and
transformation of the world financial institutions,
European Journal of Economics and Management
Sciences, Scientific journal, 1: 38-41.
WFSDS 2021 - INTERNATIONAL SCIENTIFIC FORUM ON SUSTAINABLE DEVELOPMENT OF SOCIO-ECONOMIC SYSTEMS
260
