
On the Issue of Studying the Factors of Sustainable Socio-economic
Development: Health Level of Workforce
Karolina Ketova
a
and Daiana Vavilova
b
Department of Applied Mathematics and Information Technologies, Kalashnikov Izhevsk State Technical University,
Studencheskaya Street, Izhevsk, Russia
Keywords: Socio-economic System, Health, Working-age Group Population, Primary and General Morbidity, Disability.
Abstract: Workforce and its quality are the primary factor in ensuring sustainable progressive development in the
modern world. An important rate of the quality of workforce is the health level, since it affects labor
productivity in socio-economic systems. The purpose of this research is to identify dynamics of the health
level of the working-age population and study trends in its development. The numerical analysis of this paper
is carried out on the Udmurt Republic by using primary modern data, reflected in the state statistical
accounting system for the period 2000-2019. Calculations have shown that the health level of the working-
age group of the region’s population has been declining in recent decades. The share of healthy people in the
region in the age group of 15-72 years decreased from 59.8 % in 2000 to 42.1 % in 2019. The share of people
with chronic diseases increased: 33.2 % in 2000 and 48.5% in 2019. The share of people with disabilities in
the total population of the age group 15-72 years increased from 7.0 % to 9.4 %. The trends of changes in the
dynamics of the health level of the working-age population in the region identified and analyzed in the
research indicate a decrease in the rate of positive influence of labor resources on economic dynamics and the
labor market. The analysis indicated that there is a need to create additional conditions to reduce the level of
general morbidity and disability in the region.
1 INTRODUCTION
In the modern conditions of the formation of the
innovative economy of a number of countries, the
high quality of their labor resources is a necessary
factor for sustainable innovative development. The
quality of the workforce is determined by a
combination of factors, such as health, intelligence,
knowledge and skills, and the culture level of the
working person. In recent decades, it is the quality of
labor resources that has a primary impact on the pace
of socio-economic growth (Auzina-Emsina, 2014;
Nakamura et al., 2019; Ketova and Saburova, 2020.).
The funding, allocated for maintaining and improving
the quality of labor resources, is determined by state
policy (Willis et al., 2018). Investment in human
resources is a factor of economic security of the
country. Modern trends in state financing of labor
resources, for example, in the regions of the Russian
a
https://orcid.org/0000-0001-7143-1930
b
https://orcid.org/0000-0002-2161-4402
Federation, are analyzed in papers (Sleptsova and
Ryndina, 2020; Konorev, 2020).
The study of the quality of labor resources from
the point of view of the experience of empirical
testing of complex tools for its mathematical
assessment is considered in researches (Ketova, 2007;
Ketova and Vavilova, 2020; Kalil Moraes et al.,
2021).
As noted above, the quality of workforce is the
health level of the working population. In this paper,
we study the health level of labor resources using the
example of one of the regions of Russia.
The population health state is the greatest value
and benefit, it is importance for socio-economic
growth of society and the practical implementation of
new innovative development paradigms (Roslender
et al., 2012.). The health state determines the
capabilities of a person during labor activity and the
degree of his participation in it (Sinyai and Choi,
2020). A healthy person has the objective possibility
Ketova, K. and Vavilova, D.
On the Issue of Studying the Factors of Sustainable Socio-economic Development: Health Level of Workforce.
DOI: 10.5220/0010664900003223
In Proceedings of the 1st International Scientific Forum on Sustainable Development of Socio-economic Systems (WFSDS 2021), pages 123-129
ISBN: 978-989-758-597-5
Copyright
c
2022 by SCITEPRESS – Science and Technology Publications, Lda. All rights reserved
123

of full self-realization. A healthy person demonstrates
greater work efficiency. Health problems are
obviously limiting the worker.
Investments in health care development reduce
morbidity and mortality rates, and extend the working
period of life. A mathematical analysis of these
processes is presented in researches (Ketova and
Rusyak, 2009; Vavilova and Ketova, 2020).
Since the working-age group of the population
participates in the production of the gross domestic
product, then in the calculations we take the age limit
of 15-72 years. At the same time, juvenile potential is
of great importance for the formation of labor
potential as a social resource for economic
development in the context of a change in the
technological structure in connection with the
innovative economy development (Ilyakova et al.,
2020). It is important to preserve the health of the
younger generation for the possibility of a long and
active life.
2 RESEARCH MATERIALS AND
METHODS
The analysis of the structure and dynamics of the
health level of the working-age group of the
population is carried out on the example of the region
of the Udmurt Republic (UR). According to the state
of health, the population is grouped as follows:
a healthy person;
a person with chronic diseases;
a person with a 3
rd
disability group (capable of
working);
a person with a 2
nd
disability group (partially
capable of working);
a person with 1
st
disability group (incapable of
work).
Let us analyze the structure and dynamics of
general and primary morbidity in the region. Under
the medical classification, the general morbidity is the
sum of primary diseases and diseases accumulated in
previous years (known earlier). Primary diseases are
diseases detected in the current year. Tables 1 and 2
show statistical data on the general and primary
morbidity of the population of the Udmurt Republic
for the period 2000-2019
(http://rmiac.udmmed.ru/inform-analit_materialy).
The general morbidity of the population of the UR
in the working-age group for the period 2000-2019
increased by 33.3% and amounted to 1889.6 diseases
per 1,000 people.
Table 1: General and primary morbidity of the working-age
population of the UR in the 15-72 years-old age group for
the period 2000-2019.
Year
Population in
15-72 age
group,
thousand
p
eo
p
le
General
morbidity
(units per
1,000
p
eo
p
le
)
Primary
morbidity
(units per
1,000
p
eo
p
le
)
2000 1199.12 1417.41 621.71
2001 1239.81 1383.42 570.12
2002 1201.63 1405.61 584.71
2003 1204.41 1537.59 621.32
2004 1204.83 1542.11 606.43
2005 1202.02 1496.13 583.18
2006 1197.44 1526.29 568.59
2007 1189.43 1606.58 589.11
2008 1181.71 1577.77 561.87
2009 1171.72 1688.89 608.41
2010 1161.41 1687.31 612.88
2011 1151.43 1749.11 803.67
2012 1144.09 1713.08 779.51
2013 1138.22 1731.03 817.71
2014 1133.21 1697.62 814.78
2015 1127.59 1711.84 817.31
2016 1122.18 1807.12 864.23
2017 1117.21 1847.18 853.11
2018 1113.78 1825.32 796.86
2019 1108.27 1889.62 811.41
Table 2: Growth rate of general and primary morbidity of
the working-age population of the UR by 2000 for the
period 2000-2019, %.
Yea
r
General morbidit
y
Primar
y
morbidit
y
2000 100.0 100.0
2001 97.6 91.7
2002 99.2 94.0
2003 108.5 99.9
2004 108.8 97.5
2005 105.6 93.8
2006 107.7 91.5
2007 113.3 94.8
2008 111.3 90.4
2009 119.2 97.9
2010 119.0 98.6
2011 123,4 129.3
2012 120.9 125.4
2013 122.1 131.5
2014 119.8 131.1
2015 120.8 131.5
2016 127.5 139.0
2017 130.3 137.2
2018 128.8 128.2
2019 133.3 130.5
For the whole republic, in terms of the total
population aged 15 to 72 years, the general morbidity
WFSDS 2021 - INTERNATIONAL SCIENTIFIC FORUM ON SUSTAINABLE DEVELOPMENT OF SOCIO-ECONOMIC SYSTEMS
124

for the period 2000-2019 changed from a value of
1699.6 thousand diseases to a value of 2094.5
thousand diseases.
An interesting fact is that the primary morbidity
of the working-age population of the UR for period
2000-2019 increased by 30.5% in relation to 2000 and
amounted to 811.4 diseases per 1000 people. In terms
of the population aged 15 to 72 years, the primary
morbidity changed from the value of 745.5 thousand
diseases to the value of 899.2 thousand diseases.
Tables 3 and 4 present statistics of the population
with disabilities, as well as statistics on the internal
structure of this population category for the UR
(https://udmstat.gks.ru/folder/5193,
https://sfri.ru/analitika/chislennost).
Table 3: Statistical data of people with disabilities at the
working-age of 15 to 72 years and in the distribution by
groups of disabilities in the UR for the period 2000-2020.
Year
Total
population
with
disabilities,
thousand
p
eople
where includin
g
,%
3
rd
group
2
nd
group
1
st
group
2000 83.63 29.31 51.67 19.02
2001 86.47 30.09 51.02 18.89
2002 89.04 30.88 50.29 18.79
2003 87.38 31.69 49.58 18.73
2004 86.85 32.48 48.92 18.60
2005 97.74 33,31 48.17 18.52
2006 101.46 34,13 47.48 18.39
2007 104.44 34,88 46.81 18.31
2008 107.38 35.68 46.11 18.21
2009 109.96 36.53 45.38 18.12
2010 111.87 37.32 44.68 18.00
2011 114.41 38.12 44.02 17.86
2012 111.46 38.91 43.29 17.80
2013 115.70 39.70 42.62 17.68
2014 111.23 40.41 42.02 17.57
2015 106.54 41.13 41.33 17.54
2016 108.82 41.79 40.69 17.52
2017 111.77 42.48 40.13 17.39
2018 104.30 43.50 39.22 17.28
2019 100.04 44.40 38.60 17.00
2020 97.54 44.76 38.22 17.02
The working-age population with disabilities
increased in the UR from 83.6 thousand people in
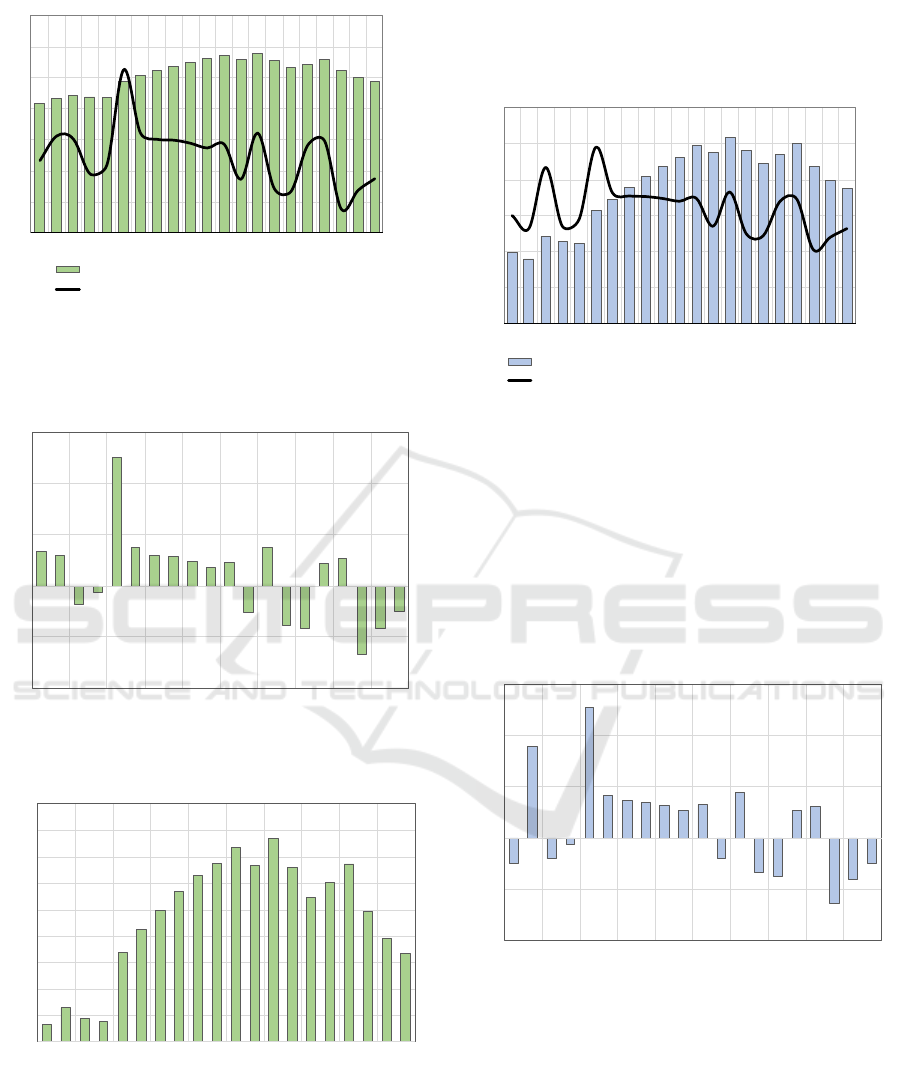
2000 up to 97.5 thousand people in 2020. Figure 1
shows the dynamics of people with disabilities at the
15-72 years in the region and the chain rate of its
growth for the period 2000-2020. The average annual
growth rate of this indicator during the 20-year period
was 0.8%.
Table 4: Statistical data of people with disabilities (per 100
thousand people of the working-age population) and the
chain rate of growth of people with disabilities in the UR
for the period 2000-2020.
Year
Population with
disabilities (per
100 thousand
people of the
working-age
p
o
p
ulation
)
,‰
Chain rate of growth of
p
eo
p
le with disabilities, %
Total
population
Per 100
thousand
people
2000 83.63 100.0 100.0
2001 86.47 103.4 97.6
2002 89.04 103.0 109.0
2003 87.38 98.1 98.0
2004 86.85 99.4 99.3
2005 97.74 112.5 112.8
2006 101.46 103.8 104.2
2007 104.44 102.9 103.7
2008 107.38 102.8 103.5
2009 109.96 102.4 103.2
2010 111.87 101.7 102.7
2011 114.41 102.3 103.2
2012 111.46 97.4 98.0
2013 115.70 103.8 104.4
2014 111.23 96.1 96.6
2015 106.54 95.8 96.2
2016 108.82 102.1 102.6
2017 111.77 102.7 103.1
2018 104.30 93.3 93.6
2019 100.04 95.9 95.9
2020 97.54 97.5 97.6
Figure 2 demonstrates the chain rate of increase
in the people with disabilities at working-age group,
Figure 3 – the basic growth rate in relation to 2000 of
the people with disabilities of working-age group.
The analysis is demonstrated, that the total
increase of population with disabilities of working-
age for 20 years in the UR amounted to 13.9 thousand
people. During this period, changes took place both
upward and downward. The largest jump in the
direction of increase occurred in 2005 (+12.5%), a
sharp decrease of people with disabilities was
observed in 2018 (-6.7%).
There are the indicators characterizing a group of
people with disabilities at working age, calculated for
100 thousand people population of the UR. They
allow for objective spatial and territorial
comparisons.
On the Issue of Studying the Factors of Sustainable Socio-economic Development: Health Level of Workforce
125
90
95
100
105
110
115
120
0
20
40
60
80
100
120
140
2000
2001
2002
2003
2004
2005
2006
2007
2008
2009
2010
2011
2012
2013
2014
2015
2016
2017
2018
2019
2020
Total population with disabilities, thousand people
Chain rate of growth in the total population with disabilities, %
Thousand people
%
Figure 1: Dynamics of population with disabilities at
working-age group in the UR and its chain rate of growth
for the period 2000-2020.
-10
-5
0
5
10
15
2001 2003 2005 2007 2009 2011 2013 2015 2017 2019
%
Figure 2: Chain growth rate of population with disabilities
at working-age group in the UR for the 2000-2020.
0
5
10
15
20
25
30
35
40
45
2001 2003 2005 2007 2009 2011 2013 2015 2017 2019
%
Figure 3: Basic growth rate (relative to 2000) of population
with disabilities at working-age group in the UR for the
2000-2020.
Figure 4 presents people with disabilities per 100
thousand people of the working-age population of the
Udmurt Republic and the chain growth rate of this
indicator for the period 2000-2020. Average annual
growth rate of the number of people with disabilities
per 100 thousand people of the working-age
population in the UR amounted to 1.1%.
80
85
90
95
100
105
110
115
120
50
60
70
80
90
100
110
2000
2001
2002
2003
2004
2005
2006
2007
2008
2009
2010
2011
2012
2013
2014
2015
2016
2017
2018
2019
2020
Population with d is abilities (per 100 tho us an d people), ‰
Chain rate of growth of per 100 thousand people with disabilities, %
‰
%
Figure 4: Dynamics of population with disabilities at
working-age group in the UR per 100 thousand people and
its chain rate of growth for the 2000-2020.
On Figure 5, it shows the chain rate of increase in
the number of people with disabilities per 100
thousand people of working-age group, on Figure 6 –
the chain growth rate in relation to the year 2000 of
the number of people of the working-age group of the
population with disabilities, per 100 thousand people
in the UR.
-10
-5
0
5
10
15
2001 2003 2005 2007 2009 2011 2013 2015 2017 2019
%
Figure 5: Chain growth rate of working-age population with
disabilities per 100 thousand people in the UR for the period
2000-2020.
WFSDS 2021 - INTERNATIONAL SCIENTIFIC FORUM ON SUSTAINABLE DEVELOPMENT OF SOCIO-ECONOMIC SYSTEMS
126
-10
0
10
20
30
40
50
2001 2003 2005 2007 2009 2011 2013 2015 2017 2019
%
Figure 6: Basic growth rate (relative to 2000) of population
with disabilities at working-age group per 100 thousand
people in the UR for the 2000-2020.
For the UR in the period 2000-2020, dynamics of
population with disabilities at working-age per 100
thousand people varied in the range from 68.0‰ to
101.7‰ (see Figure 4). The average value of the
indicator for the period under review was 88.1 ‰.
The largest leap towards an increase in the number of
people with disabilities per 100 thousand people. of
the working-age population in the UR took place in
2005 (+12.8%), and its sharp decrease – in 2018 (-
6.4%) (see Figure 6).
Basic in relation to 2000 growth rate of the
indicator of the number of working-age people with
disabilities per 100 thousand people in the UR, shown
in Figure 6, correlates with the dynamics on Figure 3.
This dynamics of changes in the latter indicator is
influenced by the general decline in the population of
working age in the UR for the period, the graph of
which is based on statistical data
(https://udmstat.gks.ru/folder/51924) (see Figure 7).
1100
1120
1140
1160
1180
1200
1220
1240
1260
2000
2001
2002
2003
2004
2005
2006
2007
2008
2009
2010
2011
2012
2013
2014
2015
2016
2017
2018
2019
Thousand people
Figure 7: Dynamics of the population at working-age group
in the UR for the period 2000-2020.
The change in the internal structure of the
population of the region according to the degree of
disability (disability groups) is shown in Figure 8.
Figure 8: Distribution of population at the working-age
group with disabilities, by the degree of disability, for the
UR for 2000, 2010 and 2020.
The third group of disability presupposes the
ability to work, the second group allows one to
partially participate in the labor process, the first
group of disability indicates the inability to work.
Redistribution takes place between groups. The
proportion of people able to work is increasing. Over
the period 2000-2020, the increase in people able to
work was 2 percentage points.
3 RESEARCH RESULTS
We designate the total population of the region as
;P
the number of healthy people as
H
P
; the number of
people with chronic diseases as
CH
P
; the number of
disabled people as
INV
P
. Based on the data in tables
1-4, the number of healthy population per year
t
is
determined by the formula:
tPtPtPtP
INVCHH
(1
)
Figure 9 shows the final diagram of changes in the
structure of the health level of the working-age
population of the UR for the period 2000-2019
(statistical data on the total population of the region
are currently available only until 2019).
Structural-dynamic analysis of the health level is
presented: the share of healthy people in this age
group 15-72 years has decreased from 59.8% in 2000
to 42.1% in 2019; the share of people with chronic
diseases increased (33.2% in 2000 and 48.5% in
2019). The share of people with disabilities increased
for all groups: from 2.0% to 4.1% for the third
On the Issue of Studying the Factors of Sustainable Socio-economic Development: Health Level of Workforce
127
working group of disability; from 3.6% to 3.7% for
the second partly working group; from 1.3% to 1.6%
for the first non-working group.
0
20
40
60
80
100
2000 2005 2010 2015 2019
59.8
53.9
44.1
47.5
42.1
33.2
38.0
46.3
43.1
48.5
2.0
2.7
3.6
3.9
4.1
3.6
3.9
4.3
3.9
3.7
1.3
1.5
1.7
1.7
1.6
Healthy person, %
Person with chronic disease, %
Person with 3 disability group, %
Person with 2 disability group, %
Person with 1 disability group, %
%
Figure 9: Dynamics of the structure of the UR’s population
at the working-age group according to the health level for
the period 2000-2019.
In general, the share of people with disabilities in
the total 15-72 years’ age group has increased from
7.0% to 9.4%. Thus, for the studied period 2000-
2019, the most significant changes were observed in
the share of healthy people (the annual rate of decline
was 1.9%) and the proportion of people with chronic
diseases (the annual growth rate was 2.1%).
4 DISCUSSION OF THE
RESULTS
In addition to external factors, affecting the health of
the population (ecology, quality of nutrition and
medical care, etc.), there is an important objective
factor – the dynamics of the number of different age
groups. Since human health deteriorates with age, in
older age groups the indicator of the level of health
decreases.
Figure 10 presents the distribution of the UR’s
population by age, for the initial year 2000 and the
final year 2019 of the study period. Thus, in the
working-age group of the population 15-72 years,
over an 18-year period, there is a decrease in the
number in younger ages in the interval 15-27 years,
as well as in the age group 35-51 years. The increase
in the number occurred in the age groups of 27-35
years old and 51-68 years old. As a result, there is a
shift towards an increase in the population in older
ages.
0
5
10
15
20
25
30
35
0 102030405060708090100
Thousand people
Age
15– 72 years
1
2
Figure 10: Density of distribution of the UR’s population
by age: 2000 (1); 2019 (2).
It is possible to assess the relationship between the
health level of the population and age groups based
on the results of correlation analysis. Table 5 shows
the coefficients of linear correlation between these
indicators in the UR for the period 2000-2019.
Table 5: Correlation between the health level of the
population and age groups in the UR for 2000-2019.
Social
group
A
g
e
g
rou
p
s of the
p
o
p
ulation
15-
25
y
ears
26-
35
y
ears
36-
45
y
ears
46-
55
y
ears
56-
72
y
ears
Healthy
p
erson
0.71
*
-0.69
*
0.39 0.38 -0.71
*
Person
with
chronic
disease
-0.67 0.69
*
-0.38 -0.37 0.66
Person
with 3
disability
g
rou
p
-0.79
*
0.81
*
-0.26 -0.57 0.87
*
Person
with 2
disability
g
rou
p
-0.34 0.64 0.74* 0.13 0.24
Person
with 1
disability
group
-0.72
*
0.70
*
-0.46 -0.29 0.89
*
*
significant coefficient at a reliability level of 99%
According to the results of the correlation
analysis, presented in Table 5, it can be seen, that
there is a direct relationship between the structural
dynamics of the population in terms of health and the
age composition of the population:
healthy population share and aged 15-25
population proportion;
share of the population with chronic diseases
and aged 26-35 population proportion;
WFSDS 2021 - INTERNATIONAL SCIENTIFIC FORUM ON SUSTAINABLE DEVELOPMENT OF SOCIO-ECONOMIC SYSTEMS
128

share of the population with 3 disability group
and proportion of the population aged 26-35
and 56-72 years;
share of the population with 2 disability group
and the proportion of the population aged 36-
45;
share of the population with 1 disability group
and the proportion of the population aged 26-
35 and 56-72 years.
An inverse correlation is also visible between:
healthy population share and proportion of the
population aged 26-35 and 56-72 years;
share of the population with 3 and 1 disability
groups and proportion of the population aged
15-25.
5 CONCLUSIONS
Thus, a structural-dynamic analysis of the health level
of the working-age population group as a group, that
actively participates in the labor process of the region,
generates benefits and sets the pace of sustainable
economic growth was carried out. The calculations
were performed using the example of the Udmurt
Republic for the period 2000-2019.
It was found that the health level of the working-
age population decreases: the share of the healthy
population decreased from 59.8% in 2000 to 42.1%
in 2019, the share of people with chronic diseases
increased from 33.2% to 48.5% and the share of
people with disabilities from 7.0% up to 9.4%. At the
same time, the proportion of people able to work in
the 15-72 age group is increasing. Over the period
2000-2019, the increase in people able to work was 2
percentage points.
The trends of changes in the dynamics of the
health level of the working-age population in the
region revealed and analyzed in the paper indicate a
decrease in the rate of positive influence of labor
resources on the economic dynamics and the labor
market. The conducted analysis is indicated the
emergence of the need to create additional conditions
to reduce the level of general morbidity and disability.
It needs to increase the volume of funding for the
health care system in order to expand the scale of
involvement of the population in a healthy lifestyle,
develop a preventive health care system, improve the
availability and quality of medical care.
REFERENCES
Auzina-Emsina, A. (2014). Labor Productivity, Economic
Growth and Global Competitiveness in Post-Crisis
Period, Procedia-Social and Behavioral Sciences, 156:
317-321.
Ilyakova, I., Lizina, O., and Sausheva, O. (2020). Juvenile
Potential as a Social Resource for Economic
Development in the Context of a Change in the
Technological Order, Regionology, 28(4): 638-665.
Kalil, Moraes, R., Fernandes, Wanke, P., Ricardo, and
Faria, J. (2021). Unveiling the Endogeneity Between
Social-Welfare and Labor Efficiency: Two-Stage
NDEA Neural Network Approach, Socio-Economic
Planning Sciences, 101026.
Ketova, K. and Saburova, E. (2020). Addressing a Problem
of Regional Socio-Economic System Control with
Growth in the Social and Engineering Fields Using an
Index Method for Building a Transitional Period,
Advances in Intelligent Systems and Computing.
Software Engineering Perspectives in Intelligent
Systems, pages 385-396.
Ketova, K. (2007). A Mathematical Economic Model of the
Manpower Resource Potential and Cost Characteristics
of Demographic Losses, Expert Syst. Appl., 3(7): 80-94.
Ketova, K. and Vavilova, D. (2020). Modelling a Human
Capital of an Economic System with Neural Networks,
Journal of Physics: Conference Series, 012035.
Ketova, K. and Rusyak I. (2009). Identification and
Forecast of Generalized Indicators of Regional
Economic System Development, Applied
Econometrics, 3: 56-73.
Konorev, A. (2020). Modern Trends of Social Sector
Financing in the Regions of the Central Federal,
Economic and humanitarian sciences, 337(2): 75-84.
Nakamura, K., Sohei, K., and Yagi, T. (2019). Productivity
Improvement and Economic Growth: Lessons from
Japan, Economic Analysis and Policy, 62: 57-79.
Roslender, R., Stevenson, J., and Kahn, H. (2012). Towards
Recognising Workforce Health as a Constituent of
Intellectual Capital: Insights from a Survey of UK
Accounting and Finance Directors, Accounting Forum,
36(4): 266-278.
Sinyai, C. and Choi, S. (2020). Fifteen years of American
construction occupational safety and health research,
Safety Science, 131: 104915.
Sleptsova, E. and Ryndina, T. (2020). State Human Capital
Development Policy in Russia, Economy and Business:
Theory and Practice, 61(3-1): 180-182.
Vavilova, D. and Ketova, K. (2020). Neural Network
Forecasting Algorithm as a Tool for Assessing Human
Capital Trends of the Socio-Economic System,
Economic and Social Changes: Facts, Trends,
Forecast, 13(6): 117-133.
Willis, G., Cave, S., and Kunc, M. (2018). Strategic
Workforce Planning in Healthcare: A Multi-
Methodology Approach, European Journal of
Operational Research, 267(1): 250-263.
On the Issue of Studying the Factors of Sustainable Socio-economic Development: Health Level of Workforce
129
