
Pervasive Hand Gesture Recognition for Smartphones using Non-audible
Sound and Deep Learning
Ahmed Ibrahim
a
, Ayman El-Refai
b
, Sara Ahmed
c
, Mariam Aboul-Ela
d
,
Hesham M. Eraqi
e
and Mohamed Moustafa
f
Department of Computer Science and Engineering, The American University in Cairo, New Cairo, Egypt
Keywords:
Sonar, Gesture Recognition, Convolutional Neural Network, Data Augmentation, Transfer Learning, Feature
Fusion, Doppler Effect.
Abstract:
Due to the mass advancement in ubiquitous technologies nowadays, new pervasive methods have come into
the practice to provide new innovative features and stimulate the research on new human-computer interac-
tions. This paper presents a hand gesture recognition method that utilizes the smartphone’s built-in speakers
and microphones. The proposed system emits an ultrasonic sonar-based signal (inaudible sound) from the
smartphone’s stereo speakers, which is then received by the smartphone’s microphone and processed via a
Convolutional Neural Network (CNN) for Hand Gesture Recognition. Data augmentation techniques are pro-
posed to improve the detection accuracy and three dual-channel input fusion methods are compared. The first
method merges the dual-channel audio as a single input spectrogram image. The second method adopts early
fusion by concatenating the dual-channel spectrograms. The third method adopts late fusion by having two
convectional input branches processing each of the dual-channel spectrograms and then the outputs are merged
by the last layers. Our experimental results demonstrate a promising detection accuracy for the six gestures
presented in our publicly available dataset with an accuracy of 93.58% as a baseline.
1 INTRODUCTION
Scientists are always interested in revolutionizing
human-machine interaction, also known as HMI. As
a result, modern technologies have been introduced
that are often placed in advanced technologies, such
as the LiDAR (Light Detection and Ranging) sensor
in the iPhone 12. These advanced technologies are of-
ten expensive and require the latest technology, often
making them inaccessible to the public.
Our proposed solution is to have an acoustic active
sensing system to classify the various hand gestures a
user can create. The meaning of active sensing is that
the sound signal is emitted and received by the same
smartphone (Wang et al., 2019a). In such a case, the
smartphone’s built-in speakers transmit a sound sig-
nal at a specific frequency and record the changes in
the signal from the hand movement around the smart-
a
https://orcid.org/0000-0003-0898-1096
b
https://orcid.org/0000-0003-1996-3774
c
https://orcid.org/0000-0003-4367-6628
d
https://orcid.org/0000-0002-2998-2197
e
https://orcid.org/0000-0001-9430-7553
f
https://orcid.org/0000-0002-0017-3724
phone based on the Doppler Effect. Generally, for
gesture recognition applications, systems adopt sound
signals with a frequency greater than 16 kHz, as sig-
nals higher than 16 kHz are above the average hu-
man’s audibility (Ensminger and Bond, 2011). Such
signals are referred to as ultrasonic signals. Ultra-
sonic signal has received a lot of attention recently
in many applications due to the following reasons.
Firstly, it has been thoroughly studied and applied
on many applications, as it has good ranging accu-
racy and low-cost deployment. Secondly, ultrasound
is non-audible to human hearing; therefore, it can be
used without interfering with a person’s normal life.
Thirdly, such sound signals are not affected by light-
ing conditions; therefore, the system can work dur-
ing the day or night without interruption, unlike other
sensors, for example, cameras. Therefore, we used an
ultrasonic wave to detect hand gestures.
Additionally, our system records the signal while
simultaneously acting as an active sonar system. By
recording the signals, we apply STFT (Short-time
Fourier transform) on the waveform to convert the
time domain into a frequency domain; hence we can
visualize the hand movement gesture as a Doppler Ef-
310
Ibrahim, A., El-Refai, A., Ahmed, S., Aboul-Ela, M., Eraqi, H. and Moustafa, M.
Pervasive Hand Gesture Recognition for Smartphones using Non-audible Sound and Deep Learning.
DOI: 10.5220/0010656200003063
In Proceedings of the 13th International Joint Conference on Computational Intelligence (IJCCI 2021), pages 310-317
ISBN: 978-989-758-534-0; ISSN: 2184-3236
Copyright © 2023 by SCITEPRESS – Science and Technology Publications, Lda. Under CC license (CC BY-NC-ND 4.0)

fect on the spectrogram. Afterward, we utilize deep
learning techniques to classify hand gestures. We use
different types of CNN models with variations in the
input. However, all CNN models take the input as a
spectrogram. The first model takes the dual-channel
audio as 1 channel image of the spectrogram (Basic
CNN). The second takes two spectrogram inputs, one
as the top microphone and the other as the bottom mi-
crophone, and then the data is concatenated and in-
putted into the model (Early Fusion). The third takes
two spectrograms inputs of the top and bottom chan-
nels as two separate inputs, and then each input is
trained on a different branch then the branches are
merged at the end of the model (Late Fusion).
This paper is organized as follows. Section 2 in-
troduces the previous studies on gesture recognition
using non-audible frequencies and tracking finger po-
sitions. Section 3 discusses the signal generation.
Section 4 explains the data collection and augmen-
tation procedures. Also, it shows the dataset compo-
nents. Section 5 describes the proposed Deep Learn-
ing models. Section 6 shows the results and accura-
cies achieved. Section 6 shows the results of our ex-
periment. Finally, section 7 describes the conclusion
and highlights the future work.
2 RELATED WORKS
Multiple studies have been conducted discussing us-
ing a smartphone’s microphone and speaker to act like
a sonar system. (Kim et al., 2019) propose a sys-
tem that uses two smartphones. One smartphone gen-
erates an ultrasonic wave of 20 kHz, and the other
uses the microphone to pick up the signals transmit-
ted by the first phone. After recording the emitted
sound during performing hand gestures, and based on
the Doppler effect, these recorded signals varied de-
pending on time according to the hand movement or
its position. Such a recorded sound signal is then re-
flected as an image using the short-time Fourier trans-
forms and applied to the convolutional neural network
model (CNN) to classify certain hand gestures. Kim
et al.reached an accuracy of 87.75 percent. As pre-
viously mentioned, the reflected paper demonstrates
hand gesture recognition by using two smartphones,
one as a microphone and the other as a speaker. On
the other hand, our research will concentrate on using
a single smartphone to perform the gesture recogni-
tion process. On the other hand, another technique
named UltraGesture (Ling et al., 2020), avoids the
Doppler Effect methodology in tracking slight finger
motions and hand gestures. Instead, it uses a Chan-
nel Impulse Response (CIR) as a gesture recognition
measurement with low pass and down conversion fil-
ters. In addition, they perform a differential operation
to obtain the differential of the CIR (dCIR). Then the
information is used as the input data. Lastly, as pa-
per (Kim et al., 2019), the authors transform the data
into an image trained in a CNN model. However, in
the experimental phase, the authors added additional
speakers kit on the smartphone, which boomed the ac-
curacy results to an average of 97% for 12 hand ges-
tures.
Another interesting study is AudioGest (Ruan
et al., 2016) which uses one built-in microphone and
speaker in a smartphone. However, it does not rely
on any deep learning model. Instead, it relies on fil-
ters and signal processing. It can recognize various
hand gestures, including directions of the hand move-
ment, by using an audio spectrogram to approximate
the hand in-airtime using direct time interval mea-
surement. Also, it can calculate the average waving
range of the hand by using range ratio and the hand
movement speed by using speed-ratio, (Ruan et al.,
2016). According to the authors, AudioGest is nearly
unaffected by human noise through its denoising op-
eration and signal drifting issues, which were tested
in various scenarios such as in a bus, office, and caf
´
e.
For the results, AudioGest achieves slightly better re-
sults in gesture recognition compared to the former
(Kim et al., 2019) which includes recognition in noisy
environments.
Sonar sensing can also be used as a finger tracking
system. FingerIO (Nandakumar et al., 2016) presents
a finger tracking system to allow users to interact with
their smartphone or a smartwatch through their fin-
gers, even if it is occluded or on a separate plane from
the interaction surface. The device’s speakers emit
inaudible sound waves 18-20 kHz, then the signals
are reflected from the finger and are recorded through
the device’s microphones. For the sake of relevancy,
the research will focus on smartphones only. Finge-
rIO’s operation is based on two stages, transmitting
the sound from the mobile device’s speakers, then
measuring the distance from the moving finger by the
device’s microphone. For the speaker’s part, it uses
Orthogonal frequency division multiplexing (OFDM)
to accurately identify the echo’s beginning to improve
the finger tracking accuracy. For the results, without
occlusions, FingerIO attains an average accuracy of
8mm in 2D tracking. The interactive surface works
effectively (error within 1 cm) within a range of 0.5
m2. Exceeding the range increases the margin of er-
ror to 3 cm. However, in occlusions, the 2D tracking
average accuracy rises to 1 cm. Besides, FingerIO
requires an initial gesture before attempting any ges-
ture to avoid false positives, which worked 95% of
Pervasive Hand Gesture Recognition for Smartphones using Non-audible Sound and Deep Learning
311
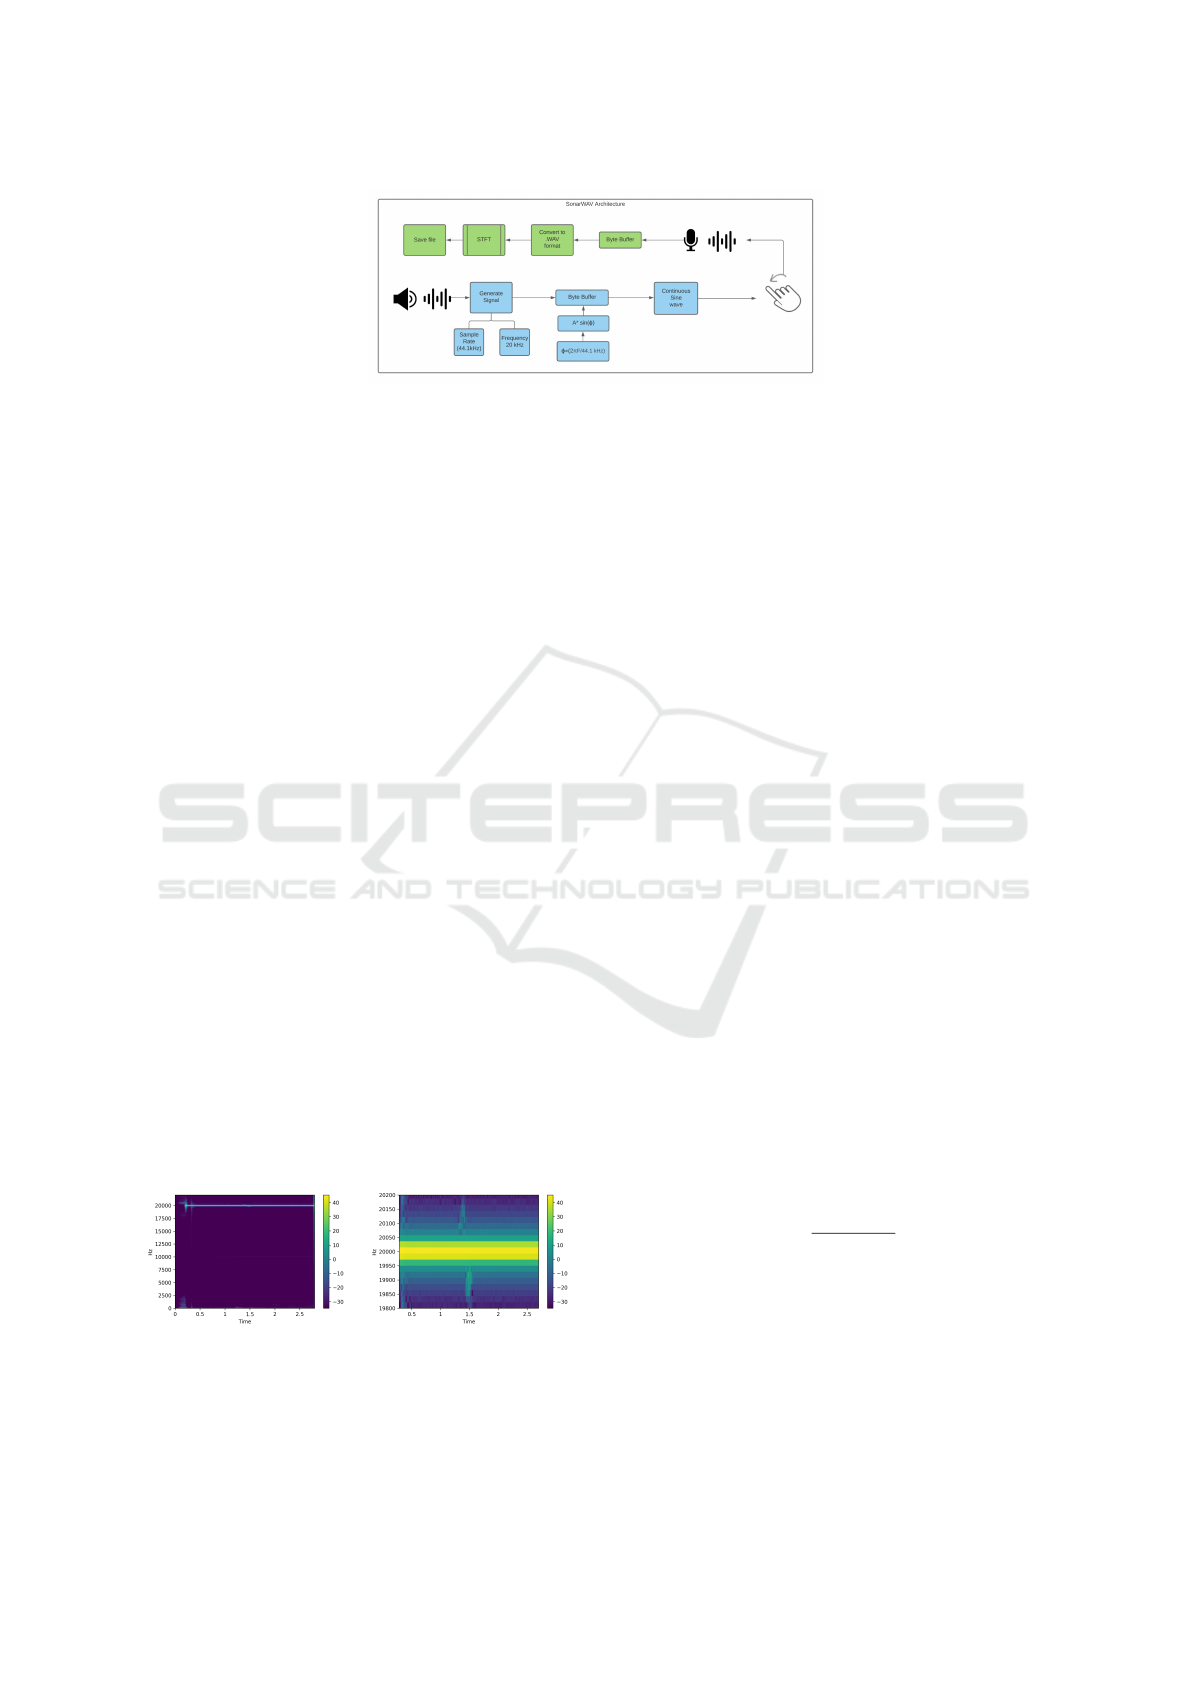
Figure 1: Data-flow Pipeline.
the time. Nevertheless, FingerIO (Nandakumar et al.,
2016) suffers from several limitations such as: Track-
ing multiple concurrent motions, a High margin of er-
ror when interfering within 50cm of the device, and
Tracking 3-D finger motion.
3 SIGNAL GENERATION
3.1 Background
This section provides a concise overview of the pro-
cessing system for recognizing gestures activities us-
ing a smartphone’s ultrasonic signal. In the acous-
tic sensing system, waveform generation plays an im-
portant role because it specifies the signal characteris-
tics. To get the benefit of the design of a good wave-
form, we perform denoising and feature extraction.
Many types of sound signals can be used according to
the characteristics of sound waveforms (Wang et al.,
2019b). We consider three types of sound signals
which are OFDM, Chirp, and CW. The main differ-
ence between the first two is that the OFDM uses fre-
quencies emitted multiple times during a specific time
frame, making it harder to process, and causes the sig-
nal complexity to be quite high. However, the Chirp
signal uses a single frequency from a range of fre-
quencies and keeps increasing linearly. Also, the fre-
quencies in this range should be below 20 kHz; how-
ever, using a frequency below 20 kHz is not adequate
since it will be audible. (Zhou et al., 2017).
(a) Before filtering (b) After filtering
Figure 2: Filtering the spectrogram into a specific frequency
band.
3.2 Continuous Wave
The last type is continuous wave (CW) which is the
signal that we decide to generate. It is much more vul-
nerable to background noises than OFDM and does
not work well with long distances, yet these draw-
backs do not affect our system (More details in sec-
tions 3.3 and 3.4). This wave uses a single frequency
emitted over a period of time. This makes it great
as it does not consume a lot of power and makes the
processing easier. When the transmission energy in
each frequency is reduced, the Signal-to-Noise Ra-
tio (SNR) is also reduced. We have also found that
the CW signal is often consistent with little to no sig-
nal loss and less noise due to the narrower bandwidth
compared to the OFDM. These are all reasons that
lead us to use CW as generated wave signal.
3.3 Signal Generation Procedure
As mentioned, our system uses one smartphone with-
out extra hardware. We utilize both speakers and mi-
crophones at the top and bottom (two emitters and two
receivers). We generated a CW at 20 kHz frequency
and a sample rate of 44.1 kHz using the two speakers
built-in the smartphone (top and bottom) using equa-
tion (1) where F is the frequency (20 kHz) and the
input changes based on the current sample in the au-
dio. Afterward, the output is saved in a buffer and
adjusted to produce 16-bit PCM.
f (x) = sin (F ∗ 2π ∗ x) (1)
f =
f (v + v
o
)
(v −v
s
)
(2)
After the signal is generated, a hand gesture is per-
formed in front of the smartphone. Then a shift is
recorded according to the movement caused by the
Doppler Effect by equation (2), where v
o
represents
the velocity of the observed object (hand) and v
s
rep-
resents the velocity of the source (smartphone). Then
it is recorded by the two built-in microphones in the
smartphone. Figure 1 shows the entire process.
NCTA 2021 - 13th International Conference on Neural Computation Theory and Applications
312
After acquiring the recording audio in .wav file
format, we applied Short-time Fourier transform
(STFT) on the data to display a spectrogram show-
ing the generated frequencies. The STFT frequency
resolution was set as 2048. After acquiring the spec-
trogram, we filtered it to obtain the essential parts for
classifying the gestures. First, we narrowed down the
spectrogram duration from 1.3 to 2.7 seconds. There-
fore our spectrogram image only includes a section
that is 1.4 seconds long. Then, we filtered the fre-
quency band from 19.7 to 20.3 kHz, thus removing
the effect of audible noise without adding a band-pass
filter, as shown in Figures 2a and 2b.
3.4 Noise Tolerance
Looking into the factors that would allow our sys-
tem to be able to tolerate as much noise as possi-
ble. We were able to discern two different types of
noise; high-frequency noise and low-frequency noise.
We’ve defined high-frequency noise as any frequency
over 15 kHz, while low-frequency noise is anything
below that threshold. We aimed to successfully miti-
gate the low-frequency noise so that any background
noise such as talking or movement away from the mi-
crophone would not be able to harm the user’s expe-
rience. We were able to successfully mitigate that by
taking a frequency range of 19 kHz to 23 kHz. That
way we were able to mitigate any of the noise that is
below 19 kHz. We were also able to increase noise
tolerance by using data augmentation with noise in-
jection (More details in section 4.2.1).
4 DATA
4.1 Data Collection
We gathered signal reflections from 6 predetermined
gestures using a Samsung Galaxy S10e smartphone,
each of the gestures generating a different pattern due
to the Doppler Effect. This causes the data collec-
tion to be a lot easier and ensures the integrity of the
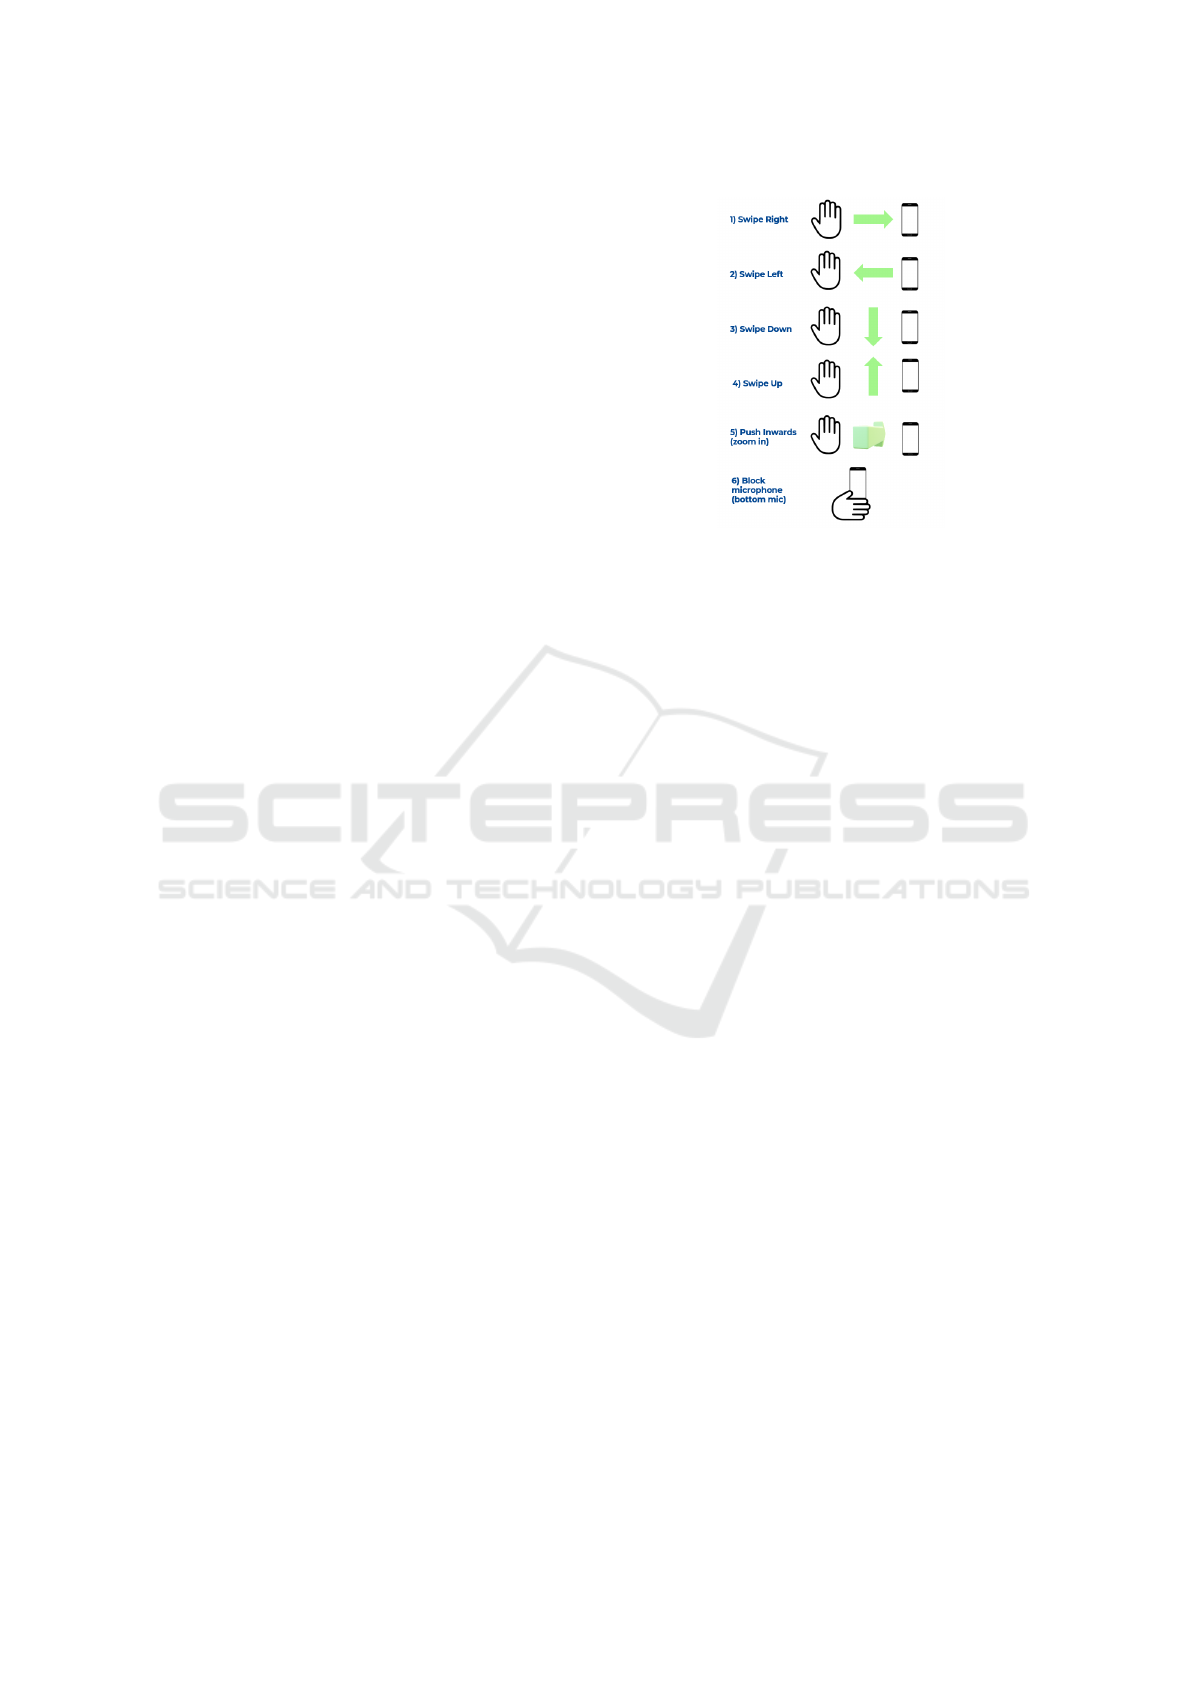
data. The 6 supported gestures are 1) Swipe Right,
2) Swipe Left, 3) Swipe Down, 4) Swipe Up, 5) Push
Inwards, 6) Block the Microphone as in Figure 3. We
recorded the signal reflections as WAV files and had
initially converted each WAV file to a single spectro-
gram. In total, we had 6 types of gestures from 4
separate users, each of which performed 80 gestures
amounting to 1920 collected gestures.
However, upon further investigation, we realized
that the single spectrogram generated from the WAV
Figure 3: The six gestures in spectrogram image. 1- Swipe
Left, 2- Swipe Down, 3- Push Inwards, 4- Swipe Right, 5-
Swipe Up, 6- Block Microphone.
file could be further broken down into two spec-
trograms, one generated from a smartphone’s top
speaker and microphone and the other from the bot-
tom speaker and microphone of the smartphone. We
used the FFmpeg software to help us separate such
data (”Manipulating audio channels”, nd). This ob-
viously doubled our dataset and allowed us to further
experiment with different types of CNN models, as
well as provide better accuracy for our model.
4.2 Data Augmentation
Data augmentation includes several techniques that
improve the size and quality of the training datasets,
allowing them to build better Deep Learning models.
We worked on two different types of data Augmenta-
tion, which are Raw Audio and spectrogram image.
4.2.1 Raw Audio Augmentation
Regarding augmenting the raw audio, we decided to
implement noise injection to test how resistant our
model was to external noises. Also, we apply fre-
quency and time masking to the dataset.
1. Noise Injection: Concerning the noise injection,
We did so by injecting some random value within
a range into the time series data as shown below in
Figure 4. We decided to use such a method as we
found that overlaying two sounds had little effect
on the spectrogram itself, as most audio found on-
line had a lower frequency than the one we were
using.
2. Frequency and Time Masking: Regarding raw
audio manipulation, we also explored the idea of
Pervasive Hand Gesture Recognition for Smartphones using Non-audible Sound and Deep Learning
313
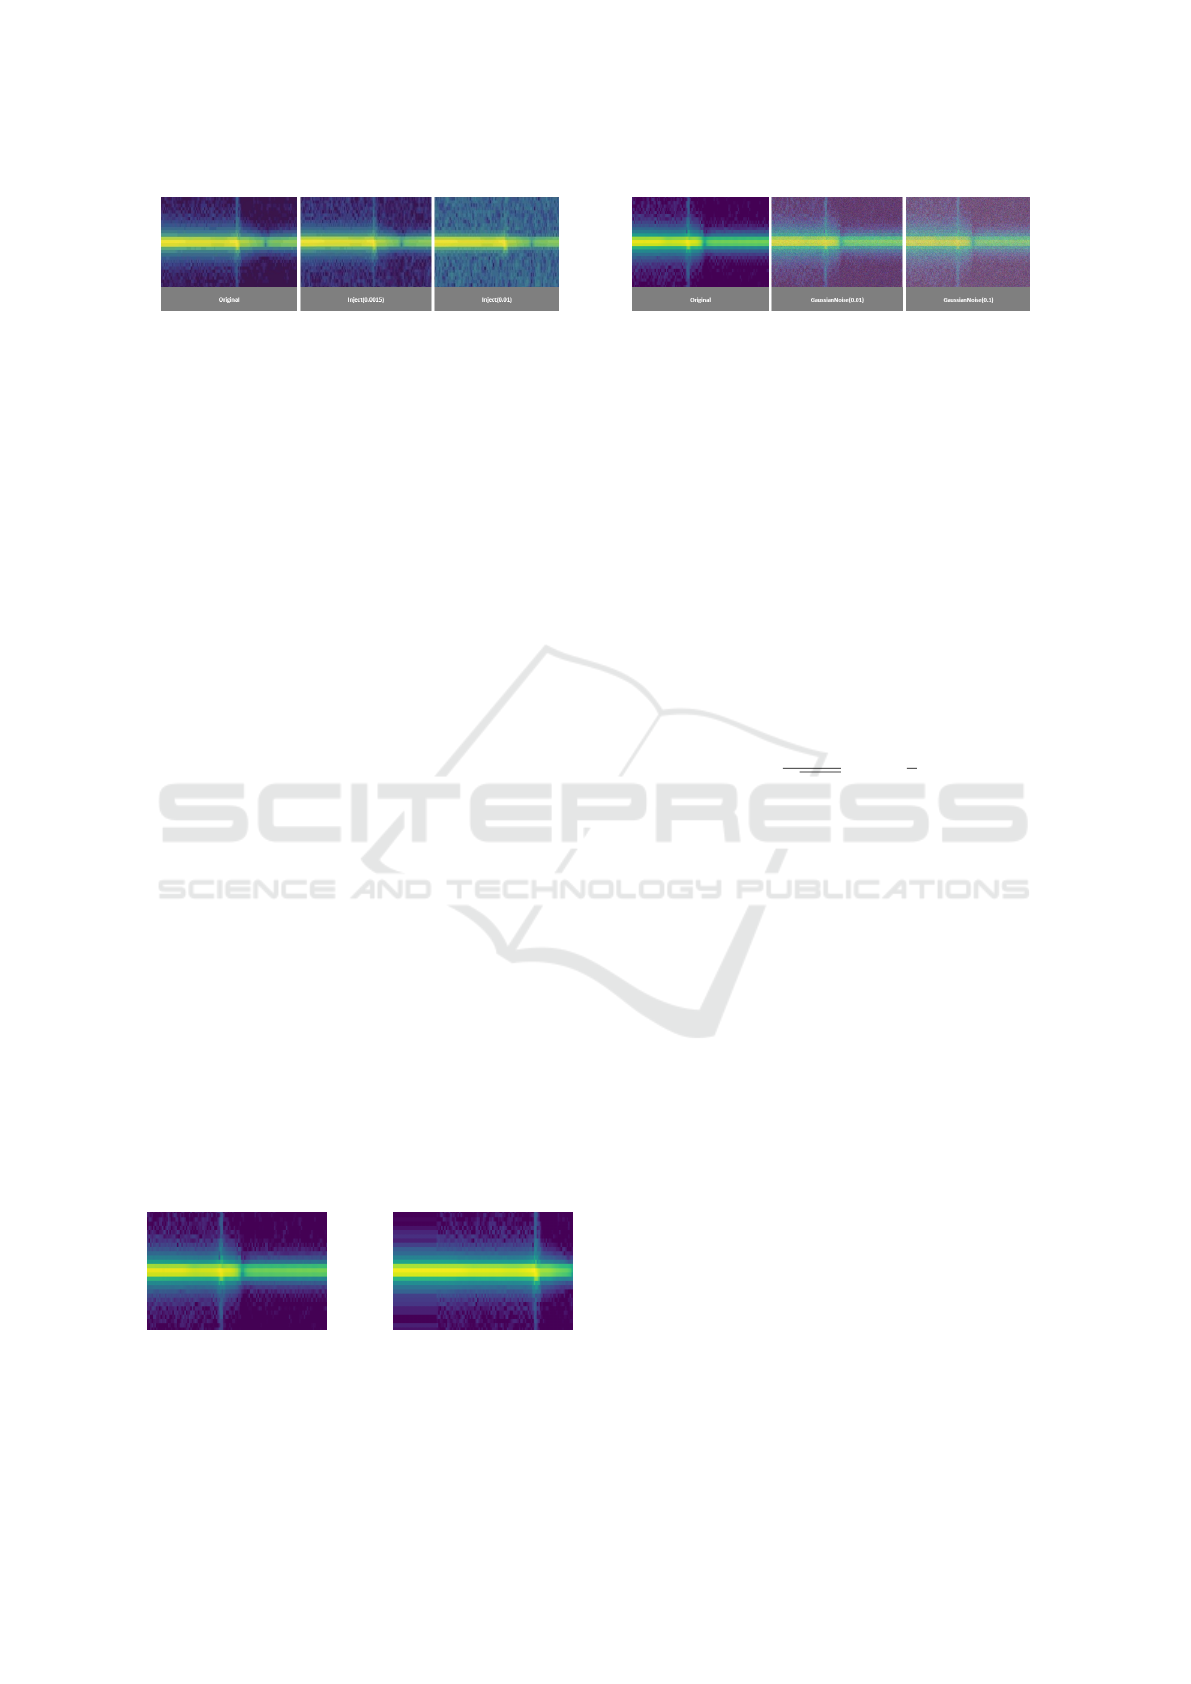
Figure 4: Image After Noise Injection.
adding frequency and time masking to the raw au-
dio provided. We took the raw audio with fre-
quency masking and added a lower frequency that
was much stronger than the one found in our raw
audio. Through that, the stronger and lower fre-
quency will effectively mask our original audio’s
frequency. While this method was great in the-
ory, in practice, it proved to be much more dif-
ficult. The issue was that the frequency gener-
ated was often much lower, even through continu-
ous adjustments. This meant that it did not affect
the original WAV file, and therefore was not in-
cluded in our augmentation process. The same is
true for time masking, but the mask was placed
on the time domain, which was not helpful as we
attempted to identify the change in the frequency
signal.
4.2.2 Spectrogram Images Augmentation
Moving to the data augmentation using spectrogram
images, the image augmentation algorithms discussed
in this section include translation and Gaussian Noise.
1. Translation: shifting images left, right, up, or
down is useful to avoid personal bias in the data.
However, this type is useful if all the images in
the dataset are centered, yet the data can occur at
any part of the image in our dataset. Therefore,
we worried that simple-shifting might destroy the
data as a whole. So, we tried to apply a simple
shift as in Figure 5a compared to the original in
Figure 5b, we only apply random width shifts of
the slandered deviation to avoid cutting the data,
yet it was not very effective. Also, we believe that
large shifts should be more harmful as they could
cut the data.
(a) Example of Original
spectrogram Image
(b) Image After Random
Shift
Figure 5: Difference between original spectrogram image
before and after random shift.
Figure 6: Gaussian Noise.
2. Gaussian Noise: is statistical noise having a
probability distribution function that is equal to
that of the normal distribution. It is also known as
the Gaussian distribution. According to (Arslan
et al., 2019) Gauss, events are prevalent in nature;
while observing random events, which is the sum
of many independent events, all random variables
appear to be Gauss variables. This is the reason
why Gaussian distribution is extremely preferred
in machine learning. Gaussian noise can be ap-
plied to the dataset through this method. First,
we calculate random noise and assign it to the
variable. Then it has been added to the dataset.
To calculate the Gaussian distribution probability
density function using the following formula (3):
N(x : M,σ) =
1
√
2πσ
2
exp
−
1
2
(x −M)
2
/σ
2
(3)
We used the random noise function from the skim-
age package to add the Gaussian noise to augment
the dataset before training the model. The func-
tion requires adding the image, the type of noise
that is Gaussian noise and, the variance of ran-
dom distribution, which is equal to the double of
the stander deviation. So, we tried different values
of variance to obtain clear images with Gaussian
noise. It found that the smaller the variance, the
clearer the image with Gaussian noise, as shown
in Figure 6. Hence, we chose the values of (0.01)
not to damage the spectrogram’s data.
4.3 Dataset
The data were collected in noisy and non-noisy en-
vironments. The noise included sound coming from
the air conditioner, people conversations, and music
as well. The data is divided into an audio file (.WAV)
and spectrogram images. The spectrogram images
were filtered between 19.7 and 20.3 kHz, as this is
the range where the sonar and gesture are shown. It
also removes the noise coming from lower frequen-
cies without needing to use a bandpass filter. More-
over, the data were recorded as a stereo; thus, it con-
tains the two channels of the top and bottom micro-
phone. Additionally, we divide the data into two sets.
NCTA 2021 - 13th International Conference on Neural Computation Theory and Applications
314
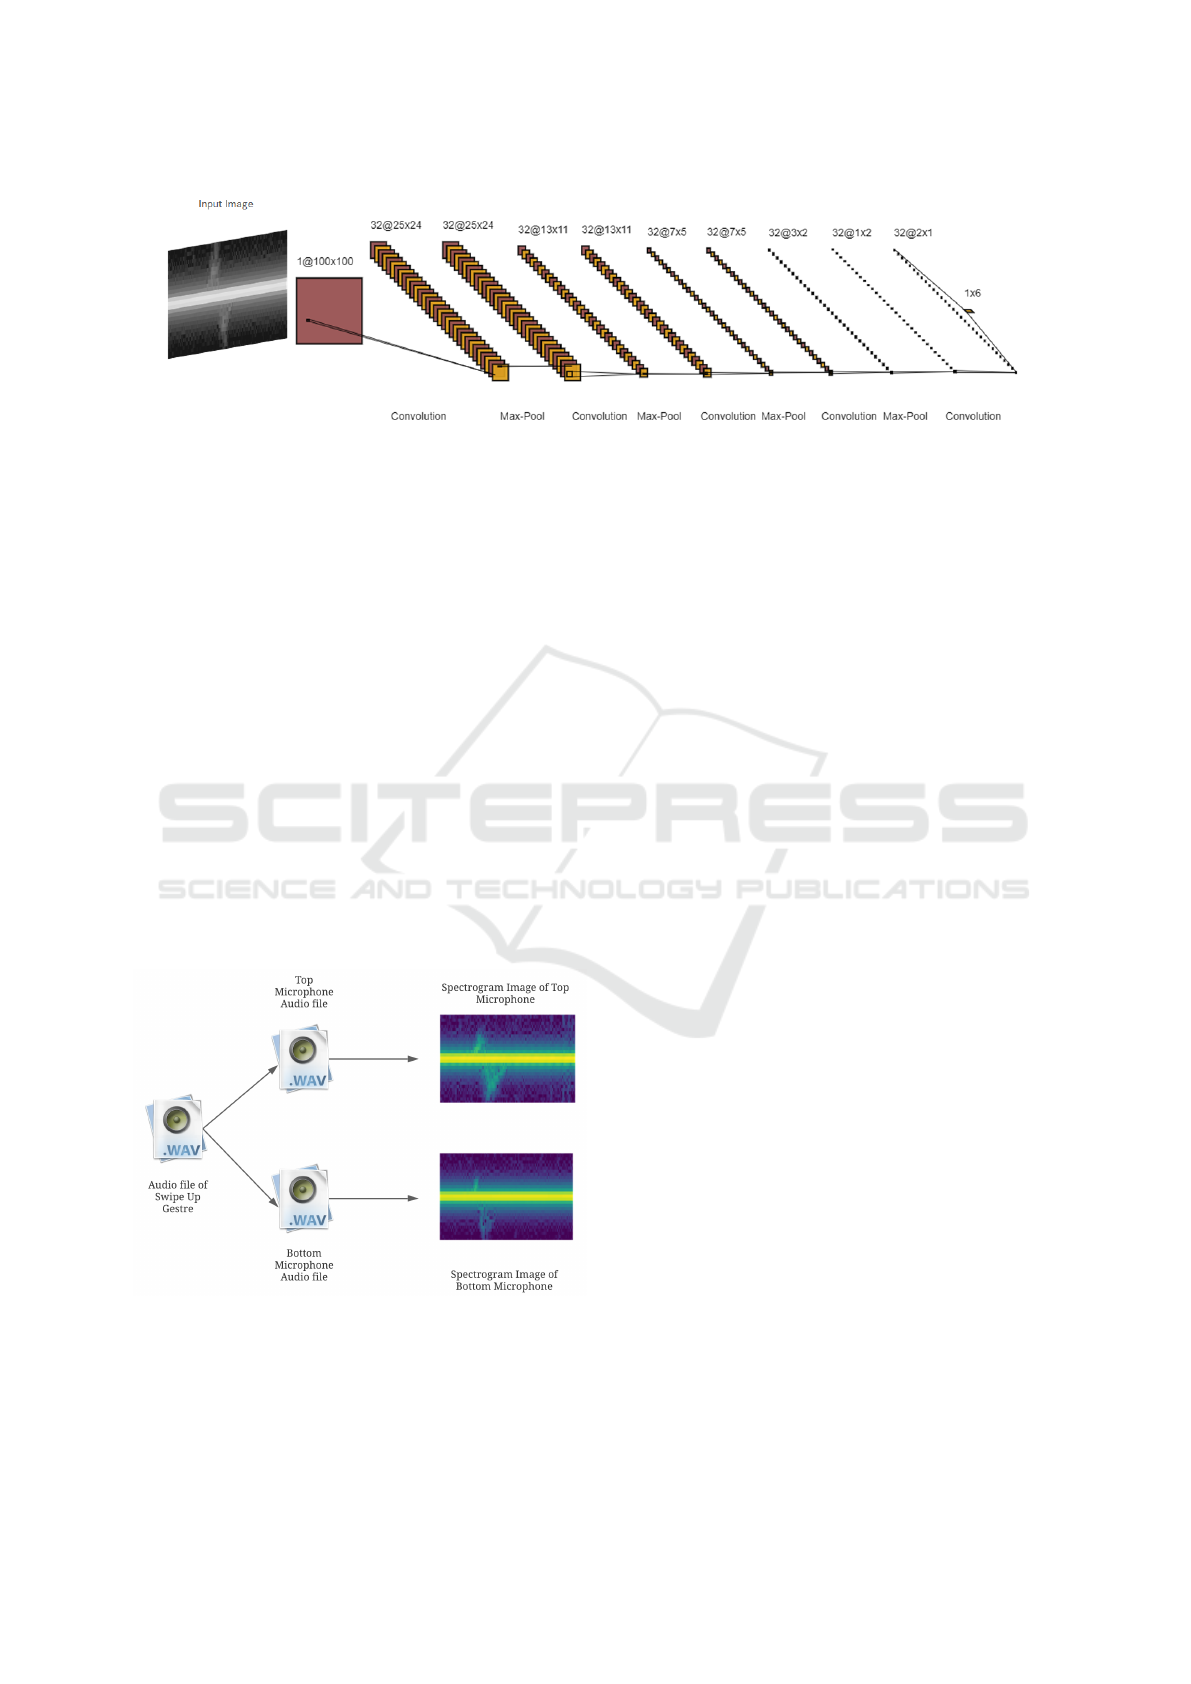
Figure 7: Our original CNN model architecture.
The first set has the recorded stereo file as 1 chan-
nel, and the other having the audio channels separated
for the top and bottom microphone, which will be de-
tailed in section 5.
4.3.1 Training Dataset
The total subjects included in the data collection
phases were 4 subjects to have a total of 1920 train-
ing audio files (.wav) and spectrogram images of such
audio files. This dataset was used in the training and
validation of the CNN models.
4.3.2 Testing Dataset
The testing dataset includes 576 audio files and spec-
trogram images, and 3 subjects collected it (other than
those in the training dataset). The dataset size is 576
because it comprises 30% of the training dataset. This
dataset was used for testing the CNN models.
Figure 8: Separating Audio file into two audio files then
converting the audio to two spectrogram images.
5 DEEP LEARNING MODELS
In this section, we discuss the different CNN mod-
els and approaches we used. First, we created our
model, which was influenced by the literature (Kim
et al., 2019; Ling et al., 2020), And then, we experi-
mented with transfer learning by using different pre-
trained Deep learning models and, we achieved the
best accuracy with the Xception CNN model (Chol-
let, 2017).
Our Model. Our model is comprised of 6 layers.
The input layer is where the image is inserted as
greyscale since the greyscale contained all the needed
information without the need for an RGB image for-
mat. The input shape is an image of dimensions 100
x 100 x 1. Then, the hidden layers include 5 convolu-
tional layers, each followed by a max-pooling layer.
We chose max-pooling since it intensifies the bright
pixels in the image where we are interested in the
spectrogram image. Finally, we use the Softmax ac-
tivation function to classify the gestures into proba-
bilities, and the output is the gesture with the highest
value. The architecture of the model is shown in Fig-
ure 7.
Xception Models. We use the Xception Model cre-
ated by Google (Chollet, 2017). Xception performed
significantly better compared to our Original CNN
Model. We fine-tuned the Xception Model to work
with our dataset, and we used the pre-trained Ima-
geNet dataset since it produced better results than the
untrained Xception model.
There are three approaches for the Xception
Model:
1. The first is the Basic CNN Xception Model. Our
first attempt was to input the spectrogram as an
RGB image due to the nature of the pre-trained
model since the Xception model required the in-
put to be of RGB format. In another attempt, we
Pervasive Hand Gesture Recognition for Smartphones using Non-audible Sound and Deep Learning
315
also inputted the spectrogram image as greyscale.
However, as three channels were required con-
sidering the model takes RGB format, we con-
catenated the same channel three times to have a
grey-scale be a three-channel image to work with
the pre-trained model while keeping the greyscale
color range. The results showed that concatenat-
ing the grey-scale spectrogram image produced
better results than the RGB spectrogram image,
and thus we opted with the grey-scale image in all
our models.
2. The second is the Early Fusion Xception model.
The structure of this model is similar to the Ba-
sic CNN Xception Model, and the difference is
in the input. The input in this model comes from
two sources, the bottom and top microphones. We
separated the audio file into two channels (top
and bottom), and we converted each audio file to
its corresponding spectrogram, as shown in Fig-
ure 8 Hence there are 1920 spectrograms for each
channel. Then we concatenated the top micro-
phone, the bottom microphone, and the default
spectrogram input, which is the spectrogram con-
verted from the stereo .wav without the separa-
tion. Therefore, forming a three-channel image
that we can input into the Xception model. Figure
9shows the design of this model.
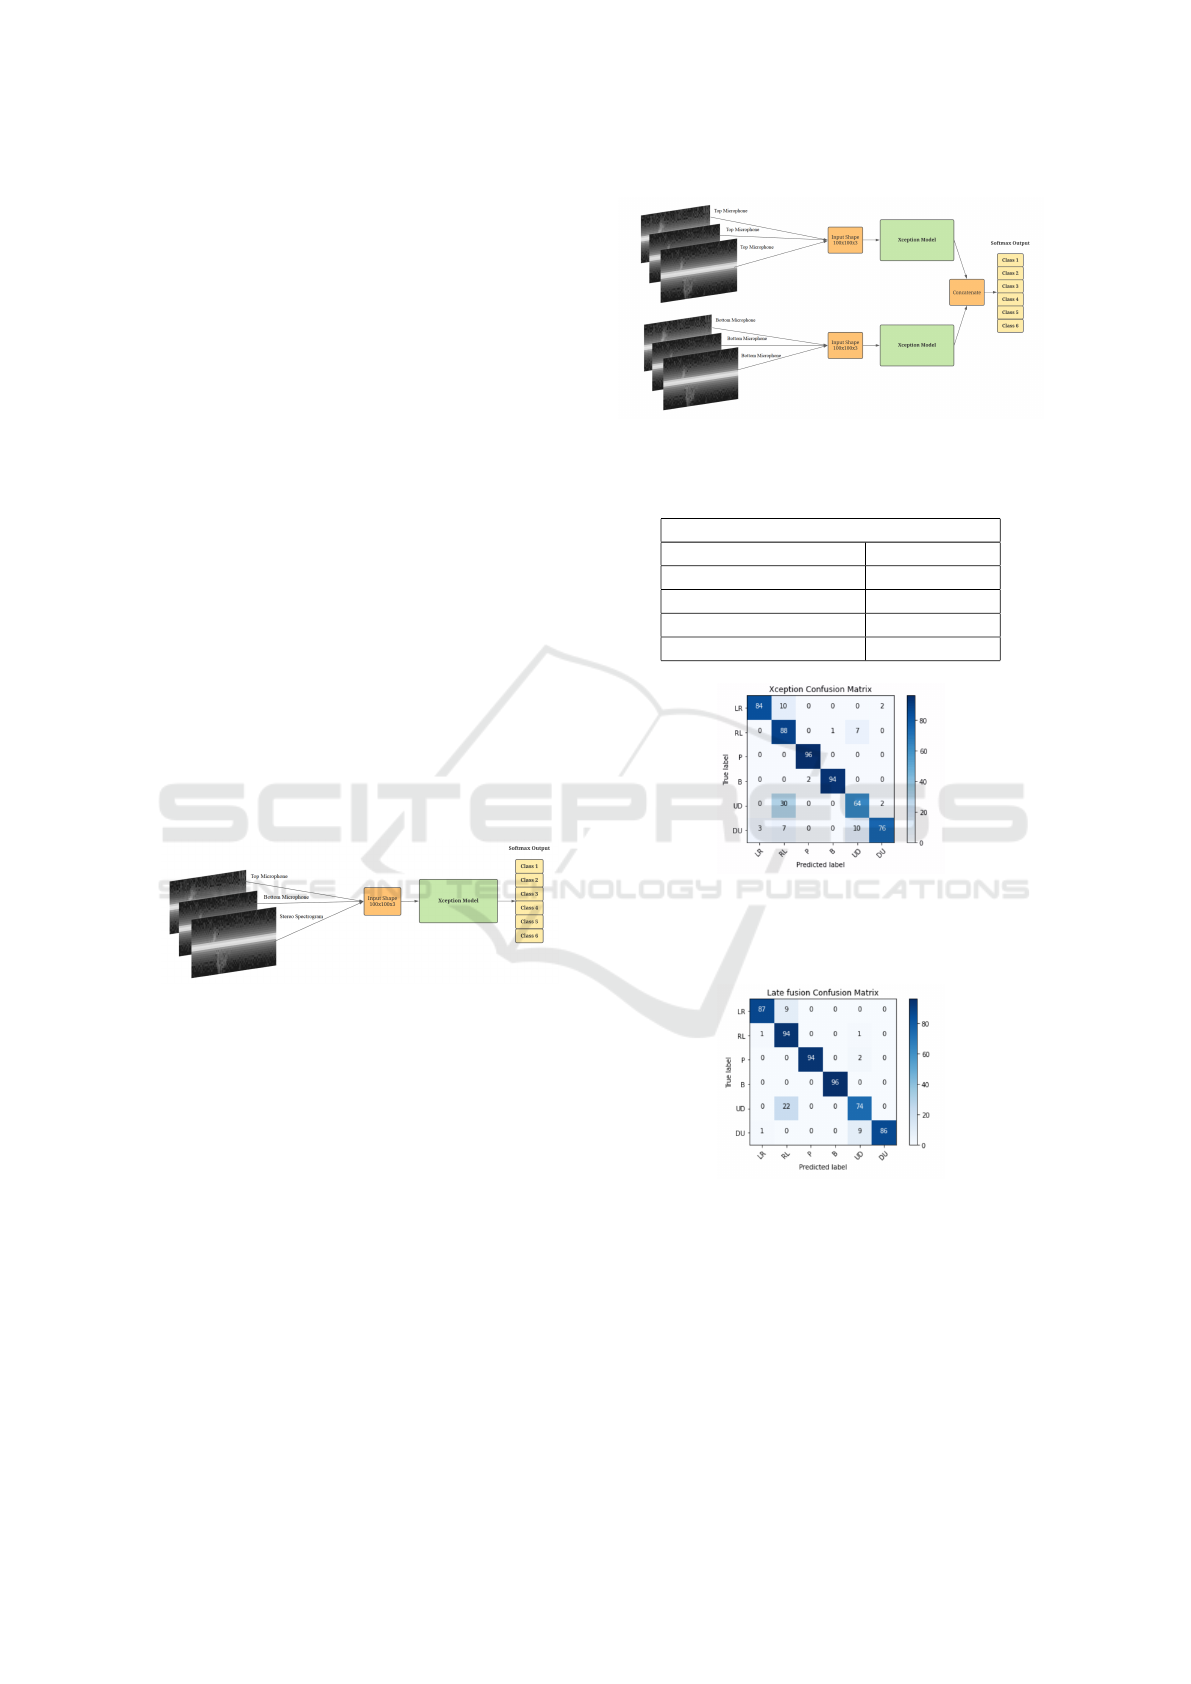
Figure 9: Xception Early Fusion architecture.
3. The third is the Late Fusion CNN model. In this
model, we take the individual spectrogram of the
corresponding top and bottom microphones and
train each separately. We then concatenate the
output of the two models to get the result. For
consistency, we used two Xception models, each
with the input of a three-channel grey-scale, sim-
ilar to the first Xception model mentioned above.
Figure 10shows the design of this model.
6 RESULTS AND DISCUSSION
This section shows the results with different CNN
models by showing the achieved accuracy based on
the testing dataset, which comprises 30% of the orig-
inal training dataset.
Figure 10: Xception Late Fusion architecture.
Table 1: Accuracy (%) of the different models based on our
testing dataset.
CNN Models Results
Model Name Accuracy (%)
Original CNN 81.70
Xception Model 87.15
Xception Late Fusion 92.19
Xception Early Fusion 93.58
Figure 11: Basic Xception Confusion Matrix based on test-
ing dataset. LR: Swipe Right, RL: Swipe Left, P: Push
Inwards, B: Block Microphone, UD: Swipe Down, DU:
Swipe Up.
Figure 12: Late Fusion Xception Confusion Matrix based
on testing dataset.
The results showed that using separating the spec-
trogram for the top and bottom microphone has
achieved higher results than using the combined spec-
trogram for both the top and bottom. This can be
shown through the confusion matrices in Figures 11,
12, and 13, as using top and bottom microphones sep-
arately gave a better differentiation when classifying
the gestures.
NCTA 2021 - 13th International Conference on Neural Computation Theory and Applications
316
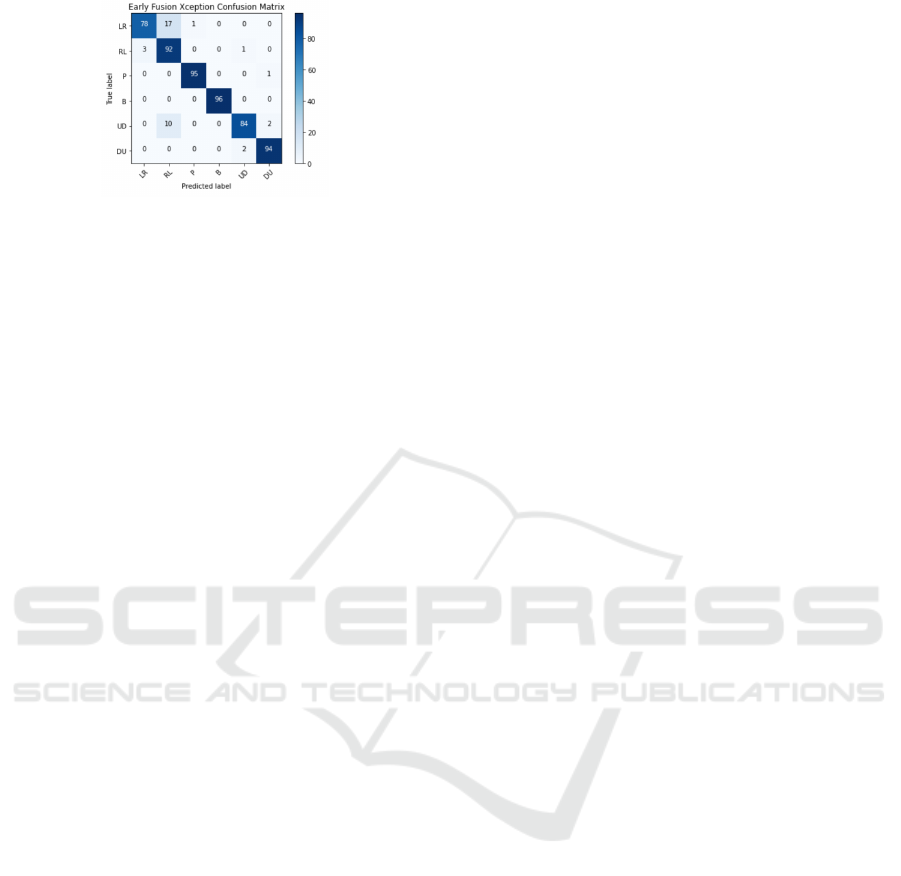
Figure 13: Early Fusion Xception Confusion Matrix based
on testing dataset.
7 CONCLUSION
This paper discusses the techniques used to success-
fully classify hand gestures using inaudible frequen-
cies emitted from a smartphone. Hence, the meth-
ods proposed provide an analysis of the changes that
happen in the frequency over time to classify hand
gestures. Through testing and comparing ,the three
dual-channel input fusion methods provided the best
results compared to the single-channel input method.
The Early Fusion CNN Model produced the best re-
sults compared to the others. It successfully classified
6 hand gestures with an accuracy of 93.58%.
Moreover, separating the audio files into two sepa-
rate channels has shown better results and gives more
space for more gestures where we will leave to our
future work.
DATA AVAILABILITY
Our dataset is publicly available via this
link: https://drive.google.com/drive/folders/
19Me8bCMPyCm1NOr6rk7apOiCOQXLmdqY.
The training and testing data includes 1,920 and
576 audio files and their corresponding spectrogram
images respectively.
ACKNOWLEDGEMENTS
We would like to thank our supervisors for their im-
mense support and help with our project. Also, we
want to thank our volunteers, outside of our team, for
helping in the data collection phase: George Maged,
Andrew Fahmy, Farida El-Refai, and Ali Madany.
REFERENCES
Arslan, M., Guzel, M., Demirci, M., and Ozdemir, S.
(2019). Smote and gaussian noise based sensor data
augmentation. In 2019 4th International Confer-
ence on Computer Science and Engineering (UBMK),
pages 1–5. IEEE.
Chollet, F. (2017). Xception: Deep learning with depthwise
separable convolutions. In Proceedings of the IEEE
conference on computer vision and pattern recogni-
tion, pages 1251–1258.
Ensminger, D. and Bond, L. J. (2011). Ultrasonics: funda-
mentals, technologies, and applications. CRC press.
Kim, J., Cheon, J., and Choi, S. (2019). Hand gesture clas-
sification using non-audible sound. In 2019 Eleventh
International Conference on Ubiquitous and Future
Networks (ICUFN), pages 729–731. IEEE.
Ling, K., Dai, H., Liu, Y., Liu, A. X., Wang, W., and Gu,
Q. (2020). Ultragesture: Fine-grained gesture sensing
and recognition. IEEE Transactions on Mobile Com-
puting.
”Manipulating audio channels” (”n.d.”). Manipulating au-
dio channels.
Nandakumar, R., Iyer, V., Tan, D., and Gollakota, S. (2016).
Fingerio: Using active sonar for fine-grained finger
tracking. In Proceedings of the 2016 CHI Confer-
ence on Human Factors in Computing Systems, pages
1515–1525.
Ruan, W., Sheng, Q. Z., Yang, L., Gu, T., Xu, P., and Shang-
guan, L. (2016). Audiogest: enabling fine-grained
hand gesture detection by decoding echo signal. In
Proceedings of the 2016 ACM international joint con-
ference on pervasive and ubiquitous computing, pages
474–485.
Wang, Z., Hou, Y., Jiang, K., Dou, W., Zhang, C., Huang,
Z., and Guo, Y. (2019a). Hand gesture recognition
based on active ultrasonic sensing of smartphone: a
survey. IEEE Access, 7:111897–111922.
Wang, Z., Hou, Y., Jiang, K., Zhang, C., Dou, W., Huang,
Z., and Guo, Y. (2019b). A survey on human behavior
recognition using smartphone-based ultrasonic signal.
IEEE Access, 7:100581–100604.
Zhou, B., Elbadry, M., Gao, R., and Ye, F. (2017). Batmap-
per: Acoustic sensing based indoor floor plan con-
struction using smartphones. In Proceedings of the
15th Annual International Conference on Mobile Sys-
tems, Applications, and Services, pages 42–55.
Pervasive Hand Gesture Recognition for Smartphones using Non-audible Sound and Deep Learning
317
