
Multidimensional Demographic Profiles for Fair Paper
Recommendation
Reem Alsaffar and Susan Gauch
Department of Computer Science, University of Arkansas, Fayetteville, AR, U.S.A.
Keywords: User Profiling, Paper Recommendation, Diversity and Fairness.
Abstract: Despite double-blind peer review, bias affects which papers are selected for inclusion in conferences and
journals. To address this, we present fair algorithms that explicitly incorporate author diversity in paper
recommendation using multidimensional author profiles that include five demographic features, i.e., gender,
ethnicity, career stage, university rank and geolocation. The Overall Diversity method ranks papers based on
an overall diversity score whereas the Multifaceted Diversity method selects papers that fill the highest-
priority demographic feature first. We evaluate these algorithms with Boolean and continuous-valued features
by recommending papers for SIGCHI 2017 from a pool of SIGCHI 2017, DIS 2017 and IUI 2017 papers and
compare the resulting set of papers with the papers accepted by the conference. Both methods increase
diversity with small decreases in utility using profiles with either Boolean or continuous feature values. Our
best method, Multifaceted Diversity, recommends a set of papers that match demographic parity, selecting
authors who are 42.50% more diverse with a 2.45% gain in utility. This approach could be applied during
conference papers, journal papers, or grant proposal selection or other tasks within academia.
1 INTRODUCTION
We are living in the 21st century and the modern world
is a very diverse world that asks us to strive to break
down barriers to inclusion. However, there is still
discrimination against people because of their race,
color, gender, religion, national origin, disability or
and age (Sugarman et al., 2018). Within the United
States, these groups may receive legal protection but
they can still face the problem of discrimination
throughout society and academia is no exception
(“Protected group”, 2020; eeoc, n.d.). For example, a
study shows that only 38% of tenure-track positions
were awarded to women (Flaherty, 2016). The
situation in Computer Science is very similar and we
are a long way from achieving diversity.
(“ComputerScience, 2021) and (Code.org, 2020)
document the fact that, of the graduates from
Computer Science, only 18% are women and also only
18% are minorities. These statistics are reflected in the
lack of diverse speakers at Computer Science
conferences. These demographic imbalances are also
evident in conference attendees where minorities are
underrepresented (Jones et al., 2014). Racial, gender
and other types of discrimination among reviewers,
editors and program committee might lead to bias in
choosing papers for publishing (Murray et al., 2019).
As an example, SIGCHI, one of the highest impact
ACM conferences, announced that its goal for 2020 is
increasing the diversity of its Program Committee
(SIGCHI, 2019). Merely using a double-blind review
process fails to solve the problem of discrimination
(Cox and Montgomerie, 2019; Lemire, 2020).
Computer Science and Physics are two young fields
that promote sharing and openness among researchers
(i.e. publishing on e-print or electronic journals), so it
is very easy to infer the authors in these fields even
when using double-blind review (Palus, 2015).
Reviewers can frequently guess who the authors are,
so the review process is not actually double-blind
(Barak, 2018). Several studies have identified specific
demographic features that can be a source of bias and
we use these features to model the authors in our data
set. The features most frequently identified are Gender,
Ethnicity (Cannon et al., 2018), Career Stage (Lerback
and Hanson, 2017), University Rank (Flaherty, 2018)
and geolocation (Jacob and Lefgren, 2011). Our
approach is based on building a profile for each paper
that reflects the paper’s overall quality and also models
the diversity of the paper authors. Our fair
recommender system then uses this multi-faceted
profile to recommend papers for inclusion in the
Alsaffar, R. and Gauch, S.
Multidimensional Demographic Profiles for Fair Paper Recommendation.
DOI: 10.5220/0010655800003064
In Proceedings of the 13th International Joint Conference on Knowledge Discovery, Knowledge Engineering and Knowledge Management (IC3K 2021) - Volume 1: KDIR, pages 199-208
ISBN: 978-989-758-533-3; ISSN: 2184-3228
Copyright
c
2021 by SCITEPRESS – Science and Technology Publications, Lda. All rights reserved
199

conference balancing the goals of increasing the
diversity of the authors whose work is selected for
presentation while minimizing any decrease in the
quality of papers presented.
In this paper, we present two fair recommendation
algorithms that balance two aspects of a paper, its
quality and the authors’ demographic features, when
recommending papers to be selected by the conference.
Because information about the review process is
generally confidential, we simulate the results of the
review process by creating pools of papers from related
conferences within a specific field that have different
impact factors. The highest impact factor conference
papers will play the role of the papers that are rated
most highly by the reviewers, the middle impact factor
conference papers those with the second best reviews,
and papers published at the conference with the lowest
of the three impact factors will be treated as papers
with lower reviews. Our main contributions in this
work are:
Modelling author demographics using profiles that
contain multiple demographic features.
Developing and evaluating fair recommendation
algorithms for paper selections that balance quality
and diversity.
Achieving demographic parity between the
accepted authors with the pool of all authors.
2 RELATED WORK
We begin by discussing aspects of bias in academia,
then we review previous work on the construction of
demographic profiles for users. Finally, we summarize
recent approaches to incorporate fairness in
algorithmic processes.
2.1 Bias
Bias in Academia: Bias is an area of concern within
academic fields. Bias in research can be seen when
preferring one outcome or result over others during the
testing or sampling phase, and also during any research
stage, i.e., design, data collection, analysis, testing and
publication (Pannucci and Wilkins, 2010). Bornmann
and Daniel (2005) discuss the evidence that gender,
major field of study, and institutional affiliation caused
bias in the committee decisions when awarding
doctoral and post-doctoral research fellowships.
Flaherty (2019) conducts a study to investigate
discrimination in the US college faculty focusing on
ethnicity. The results showed that the proportion of
black professors is only 6% of all professors compared
to white professors’ percentages which are 76%.
Bias in Peer Review: Several papers have studied the
effects of peer review on paper quality and looked for
evidence of bias (Sikdar et al., 2016). The lack of
fairness in the peer review process has a major impact
on accepting papers in conferences. (Murray et al.,
2019) indicates that bias is still involved in the peer
review and the reviewers tend to accept the papers
whose authors have the same gender and are from the
same region. Double-blind reviews do not entirely
solve this issue and some researchers demonstrate that
bias still exists in the reviewing process. For example,
Cox and Montgomorie (2019) concludes that the
double-blind review did not increase the proportion of
females significantly compared with the single-blind
review.
2.2 Fairness
Demographic Profiling: User profiling can be used to
understand the users’ intentions and develop
personalized services to better assist users (Gauch et
al., 2007). Recently, researchers are incorporating
demographic user profiles in recommender systems
hoping to limit unfairness and discrimination within
the recommendation process (Labille et al., 2015;
Farnadi et al., 2018). Within academia, the
demographic attributes of age, gender, race, and
education are widely used and researchers often infer
these features from the user’s name (Chandrasekaran,
et al., 2008; Santamaría and Mihaljević, 2018).
Demographic Parity: The protected groups have been
targets of discrimination and it is important that people
and algorithms make fair financial, scholastic, and
career decisions. To avoid bias, it is not enough to just
ignore protected attributes while making a decision
because it is often possible to predict these attributes
from other features. To achieve fairness, many
approaches aim for demographic parity, which is when
members of the protected groups and non-protected
groups are equally likely to receive positive outcomes.
However, this requirement generally causes a decrease
in utility. Yang and Stoyanovich (2017) focuses on
developing new metrics to measure the lack of
demographic parity in ranked outputs. (Zehlike et al.,
2017) and (Zehlike and Castillo, 2020) address the
problem of improving fairness in the ranking problem
over a single binary type attribute when selecting a
subset of candidates from a large pool while we work
with multiple features at the same time. It maximizes
utility subject to a group fairness criteria and ensuring
demographic parity at the same time. We extended
these works by using multiple attributes when picking
a subset of authors from the pool to achieve
demographic parity. We also incorporated the diversity
KDIR 2021 - 13th International Conference on Knowledge Discovery and Information Retrieval
200

and the quality of the authors during the selection
process to minimize the utility loss and maximize the
diversity.
Fairness in Machine Learning: As we rely more and
more on computational methods to make decisions, it
is clear that fairness and avoidance of bias in
algorithmic decisions are of increasing importance.
Many investigations show that machine learning
approaches can lead to biased decisions and those
limitations of the features related to the protected
group are another reason (Dwork et al., 2012). Thus,
researchers are working to improve classifiers so they
can achieve good utility in classification for some
purpose while decreasing discrimination that can
happen against the protected groups by designing a
predictor with providing suitable data representation
(Hardt et al., 2016; Zhong, 2018).
Paper Assignment Fairness: Some researchers have
explored and measured fairness when choosing a
suitable reviewer to review a paper. (Long et al., 2013)
and (Stelmakh et al., 2019) focus on fairness and
statistical accuracy in assigning papers to reviewers in
conferences during the peer review process. Most of
these studies propose methods to improve the quality
of the reviewer assignment process. We contribute to
this area by creating author profiles with multiple
demographic features and using them in new fair
recommendation algorithms to achieve demographic
parity when selecting papers for inclusion in a
conference.
3 DEMOGRAPHIC PROFILE
CONSTRUCTION
We first build a demographic profile for each paper by
modeling the demographic features for the paper’s
authors so that this information is available during
paper selection. Some demographic features are
protected attributes, e.g., gender, race, that qualify for
special protection from discrimination by law (Inc. US
Legal, n.d.). In this section, we will describe how we
collect the demographic features for each author in our
papers pool and then how we build the paper profile.
3.1 Data Extraction
For a given paper, our goal is to extract five
demographic features that are Gender, Race,
University Rank, Career Stage, and Geolocation for its
author(s) then combine them to create a profile for the
paper. Each feature is mapped to a Boolean value,
either 1 (true) or 0 (false) based on that paper’s
author(s) membership in the protected group. We then
extend our approach beyond current approaches by
modeling demographics with continuous-valued
features (each feature is mapped to a value between 0
and 1) to represent the complement of the proportion
of each feature among computer science professionals.
Gender and Ethnicity: To gather information about
an author’s gender and ethnicity, we use the NamSor
API v2, a data mining tool that uses a person’s first and
last names to infer their gender and ethnicity (blog,
NamSor, 2018). This tool returns ethnicity as one of
five values: {White, Black, Hispanic, Asian, other}
(blog, NamSor, 2019). After collecting these features,
we map them to 1 (females and non-white) and 0
(males and white) or to the complement of their
participation in computer science to get the continuous
values (Zweben, and Bizot, 2018) (Data USA, 2020).
Career Stage: In order to extract the academic
position for each author, we utilize the researcher’s
Google Scholar pages (Google Scholar,2020) or their
homepages. Researchers whose primary appointment
is within industry are omitted from our data set. The
results are then mapped to Boolean values, 0 if they are
a senior researcher (Distinguished Professor,
Professor, Associate Professor) and 1 if they are a
junior researcher (Assistant Professor, Postdoc,
Student). To calculate the continuous values for this
feature, we map to six values equally distributed
between [0, .., 1.0] in increasing order by rank, i.e.,
Distinguished Professor: 0/5 = 0.0; Professor: 1/5 =
0.2; ...; Student: 5/5 = 1.0. University Rank and
Geolocation: Collecting these features is done by
extracting the institution’s name from the Google
Scholar page for the author (Google Scholar,2020) or
their home pages and mapping it to the World
University Rankings obtained from (Times Higher
Education, 2020). We partition the authors into low-
rank (1) or high-rank institutions (0) using the median
value. Then, we normalize the raw value to a
continuous value by dividing the university rank (U
)
by the lowest university rank (L
):
𝑅
=
(1)
The Geolocation Boolean value is assigned to 0 if the
institution is in a developed country and 1 if in a
developing country using the tables in (Nations, 2020).
For those who live in the US, we use the EPSCOR
(Established Program to Simulate Competitive
Research) (National Science Foundation, 2019) to map
the Geolocation to Boolean values. We then use the
complement values of Human Development Index
(HDI) ranking to get the continuous values (Human
Multidimensional Demographic Profiles for Fair Paper Recommendation
201

Development Report, n.d.). H-index: We extract the h-
index for each author from their Google Scholar page
so we can measure the conference utility in our
evaluation. If the author doesn’t have a scholar page,
we obtain their h-index using Harzing's Publish or
Perish tool. This software calculates the h-index for the
scholar using some impact metrics. (Harzing, 2016).
3.2 Paper Profile Formation
We construct the demographic profile for each paper
by combining the demographic profiles for all of the
paper authors. Recall that each author has a Boolean
value profile and a continuous value profile.
Boolean: The paper profile is created by doing a bit-
wise OR on the paper’s author profiles. Thus, the paper
profile is 1 for a given demographic feature when any
author is a member of that feature’s protected group.
We considered summing the author profiles, but this
would give preferential treatment to papers with more
authors and normalizing the summed profile would
penalize papers with many authors.
Continuous: The paper’s demographic profile is
created by selecting the maximum value for each
feature among the paper authors’ profiles.
3.3 Paper Quality Profiler
There are several ways to measure a paper’s quality
such as the number of citations of the paper, the
reputation of the editorial committee for the
publication venue, or the publication venue’s quality
itself, often measured by Impact Factor (IF)
(Bornmann and Daniel, 2009). Although the IF is not
accurate for new venues that contain high quality
papers with few citations, we use it as the basis of the
quality profile for the papers in our research since the
conferences in our dataset are all well-established
(Zhuang, Elmacioglu, Lee, and Giles, 2007). We
extract the Impact Factor (IF) for each paper’s
conference from Guide2Research website published in
2019 (Guide2Research, 2019). The IF was calculated
by using Google Scholar Metrics to find the highest h-
index for the published papers in the last 5 years.
(Google Scholar, n.d.).
3.4 Pool Distribution
When applying our proposed methods as described
below, we rely on reaching demographic parity during
accomplishing our goal. This means that we select the
papers such that the demographics of the accepted
authors match those of the pool of candidates. To
achieve this, we measure the proportion of participants
for each feature in the pool and store them in a vector
(PoolParity).
PoolParity=<GenderWt,EthnicityWt,CareerWt,UniversityWt,GeoWt >
where each weight is the number of authors from that
protected group normalized by the number of authors
in the pool.
4 APPROACHES
The next goal is maximizing the diversity of the
conference by applying two different methods to select
papers with respect to each features’ distribution in the
pool and achieving demographic parity. The reason is
to get a list of papers that have more diverse people in
the high rank conferences while keeping the level of
quality the same or with a little drop.
Algorithm 1: Overall Diversity.
1 𝑄𝑞uality, 𝑄𝑑emog ← Initialize two empty priority queues
2 PoolParity ← Initialize an empty vector
3 𝑄𝑞 ← insert the papers and sort them based on Quality-
Scores
4 for each feature:
5 PoolParity feature ← compute Demographic Parity
6 for each paper:
7 PDScore ← compute paper diversity score
8 add paper to 𝑄𝑑emog and order them using PDScore
9 If 2 or more papers have same PDScore:
10 Sort papers using Quality-Score
11 while PoolParity Not satisfied:
12 Papers ← select a paper from top of 𝑄𝑑emog
13 delete selected paper from 𝑄𝑞uality
14 while # of conference papers not satisfied:
15 Papers ← select a paper from top of 𝑄𝑞uality
4.1 Overall Diversity Method
After creating paper demographic profiles as described
in section (3), paper diversity scores (PDScore) are
calculated using formula (2) on the feature values:
PDScore =
∑
𝑓
(2)
where 𝑓
is the value for each paper’s demographic
feature (i.e., five features for each paper). Our first
method to choose a diverse list of papers considers two
different queues. The quality queue (𝑄𝑞uality) which
contains the papers ranked by the Impact Factor (IF) as
described in Section 3. This gives preference to the
papers ranked highest by the reviewers, in our case
represented by papers that appeared in the most
selective conference. The demographic queue
(𝑄𝑑emog) which contains the ranked papers by
KDIR 2021 - 13th International Conference on Knowledge Discovery and Information Retrieval
202

PDScore. Next, we pick papers from the top of
(𝑄𝑑emog) until satisfying the pool demographic parity
for each feature then the remaining papers are added
from the quality queue in order to meet the number of
papers desired by the conference. Thus, as long as there
are sufficient candidates in the pool, we are guaranteed
to meet or exceed demographic parity for each
protected group.
Algorithm 2: Multi-Faceted Diversity.
1 FeatureName ← List of ive queue names, one per feature
2 for each feature in FeatureName:
3 DivQueuefeature ← Initialize empty priority queue
4 𝑄ualityQueue ← Initialize an empty priority queue
5 PoolParity ← Initialize an empty vector
6 𝑄ualityQueue ← insert papers and sort by Quality-Score
7 for each feature in FeatureName:
8 PoolParity feature ← compute Demographic Parity
9 for each paper:
10 PDScore ← compute paper diversity score
11 for each feature in FeatureName:
12 DivQueuefeature ← add paper if this feature is 1
13 Sort papers based on Quality-Score
14 If 2 or more papers has the same Quality-Score:
15 Sort papers using PDScore
16 while PoolParity NOT empty:
17 LowFeature ← min PoolParity
18 while LowFeature Not reached demographic parity
19 Papers ← select top DivQueueLowFeature
20 delete selected paper from 𝑄ualityQueue
21 delete LowFeature from DParity
22 while # of conference papers not satisfied:
23 Papers ← select a paper from top of 𝑄ualityQueue
4.2 Multi-Faceted Diversity Method
The previous method selects papers based on the total
diversity score for each paper. However, it does not
guarantee that the selected authors from the protected
groups are actually diverse. It might end up selecting
papers that have high diversity scores but are all
females from developing countries, for example, with
no minority authors at all. To correct for this
possibility, we extend the previous approach by
creating five ranked queues (one per feature) and
sorting the papers using one demographic feature at a
time. In addition to the quality-ranked queue, we now
have six queues total. Based on the pool demographics,
we give the highest priority to the rarest features in the
pool first, so we create the accepted papers list by
selecting papers from the queues whose features have
the fewest candidates in the pool until the demographic
parity goal for those features is achieved. After
satisfying demographic parity for all protected groups,
the remaining papers are added in order from the qua-
lity queue.
5 EXPERIMENT AND RESULT
We now introduce our dataset and describe the process
of evaluating our algorithms.
5.1 Datasets
For our driving problem, we focus on selecting papers
for a high impact computer science conference from a
pool of papers that vary in quality and demographics.
To create pools of candidate papers that simulate the
papers submitted to a conference, we select a trio of
conferences based on several criteria: 1) the
conferences should publish papers on related topics; 2)
the conferences should have varying levels of impact
{very high, high and medium} mimicking submitted
papers reviewed as high accept, accept, borderline
accept; 3) the conferences should have a reasonably
large number of accepted papers and authors. Based on
these criteria, we selected SIGCHI (The ACM
Conference on Human Factors in Computing
Systems), DIS (The ACM conference on Designing
Interactive Systems), and IUI (The ACM Conference
where the Human-Computer Interaction (HCI)
community meets the Artificial Intelligence
community). The papers published in SIGCHI
represent papers rated highly acceptable by SIGCHI
reviewers, DIS papers represent papers rated
acceptable by SIGCHI reviewers, and IUI papers
represent papers rated borderline acceptable.
Excluding authors from industry, we create a dataset
for each conference that contains the accepted papers
and their authors (see Table 1). This dataset contains
592 papers with 813 authors for which we
demographic profiles. We will expand this work to
other conferences in the future.
Table 1: Composition of Our Dataset.
Dataset Accepted Papers Authors Impact Facto
r
SIGCHI17 351 435 87
DIS17 114 231 33
IUI17 64 147 27
Table 2: Demographic Participation from protected groups
in Three Current Conferences.
Gender Ethnicity CStage URank Geoloc
SIGCHI 45.01% 7.69% 52.14% 25.64% 8.26%
DIS 57.89% 31.58% 72.81% 55.26% 11.40%
IUI 39.06% 56.25% 76.56% 28.13% 26.56%
Average 47.07% 18.71% 59.55% 32.33% 11.15%
Multidimensional Demographic Profiles for Fair Paper Recommendation
203

The demographic distribution of the authors in
each conference is summarized in Figure 1. These
clearly illustrate each of the conferences had few
authors from most of the protected groups with the
lowest participation in the highest impact conference,
SIGCHI, with gender being an exception. As an
example, SIGCHI 2017 had only 8.28% non-white
authors, DIS 2017’s authors were only 16.45% non-
white, and IUI 2017 had 27.21% non-white.
We define demographic parity as the participation
rate for each of our demographic features in the pool
created by combining the authors of all three
conferences. Based on the 813 authors in our dataset,
Table 2 presents the average participation in the pool
for each feature and thus the demographic parity that is
our goal.
Figure 1: Protected Group Membership of Authors for Three
Current Conferences.
5.2 Baseline and Metrics
Baseline. Our baseline is the original list of papers that
were chosen by the program committee for SIGCHI
2017 and were represented in the venue. As shown in
Table 2, the distribution of the protected groups in our
baseline is: 45.01% female, 7.69% non-white, 52.14%
junior professors, 25.64% authors from low ranked
universities and 8.26 authors from developing
countries.
Metrics. We evaluate our algorithms’ effectiveness by
calculating Diversity Gain (
𝐷
) of our proposed set of
papers versus the baseline:
𝐷
∑
𝑀𝐼𝑁100, 𝜌
𝑛
(3)
where 𝜌
is the relative percentage gain for each
feature versus the baseline, divided by the total
number of features 𝑛. Each feature’s diversity gain is
capped at a maximum value of 100 to prevent a large
gain in a single feature dominating the value.
By choosing to maximize diversity, it is likely that
the quality of the resulting papers will be slightly
lower. To measure this drop in quality, we use the
average h-index of the paper authors and compute the
utility loss (𝑈𝐿
) for each proposed list of papers using
the following formula:
𝑈𝐿
=
–
* 100
(4)
where 𝑈
is the utility of the proposed papers for
conference i and 𝑈
is the utility of the baseline. We
then compute the utility savings (𝑌
) of papers for
conference i relative to the baseline as follows:
𝑌
100 𝑈𝐿
(5)
We compute the F measure (Jardine, 1971) to examine
the ability of our algorithms to balance diversity gain
and utility savings:
𝐹2∗
∗
(6)
In order to measure how far away from demographic
parity our results are, we calculate the Euclidean
Distance (Draisma, et al., 2014) between our selected
papers and the pool:
DemographicDistance =
∑
𝐹1
𝐹2
2
(7)
where F1 is the participation of each feature in the
proposed list of papers to select and F2 is the feature’s
participation in the pool. Finally, we normalized the
distance values to obtain the similarity percentages
between our results and the pool as shown in the
formula below:
DemographicSimilarity = 1 -
(8)
where MaxD is the largest possible distance between
two vectors in our feature space.
To summarize the ability of the methods to balance
the competing demands of increasing demographic
parity and saving utility, we again apply the F measure
using formula 6 calculated using
DemographicSimilarity and
𝑌
.
5.3 Results
Our recommender system produces ranked list(s) from
which we select to form the accepted papers list with
the overarching goal of increasing the diversity in the
papers. Both methods reported here select papers from
a quality sorted queue and one or more demographic
queue(s). Whenever there are ties in a demographic
queue, those papers are sorted by their quality score.
5.4 Comparison with the Baseline
We report the differences between the accepted papers
in SIGCHI 2017 and the accepted papers produced by
the recommender system described in Section 4 using
0
20
40
60
80
100
F Non‐White Junior Low
RankedU
Developing EPSCoR
numberofauthorsby
percent
SIGCH17 DIS17 IUI17 Pool
KDIR 2021 - 13th International Conference on Knowledge Discovery and Information Retrieval
204
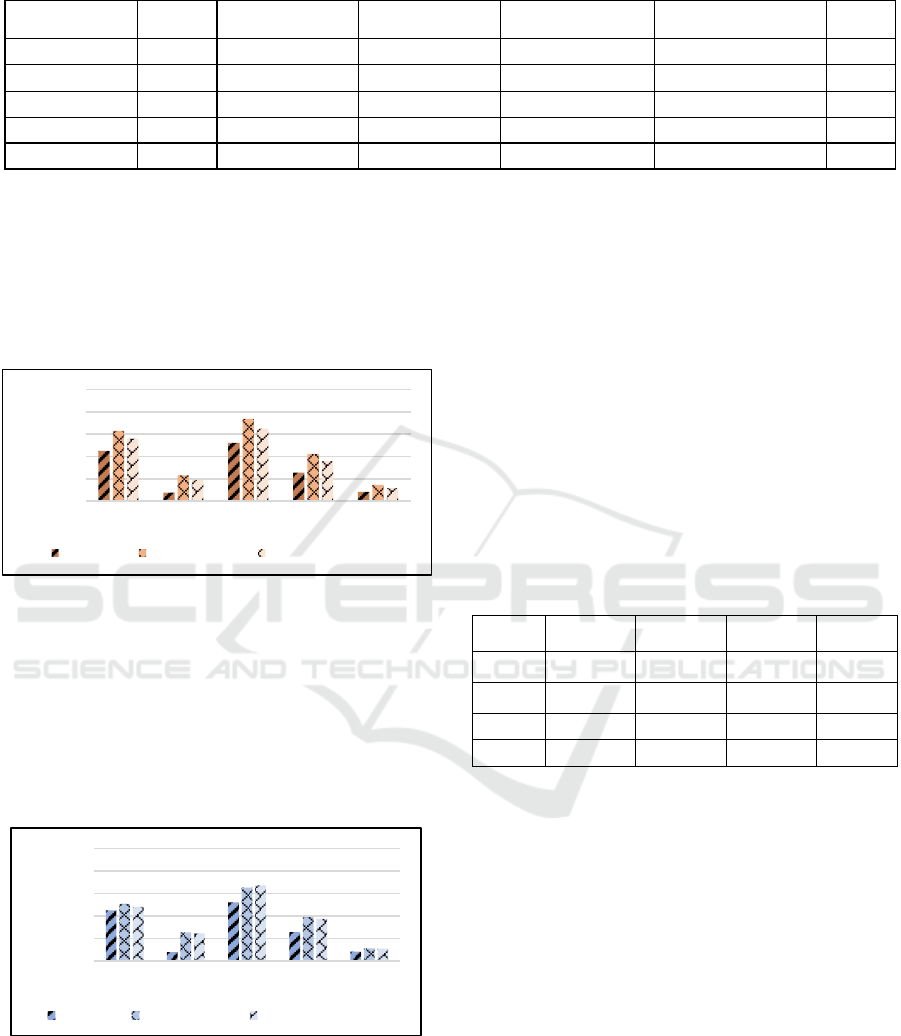
Table 3: Protected Group Participation for the recommender algorithms using Boolean and Continuous profiles.
Feature SIGCHI Overall Divers (B) Overall Divers (C)
Multi-Faceted Divers
(B)
Multi-Faceted Divers
(C)
Pool
Female 45.01% 62.96% 50.71% 56.13% 48.15% 47.07%
Non-White 7.69% 23.08% 25.36% 18.80% 24.50% 18.71%
Junior 52.14% 73.79% 65.24% 64.96% 67.24% 59.55%
Low Ranked Uni. 25.64% 42.45% 39.03% 35.90% 37.32% 32.33%
DevelopCountry 8.26% 14.53% 11.11% 11.68% 10.83% 11.15%
Boolean and Continuous profiles. Looking at Figure
2, we can see that all algorithms succeeded in
increasing the diversity in the recommended papers
for acceptance across all demographic groups when
using the Boolean profiles. However, it is obvious that
Overall Diversity method produced the highest
diversity in all the protected groups.
Figure 2: Improvement in Protected Group Participation
between the SIGCHI2017 and our Paper Recommendation
Algorithms when using Boolean Profiles.
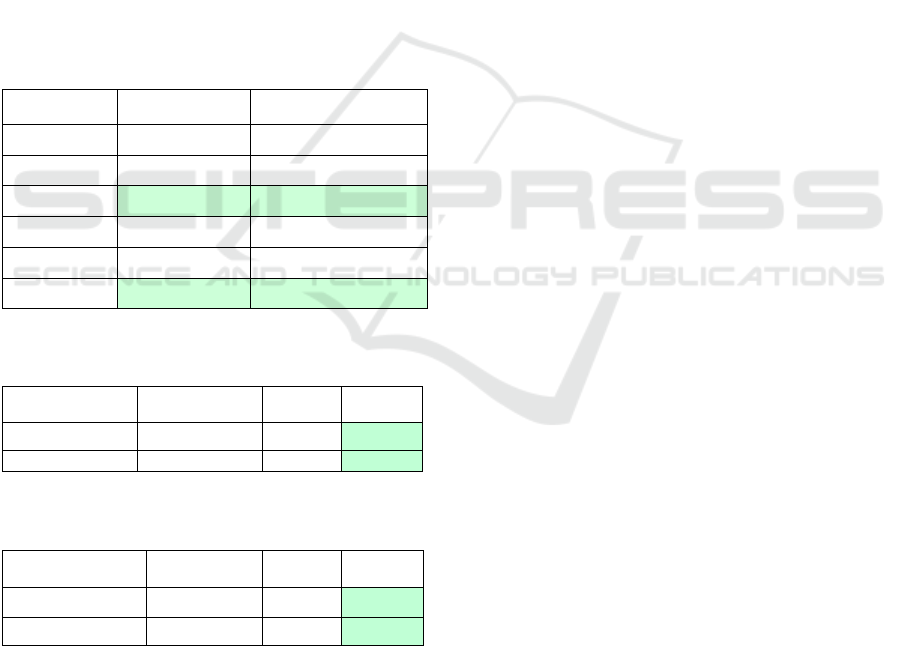
Figure 3 represents the protected groups
participation with the Continuous profiles when
applying our proposed recommendation algorithms.
We can see that all methods succeeded in increasing
the diversity in the recommended papers for
acceptance across all demographic groups.
Figure 3: Improvement in Protected Group Participation
between the SIGCHI2017 and our Paper Recommendation
Algorithms when using Continuous Profiles.
Table 3 compares the participation of the
protected groups between the actual accepted papers
for SIGCHI with the accepted papers proposed by our
two methods, and demographic parity based on the
participation of the protected groups in the pool of
authors in our dataset. We can see that all algorithms
increase the diversity of authors across all protected
groups. With the exception of Junior researchers for
the continuous profile, the Overall Diversity
algorithm increases participation among the protected
groups more than the Multifaceted Diversity
algorithm across all demographics. With the same
exception, the Boolean profile also increases
diversity more than the continuous profile. As
expected, these diversity-based recommendation
methods overcorrected by including more authors
from the protected groups proportionally than in the
pool as a whole.
Table 4: Proportion of Recommended Papers from each
Conference.
Overall
Diversity(B)
Overall
Diversity(C)
Multi-
Faceted(B)
Multi-
Faceted(C)
SIGCHI 265 (75.5%) 218(62.11%) 301 (85.8%)
274
(
78.06%
)
DIS 59 (16.8%) 87 (24.79%) 47 (13.4%)
61
(
17.38%
)
IUI 27 (7.7%) 46 (13.11%) 3 (0.9%) 16 (4.56%)
Papers # 351 351 351 351
The recommended papers are a mix of papers
from the three conferences in our datasets in different
proportions as described in Table 4. The Multi-
Faceted Diversity method selects the highest
proportion of the recommended papers, 85.8% (Bool)
and 78.06% (Cont.), from the actual SIGCHI papers,
but Overall Diversity also selects the majority of its
papers, 75.5% and 62.11%, from the original SIGCHI
selected papers. We further observe that both
algorithms selected the majority of papers from the
demographic queue(s) with only a few from the
quality-sorted queue. The Overall Diversity method
selected 67.24% (Bool) and 66.67% (Cont.) of its
accepted papers from the demographic queue and
only 32.76% (Bool) and 33.33% (Cont.) from the
quality queue. In contrast, the Multi-Faceted
Diversity method selected nearly all of its accepted
papers, 92.88%, from one of the five demographic
queues, and only 7.12% from the quality queue.
0
20
40
60
80
100
F Non‐white Junior LowRanked
U
Developing
AuthorsPercent
SIG‐Actual OverallDiversity Multi‐FacetedDiversity
0
20
40
60
80
100
F Non‐white Junior LowRanked
U
Developing
AuthorPercent
SIG‐Actual OverallDiversity Multi‐FacetedDiversity
Multidimensional Demographic Profiles for Fair Paper Recommendation
205
We also compare the performance of our
algorithms with respect to the quality of the resulting
accepted papers. Table 5 summarizes the diversity
gain (𝐷
), Utility Savings (𝑌
), and F scores for the
accepted papers proposed by each algorithm when
using the Boolean and Continuous profiles. Both
methods obtained Diversity Gains of over 40% for the
proposed set of accepted papers, with the biggest gain
occurring with the Overall Diversity algorithm. The
gains in diversity occur with Utility Savings of
93.47% (B) and 102.49(C) for the Overall Diversity
algorithm versus 97.52% (B) and 102.45 (C) for the
Multi-Faceted Diversity algorithm. Based on these
results, we conclude that the Overall Diversity
algorithm outperforms the Multi-Faceted Diversity
algorithm and when considering author
demographics and aiming for demographic parity, the
quality of the selected papers actually increased.
Table 5: Diversity gain and utility savings for our
algorithms versus the Baseline for Boolean and Continuous
profiles.
Overall Diversity Multi-Faceted Diversity
𝐷
(Bool)
64.58% 46.00%
Y
(Bool) 93.47% 97.52%
F-score (Bool) 76.39 62.51
𝐷
(Cont.) 44.90% 42.50%
Y
(Cont.) 102.49% 102.45%
F-score (Cont) 62.44 60.08
Table 6: Demographic parity similarity and utility savings
for our algorithms versus the baseline (Boolean).
Method
Demographic
Similarity
𝑌
F-score
Overall Diversity 89.15% 93.47% 91.26
Multi-Faceted 95.01% 97.52% 96.24
Table 7: Demographic parity similarity and utility savings
for our algorithms versus the baseline (Continuous).
Method Demographic
Similarity
𝑌
F-score
Overall Diversity 94.80% 102.49% 98.27
Multi-Faceted 95.12% 102.45% 98.44
Diversity-based algorithms may overcorrect and
result in reverse discrimination, or the diversity gains
may all be in one subgroup while other
underrepresented populations are ignored. Tables 6
and 7 show the results when evaluating our
algorithms’ ability to achieve demographic parity with
Boolean and Continuous features, respectively. We
observe that, based on this criteria, the Multifaceted
Diversity algorithm produces results closest to
Demographic Parity, with 95.01% similarity to the
pool and a utility loss of just 2.48% when using
Boolean profiles.
We further observe that the Multifaceted method
produces even better Demographic Parity of 95.12%
when using continuous-valued features and actually
results in a 2.45% increase in utility. This means that,
by considering author diversity and aiming for
demographic parity when selecting papers, the quality
of the papers accepted to the conference could actually
be improved.
6 CONCLUSIONS
We present new recommendation algorithms that
increase diversity when recommending papers for
acceptance in conferences while minimizing any
decrease in quality. Our methods promote diversity by
considering multidimensional demographic author
profiles as well as paper quality when recommending
papers for publication in a conference. Most previous
work focuses on algorithms that guarantee fairness
based on a single, Boolean feature, e.g., race, gender,
or disability. In contrast, we consider gender,
ethnicity, career stage, university rank and geolocation
to profile the authors. We demonstrate our approach
using a dataset that includes authors whose papers
were selected for presentation at conferences in
Computer Science that vary in impact factor to mimic
papers rated by reviewers at different levels of
acceptability. The Overall Diversity method ranks the
papers based on an overall diversity score whereas the
Multi-Faceted Diversity method selects papers that fill
the highest-priority demographic feature first. The
resulting recommended papers were compared with
the baseline in terms of diversity gain and utility
savings, as measured by a decrease in the average h-
index of the paper authors. The Overall Diversity
method increased diversity by 64.58% (using
Boolean-valued features) with only a 6.53% drop in
utility and 44.90% (using Continuous-valued features)
with 2.49% increase in utility. However, the
Multifaceted Diversity method produced results
closest to demographic parity with more than 95%
similarity to the pool. It achieved a 46% gain in
diversity with only a 2.48% drop in utility for Boolean
profiles and a 42.50% gain in diversity with 2.45%
increase in utility for continuous-valued features.
For the future, we will develop new algorithms
that guarantee demographic parity to avoid
overcorrection. Additionally, we will explore dynamic
KDIR 2021 - 13th International Conference on Knowledge Discovery and Information Retrieval
206

hill-climbing algorithms that adjust the
recommendation criteria after each paper selection.
Finally, we will build a larger dataset by incorporating
other trios of conferences and investigate the
effectiveness of deep learning techniques to improve
the diversity for our papers.
REFERENCES
Barak, B. (2018). On double blind reviews in theory
conferences. Windows on Theory.
blog, NamSor. (2018). Understanding NamSor API
precision for Gender inference. Inferring The World's
Gender and Ethnic Diversity using Personal Names.
blog, NamSor. (2019). NamSor US ‘Race’ / Ethnicity
model helps estimate diversity in Chicago Police.
Inferring The World's Gender and Ethnic Diversity
using Personal Names.
Bornmann, L., & Daniel, H. D. (2005). Selection of
research fellowship recipients by committee peer
review. Reliability, fairness and predictive validity of
Board of Trustees' decisions. Scientometrics, 63(2),
297-320.
Bornmann, L., & Daniel, H. D. (2009). The state of h index
research: is the h index the ideal way to measure
research performance?. EMBO reports, 10(1), 2-6.
Cannon, S., Reid, D. A., McFarlane, K., King, L.,
MacKenzie, L., Tadaki, M., and Koppes, M. (2018).
Race and gender still an issue at academic conferences.
The Conversation.
Chandrasekaran, K., Gauch, S., Lakkaraju, P., & Luong, H.
P. (2008, July). Concept-based document
recommendations for citeseer authors. In International
conference on adaptive hypermedia and adaptive web-
based systems (pp. 83-92). Springer, Berlin,
Heidelberg.
Code.org. (2020)., Women computer science graduates
finally surpass record set 17 years ago, but percentages
lag behind. Medium.
Cox, A. R., & Montgomerie, R. (2019). The cases for and
against double-blind reviews. PeerJ, 7, e6702.
Data USA, Computer, engineering, & science occupations..
(2020).
Draisma, J., Horobeţ, E., Ottaviani, G., Sturmfels, B., &
Thomas, R. (2014). The Euclidean distance degree. In
proceedings of the 2014 Symposium of Symbolic-
Numeric Computation (SNC’14). ACM. (pp. 9-16).
Dwork, C., Hardt, M., Pitassi, T., Reingold, O., & Zemel,
R. (2012, January). Fairness through awareness.
In Proceedings of the 3rd innovations in theoretical
computer science conference (pp. 214-226).
eeoc.gov. (n.d.). US Equal Employment Opportunity
Commission.
Farnadi, G., Kouki, P., Thompson, S. K., Srinivasan, S., &
Getoor, L. (2018). A fairness-aware hybrid
recommender system. arXiv preprint
arXiv:1809.09030.
Flaherty, C. (2016). More Faculty Diversity, Not on Tenure
Track. Inside Higher ED.
Flaherty, C. (2018). When Journals Play Favorites. Inside
Higher ED.
Flaherty, C. (2019). Professors Still More Likely Than
Students to Be White. Inside Higher Ed.
Gauch, S., Speretta, M., Chandramouli, A., & Micarelli, A.
(2007). User profiles for personalized information
access. The adaptive web, 54-89.
Google Scholar. 2020. Google. https://scholar.google.com/
Google Scholar (n.d.).
https://scholar.google.com/citations?view_op=top_venues
&hl=en&vq=eng
Guide2Research. (2020). Top Computer Science
Conferences. Guide2Research.
http://www.guide2research.com/topconf/
Hardt, M., Price, E., & Srebro, N. (2016). Equality of
opportunity in supervised learning. arXiv preprint
arXiv:1610.02413.
Harzing, A. (2016). Publish or Perish.
https://harzing.com/resources/publish-or-perish
Human Development Reports. (n.d.). Human Development
Data Center. Human Development Reports.
Inc. US Legal. (n.d.). Protected Group Member Law and
Legal
Definition.https://definitions.uslegal.com/p/protected-
group-member/
Jacob, B. A., & Lefgren, L. (2011). The impact of research
grant funding on scientific productivity. Journal of
public economics, 95(9-10), 1168-1177.
Jardine, N. &. (1971). The use of hierarchic clustering in
information retrieval. Information storage and retrieval,
(pp. 7(5), 217-240.).
Jones, T. M., Fanson, K. V., Lanfear, R., Symonds, M. R.,
& Higgie, M. (2014). Gender differences in conference
presentations: a consequence of self-selection?. PeerJ,
2, e627.
Labille, K., Gauch, S., Joseph, A. S., Bogers, T., & Koolen,
M. (2015). Conceptual Impact-Based Recommender
System for CiteSeerx. In CBRecSys@ RecSys (pp. 50-
53).
Lemire, A. D. (2020, December 3). Double-blind peer
review is a bad idea. Daniel Lemire's blog.
Lerback, J., & Hanson, B. (2017). Journals invite too few
women to referee. Nature News, 541(7638), 455.
Long, C., Wong, R. C. W., Peng, Y., & Ye, L. (2013,
December). On good and fair paper-reviewer
assignment. In 2013 IEEE 13th international
conference on data mining (pp. 1145-1150). IEEE.
Murray, D., Siler, K., Larivière, V., Chan, W. M., Collings,
A. M., Raymond, J., & Sugimoto, C. R. (2019). Gender
and international diversity improves equity in peer
review. BioRxiv, 400515.
National Science Foundation. (2019). Established Program
to Stimulate Competitive Research (EPSCoR). NSF
website.
Nations, U. (2020). The World Economic Situation and
Prospects. 2020. Acessado em, 20.
Palus, S. (2015). Is Double-Blind Review Better?.
American Physical Society.
Multidimensional Demographic Profiles for Fair Paper Recommendation
207

Pannucci, C. J., & Wilkins, E. G. (2010). Identifying and
avoiding bias in research. Plastic and reconstructive
surgery, 126(2), 619.
Protected group. (2020). Wikipedia.
https://en.wikipedia.org/wiki/Protected_group
Santamaría, L., & Mihaljević, H. (2018). Comparison and
benchmark of name-to-gender inference services.
PeerJ Computer Science, 4, e156.
SIGCHI. (2019). Diversity of the Program Committee for
CHI 2020.
Sikdar, S., Marsili, M., Ganguly, N., & Mukherjee, A.
(2016, October). Anomalies in the peer-review system:
A case study of the journal of High Energy Physics. In
Proceedings of the 25th ACM International on
Conference on Information and Knowledge
Management (pp. 2245-2250).
Stelmakh, I., Shah, N. B., & Singh, A. (2019, March).
PeerReview4All: Fair and accurate reviewer
assignment in peer review. In Algorithmic Learning
Theory (pp. 828-856). PMLR.
Sugarman, D. B., Nation, M., Yuan, N. P., Kuperminc, G.
P., Hassoun Ayoub, L., & Hamby, S. (2018). Hate and
violence: Addressing discrimination based on race,
ethnicity, religion, sexual orientation, and gender
identity. Psychology of violence, 8(6), 649.
Times Higher Education (THE). (2020). World University
Rankings.
ComputerScience. Women in Computer Science: Getting
Involved in STEM. ComputerScience.org. (2021, May
5).
Yang, K., & Stoyanovich, J. (2017, June). Measuring
fairness in ranked outputs. In Proceedings of the 29th
International Conference on Scientific and Statistical
Database Management (pp. 1-6).
Zehlike, M., Bonchi, F., Castillo, C., Hajian, S., Megahed,
M., & Baeza-Yates, R. (2017, November). Fa* ir: A fair
top-k ranking algorithm. In Proceedings of the 2017
ACM on Conference on Information and Knowledge
Management (pp. 1569-1578).
Zehlike, M., & Castillo, C. (2020, April). Reducing
disparate exposure in ranking: A learning to rank
approach. In Proceedings of The Web Conference
2020 (pp. 2849-2855).
Zhong, Z. (2018). A Tutorial on Fairness in Machine
Learning. Towards Data Science.
Zhuang, Z., Elmacioglu, E., Lee, D., & Giles, C. L. (2007,
June). Measuring conference quality by mining
program committee characteristics. In Proceedings of
the 7th ACM/IEEE-CS joint conference on Digital
libraries (pp. 225-234).
Zweben, S., & Bizot, B. (2018). 2018 CRA Taulbee survey.
Computing Research News, 30(5), 1-47.
KDIR 2021 - 13th International Conference on Knowledge Discovery and Information Retrieval
208
