
MEDIS: Analysis Methodology for Data with Multiple Complexities
Raluca Portase
a
, Ramona Tolas
b
and Rodica Potolea
c
Technical University of Cluj-Napoca, Cluj, Romania
Keywords:
Data Analysis, Big Data, Preprocessing Methodology, Knowledge Extraction, Real Industrial Data, Metadata
Extraction.
Abstract:
Hidden and unexpected value can be found in the vast amounts of data generated by IoT devices and indus-
trial sensors. Extracting this knowledge can help on more complex tasks such as predictive maintenance or
remaining useful time prediction. Manually inspecting the data is a slow, expensive, and highly subjective
task that made automated solutions very popular. However, finding the value inside Big Data is a difficult task
with many complexities. We present a general preprocessing methodology (MEDIS- MEthdology for prepro-
cessing Data with multiple complexitIeS) consisting of a set of techniques and approaches which address such
complexities.
1 INTRODUCTION
The industry is now approaching the concept of In-
dustry 4.0, considered the fourth industrial revolution
(Lu, 2017). The concept refers to the intelligent net-
working of machines and processes in the industry
with the aid of information and communication tech-
nology, and it is closely related to IoT (Internet of
Things).
In order to integrate various systems to be part of
the big picture of Industry 4.0, companies equipped
their modern devices with various sensors which are
monitoring their behavior (Mourtzis et al., 2016) to
achieve a high production rate with as small as pos-
sible operational costs (Khan et al., 2020). Data col-
lected by these sensors have intrinsic hidden value,
and solutions for exploring and exploiting it need to
be developed to further expand it in the context of
IoT and predictive maintenance. Once integrated into
a predictive maintenance flow, benefits like avoid-
ing unnecessary equipment replacement, just in time
maintenance, saving data storage costs, improvement
of process safety, and increased efficiency can be
tackled (Hashemian, 2010), (Edwards et al., 1998).
Another significant reason for processing the sig-
nals of the appliance sensors is to detect anomalies in
their communication flow and predict the damage of
the sensors themselves. Their failure may result in se-
vere damage to critical processes (Wang et al., 2001).
Visual inspection is the base method and the old-
a
https://orcid.org/0000-0002-8985-4728
b
https://orcid.org/0000-0002-6236-1114
c
https://orcid.org/0000-0002-7051-3691
est task of predicting something might break in the fu-
ture (Hashemian, 2010). Unfortunately, it cannot be
applied given various data-related complexities (the
difficulties caused by the fact that data is unstructured
and the volume of the data is not suitable for manual
inspection). Common challenges are the data char-
acteristics, together with heterogeneity and lack of
structure and quality (noisy or incompleteness). Other
complexities (such as data dimensionality, scalabil-
ity, requirement for real-time/due-time processing, vi-
sualization and interpretability, global vs local opti-
mal feature extraction) were also identified in similar
works (Bol
´
on-Canedo et al., 2015), (Storcheus et al.,
2015), (Cirillo and Valencia, 2019).
The purpose of this paper is to propose a general
preprocessing methodology (MEDIS) for Big Data
analysis. We propose several strategies to handle real
data complexities usually identified in unstructured
data. Despite the dynamic nature of the field, this
topic was poorly explored. To the best of our knowl-
edge, the studies in this domain are very general,
following the entire process of extracting knowledge
from Big Data and not tackling specific challenges of
the preprocessing phase. Compared to previous work,
our methodology has a smaller granularity in which
we propose an analysis of specificity and usage.
The rest of the paper is organized as follows: Sec-
tion 2 presents a brief overview of selected related
work on data analysis and concrete application ex-
amples. Section 3 motivates the need for a general
methodology for data preprocessing. In Section 4, the
decomposition of our proposed methodology is pre-
sented. Strategies for handling specific data complex-
Portase, R., Tolas, R. and Potolea, R.
MEDIS: Analysis Methodology for Data with Multiple Complexities.
DOI: 10.5220/0010655100003064
In Proceedings of the 13th International Joint Conference on Knowledge Discovery, Knowledge Engineering and Knowledge Management (IC3K 2021) - Volume 1: KDIR, pages 191-198
ISBN: 978-989-758-533-3; ISSN: 2184-3228
Copyright
c
2021 by SCITEPRESS – Science and Technology Publications, Lda. All rights reserved
191

ities are illustrated in Section 5, while in Section 6 we
present a small case study on a snapshot of real in-
dustrial data. Finally, section 7 ends the paper with
conclusions.
2 RELATED WORK
Companies equipped their appliances with many sen-
sors that monitor the different properties of the appli-
ance. These sensors produce a considerable amount
of data that needs to be processed to benefit from
the extraction of the meaningful information (Rat-
ner, 2017). Extracting this information significantly
impacts next-level processes like predictive mainte-
nance, as it is used as input for complex systems. To
be compliant with the rest of the systems, the informa-
tion extracted from the recordings of the monitoring
sources (for example, sensors) must be reliable and
as informative as possible. Identifying any source of
failure as soon as possible can prevent the upper-level
system from giving incorrect predictions.
Even if the raw data is initially recorded for a spe-
cific purpose, there is more value hidden in large data,
and it can be used for reasons that go even further
from the one it was initially stored for. Therefore, we
propose building even more onto the existing data to
maximize the exploitation of its value to open new re-
search directions with direct applicability in various
economic fields, especially industry. This is done by
creating a methodology for filtering, visualizing, and
correlating the signals of various sensors.
A concrete example of the impact of our work is in
the predictive and preventive maintenance area (Sipos
et al., 2014), (Pech et al., 2021). Predictive mainte-
nance is domain-specific, with limited (if at all) abil-
ity to apply beyond the specific domain or even for
different devices. In contrast to this, MEDIS could be
easily projected onto various fields. To the best of our
knowledge, the research uses data already processed
for predictive maintenance tasks. In real-world appli-
cations, the data from sensors is big unstructured data
that needs several processing steps before any predic-
tive analysis can be done. In this context, our work
can be a driving vehicle towards predictive main-
tenance by incorporating domain-independent auto-
mated preprocessing steps. This can help multiple
industries reduce both the maintenance costs and the
system’s reliability directly impacted by components
or complete system malfunction, or even downtime.
Processing the massive amount of recorded data is
both a big opportunity and a challenge for the indus-
try, and it attracted much attention from researchers
and companies around the world. However, at the mo-
ment, there is no standard way for approaching Big
Data projects for real industrial data. Several works
tackle this topic, works that, according to the authors
of (Hashemian, 2010), are divided into three cate-
gories: methods that use signals from existing process
sensors, solutions that use signals from test sensors,
and solutions based on injecting test signals into the
equipment to measure its response.
While the last category has the disadvantage of de-
veloping the solution using test data (it is not guaran-
teed to have the same behavior with real-world data),
the second solution is to use test sensors attached only
to a part of the appliances and using the collected real
data and scenarios further on. Having exposed the
identified drawbacks of the other categories, this work
belongs to the first category, exploiting the value of
data collected from in-place running devices.
As emphasized by the authors of other works on
this topic (Smith et al., 2006), a general model for un-
derstanding and exploring the data would be a power-
ful tool for both teaching and learning due to its inno-
vative potential. Due to the massive growth of the data
mining area, some efforts have been made that seek
the establishment of standards such as KDD (Fayyad
et al., 1996), SEMMA (Miner, ), and CRISP-DM
(Wirth and Hipp, 2000). All of these methodologies
are composed of several iterative steps covering the
entire process, from domain understanding to mod-
eling, assessment, and deployment of the data. The
existing methodologies are generic and do not focus
on preprocessing data and handling specific big data
complexities that might arise in real-world datasets.
3 VARIETY OF DATA
COMPLEXITIES: THE NEED
OF A GENERAL
METHODOLOGY FOR
PREPROCESSING
Real big data is characterized by several complexi-
ties known in the literature by the Seven V’s of Big
Data: volume, visualization, velocity, variety, verac-
ity, value, and variability (Uddin et al., 2014).
In the context of big industrial data, the large vol-
ume is given by the large amount of recorded data
from all devices and different types of sensors. The
frequency of the received data is different depending
on the type of the recorded property. In the case of
compound records, all components must be received
to compute the compound value. The variety of val-
ues and the existence of simple and composite data
suggests a heterogeneous analysis approach. Some
KDIR 2021 - 13th International Conference on Knowledge Discovery and Information Retrieval
192

special steps must be defined and applied to such
cases.
The performance of the processing steps is influ-
enced by the quality and quantity of the used data
set. Moreover, the performance is also affected by the
frequency of noisy values, incompletely defined data,
incorrectly sent or duplicated records. The strategy
should soundly discriminate between noisy data (in-
correct registered or stored) and outliers in the clean-
ing process. Warnings of a malfunction should be
identified, preserved, and processed to prepare the
field for a predictive and preventive maintenance flow.
This paper is strongly focused on the value di-
mension of data: identification of useful or potential
valuable information from the massive amount of an-
alyzed data. As far as we know, at the moment, there
is no standard way to approach Big Data projects from
industrial applications. For this reason, we created a
methodology to fill this gap that can be used in future
projects.
Given the identified complexities, we developed
MEDIS, a general preprocessing methodology con-
taining strategies for jointly tackling each complexity
and aspect. Compared to the other existing method-
ologies (Fayyad et al., 1996), (Miner, ), (Wirth and
Hipp, 2000), our approach has a smaller granularity
and bigger specificity. In the next section, we present
our proposed MEDIS methodology alongside a de-
scription of its steps.
4 METHODOLOGY FOR DATA
ANALYSIS
We propose a methodology decomposition with a sys-
tematic strategy illustrated in Figure 1. Since the fo-
cus of our work is the preprocessing part, we are go-
ing to represent the source layer and processing layer
as black boxes.
4.1 Data Representation as Time Series
The data from industrial data sets is mostly a col-
lection of observations collected sequentially in time,
usually referred to as time series. These observations
can be collected at equally-spaced time points. In this
case, we use the notation f
t
, where we index the set
of observations by t, the time at which each observa-
tion was taken. We refer to these types of signals as
periodic signals, and we are abstracting them as can
be seen in equation 1.
f
t
, t = (...., −1, 0, 1, 2, ....) (1)
If the observations were not taken at equally
spaced points then we use the notation f
ti
, with i =
(1, 2, ...). In this case (t
i
− t
i−1
) is not necessarily
equal to one. We refer to these types of signals as
non-periodic signals and their abstraction can be seen
in equation 2.
f
ti
, i = (1, 2, ....) (2)
The information about the type of signals present
in the processed data set might not be available. In
this case, an algorithm for finding the data periodicity
should be applied to infer this type of metadata about
the processed dataset.
4.2 Business Understanding
Even though understanding the businesses and pro-
cess of data collection is specific for each dataset, we
identified two main steps that must be done: process
understanding and problem statement. Given the
specificity of this phase and the generality of our pro-
cessing methodology, it will remain a subject for fu-
ture work.
4.3 Descriptive and Exploratory
Analysis
4.3.1 Syntactic Data Exploration
A preliminary syntactic analysis should be made to
familiarize with the processed data set and understand
its representation. This step helps tackle the volume
complexity of the data because the output of the step
is the filtered data set: all the records that are not valid
from a syntactical point of view are eliminated.
A syntactic analysis should include the following
steps:
1. Noise Analysis and Removal. For data recorded
from sensors, noise is expected from both trans-
mission and recording. In a high-dimensional
classification problem, conventional classification
rules using all features perform no better than
random guesses due to noise accumulation (Hall
et al., 2008). Thus, noise analysis and removal
are crucial steps in cleaning the data.
2. Removal of Duplicates. The entries representing
the same signal are sent simultaneously with the
same values.
There are several reasons for the appearance of
duplicate data. They might arise due to an error in
the recording system, transmission, or receiving.
After analyzing and understanding why this data
arises, cleaning duplicate data has to be done as
part of cleaning the initial dataset.
MEDIS: Analysis Methodology for Data with Multiple Complexities
193
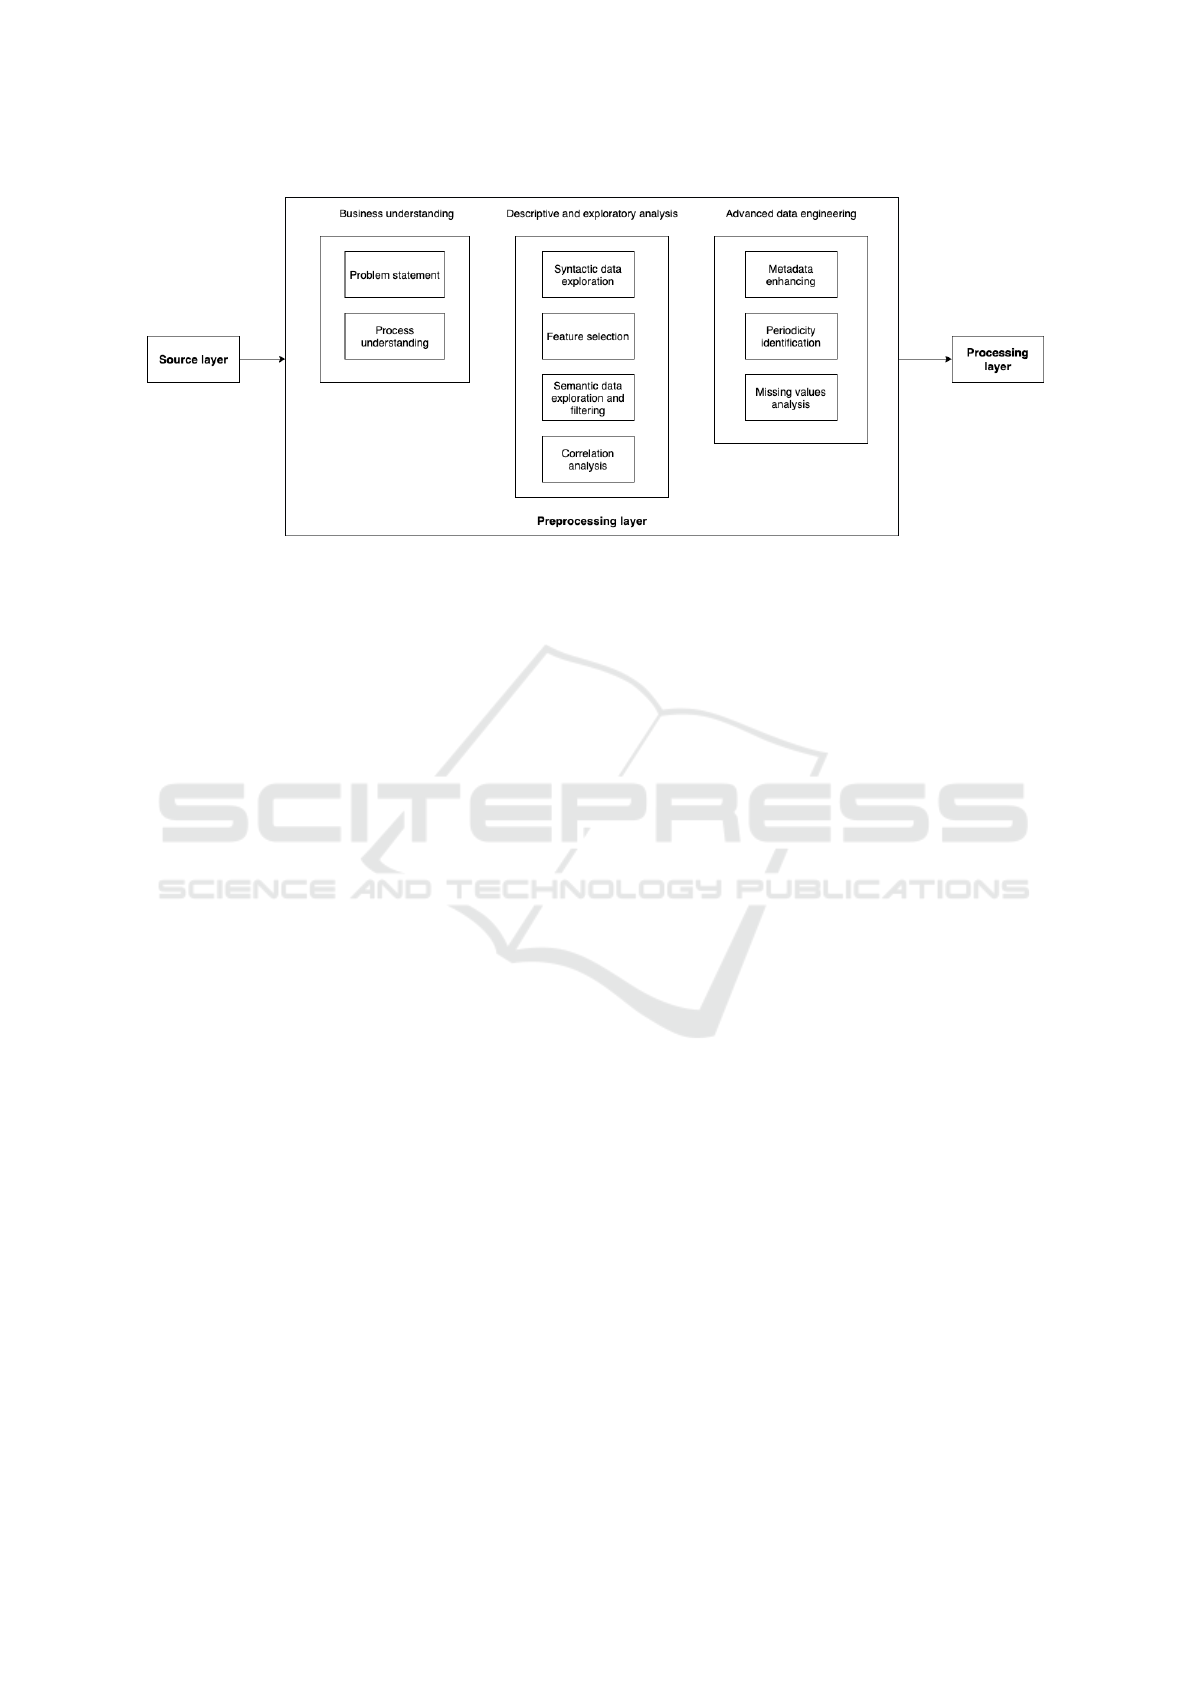
Figure 1: General processing model for data analysis.
3. Eliminate Syntactically Incorrect Data.
For the statistical accuracy of any processing tech-
niques, dimension reduction and variable selection
play pivotal roles in analyzing high-dimensional data.
The work (Chira et al., 2020) presents a data set pro-
cessing technique where a significant percentage from
the data was dropped using syntactic data processing.
Using the data representation introduced in sec-
tion 4.1 a syntactic data exploration on a signal f
t
will
eliminate those values of t for which f
t
has an invalid
value. The equation 3 presents the signal under pro-
cessing, f
t
before syntactic processing where we can
see that at timestamp t
3
we have an invalid value of the
signal marked with red color. After syntactic process-
ing the signal f
t
has fewer values because the value
transmitted at timestamp t
3
was eliminated, as it can
be seen in 4.
f
t
, t = (t
1
, t
2
, t
3
, t
4
, ...) (3)
↓
f
t
, t = (t
1
, t
2
, t
4
, ...) (4)
4.3.2 Select Relevant Features Describing the
Signals
A set of features describes each signal from the data
set. A manual or automated analysis of these fea-
tures and their meaning should be made. The out-
put of the step is a data set reduced by horizontal di-
mension. This step is essential in tackling the volume
complexity because the resulting data set will occupy
less memory space and simultaneously less process-
ing time.
The value of the processed signal f
t
can be ex-
pressed as a simple value or a set of features. Most of
the time, when we process real industrial data, we find
ourselves in the second situation. In that case, the pro-
cessed signals, f
t
, are composed of a set of features,
as can be seen in equation 5.
Some features might not be relevant in the context
of the current problem statement ( f eature
3
in the case
of the signal exposed in equation 5). Some of them
can also be redundant, bringing no new knowledge.
Those features should be eliminated, and a smaller set
will better and faster characterize the signal f
t
. Identi-
fying discriminative features is also crucial for reduc-
ing computational time. The equation 6 is presenting
the signal f
t
introduced in equation 5 after the step of
feature selection was applied.
f
ti
= [ f eature
1
, f eature
2
, f eature
3
, ... f eature
n
] (5)
↓
f
ti
= [ f eature
1
, f eature
2
, ... f eature
n
] (6)
The topic of feature selection was in the attention
of the researchers for a long time, and various meth-
ods were identified. Among the most popular strate-
gies are filter, wrapper, and embedded methods. The
filter methods evaluate each feature individually by
using its general statistical properties. The proper-
ties can be correlation-based, similar to the work (Lei
Yu leiyu, 2003). However, methods from this cate-
gory have the disadvantage of not interacting with the
classifier algorithm (V. Bol
´
on-Canedo, 2014).
The wrapper approaches use learning algorithms
to detect the most relevant set of features and are
considered to be generally computationally expensive
(G. Chandrashekar, 2014). Approaches from these
categories include forward selection (H. Liu, 2012),
backward elimination (Shilaskar and Ghatol, 2013),
and recursive feature elimination (Ke Yana, 2015).
A review and comparison of the most recent hy-
brid approach in a microarray data analysis context is
presented in literature (NADA ALMUGREN, 2019).
KDIR 2021 - 13th International Conference on Knowledge Discovery and Information Retrieval
194

Embedded methods are a type of combination of fil-
ter and wrapper methods (Lu, 2019), (Haoyue Liu,
2019).
4.3.3 Semantic Data Exploration and Filtering
The output of the current step is a data set that is se-
mantically filtered. The operations proposed for this
step are the following ones:
1. Transform the data, if needed, to represent it in the
appropriate processing format. The data might not
be with a ready-to-process structure. In this case,
the initial structure of the data should be used to
obtain a form of data easy to process. Several op-
eration types like composing or splitting might be
needed in this respect.
2. Use the new structure of the data to filter the data
further. Apply the specific processes to filter out
invalid semantic entities.
3. Differentiate the anomalies from the outliers.
Outlier is a legitimate data point that is far away
from the mean or median in a distribution. An
anomaly is an illegitimate data point generated by
a different process than the process that generated
the rest of the data. There are situations where it
is challenging to distinguish between outliers and
anomalies, and the literature exposes multiple ap-
proaches to identifying anomalies in data. The
authors present in (Nedelcu et al., 2017) a ma-
chine learning approach for detecting anomalies
from an EEG data set.
4. After the anomalies are detected in the step above,
they should be excluded from the dataset since
they are noise from the perspective of future pro-
cessing.
4.3.4 Signal Correlation: Eliminate Redundant
Signals
There might be different signals in a large data set
that actually express the same information about the
state of the observed process. Retaining both (or mul-
tiple) such signals is overhead from a memory point
of view. Detecting signals that hold the same infor-
mation can be done by correlating the signals from
the data set. Once correlated, we can identify trans-
mission anomalies, such as situations when signals
are correlated, but the correlation is not present for
a short time. That could be a transmission error. Usu-
ally, data is not aligned, making a direct correlation
not applicable. This issue can be tackled by interpo-
lation, followed by resampling.
Interpolation is a method for smoothing data val-
ues by filling gaps of missing data with neighbors’
(averaged) values. In this case, interpolation is used
to generate values within time intervals in which no
signals are sent. Depending on the type of signal and
its behavior, multiple methods of interpolating signals
can be used, including linear, polynomial methods or
methods related to previous or future values (Powell
et al., 1981).
Resampling is extracting from the function gen-
erated at the interpolation step values at equal rates.
We obtain a new signal with the same trend as the
original signal. The equal sample rate makes it possi-
ble to correlate with another type of signal for which
we applied the same procedure. A common time
frame must be found for all signals to take all received
records into account.
4.4 Advanced Data Engineering
4.4.1 Enhance with Metadata from Particular
Features of the Dataset
Visual inspection is a difficult task given the difficul-
ties caused by the fact that data is unstructured, and
the volume of the data is not suitable for manual in-
spection. Independently of how complex and large
the data is, an initial visual inspection is valuable as it
allows the identification of common patterns in data.
This is the reason why the task of visual inspection is
applicable even in the actual context of the data.
Particular metadata can be inferred and further uti-
lized in the process phase by using various visualiza-
tion techniques. For example, if the data set is the ob-
servation made on a home appliance with running cy-
cles (oven, washing machine), detecting those cycles
is an appropriate step in preprocessing the data be-
cause some aspects might be relevant only inside the
data running cycles. A general approach of prepro-
cessing operations for exploring and extracting valu-
able knowledge from a large set of industrial data
characterized by a multitude of complexities is pre-
sented in work (Olariu et al., 2020) that exemplifies
how the identification of cycles and applying the cy-
cle presence metadata can improve the results of the
correlation of the signals process.
This processing step is formalized by equations 7
and 8. Using the representation of the processed sig-
nal defined in 7, the metadata enhancement effect on
the same signal can be observed in equation 8 where
a new feature is added for the processed signal.
f
ti
= [ f eature
1
, f eature
2
, ... f eature
n
] (7)
↓
f
ti
= [ f eature
1
, f eature
2
, ... f eature
n
, f eature
n+1
] (8)
The number of added features can vary, and it is
particular to the characteristics of the data.
MEDIS: Analysis Methodology for Data with Multiple Complexities
195

4.4.2 Data Periodicity Identification
This data feature is essential to be identified because
knowledge can be inferred from it. Suppose a signal is
transmitted periodically, and at a particular time, the
signal is not at the expected period in the data set. In
that case, we can deduce that the sensor or data trans-
mission systems have a fault. An algorithm for data
periodicity identification (Puech et al., 2019), (Elfeky
et al., 2005) should be applied if there is no available
information about the signal’s periodicity. Identifying
data periodicity is also vital in finding missing values
and duplicate transmissions.
5 CHOOSING THE STRATEGY
ACCORDING TO THE
IDENTIFIED COMPLEXITIES
A multitude of complexities can characterize the pro-
cessed data. Depending on the data’s identified com-
plexities, we should apply specific steps from the de-
fined methodology. The data complexities that we
identified in our experiments and other related works
in the field (Kaisler et al., 2013),(Katal et al., 2013),
(Uddin et al., 2014) are presented below.
Large Volume of Data: Big data is by definition an
amount of data just beyond technology’s capability to
store, manage and process efficiently.
Unstructured Data: Data can be recorded by sev-
eral sensors or logs and most of the times it is not
structured. This may cause significant challenges that
can lead to analytic sprawl.
Heterogeneity: Data tends to be different from all
perspectives: data types, value, recording method.
Heterogeneity is one of the biggest challenges in
modern data analysis caused by the effects of different
factors introduced during data collection procedures.
Velocity: Data velocity refers to the speed of data
creation, streaming, and aggregation. This character-
istic is not limited to the speed of incoming data and
the speed at which the data flows, making traditional
systems incapable of performing the analysis on data
constantly in motion.
Variety: Data variety is a measure of the richness
of the data representation. Due to non-aligned data
structures and inconsistent data semantics, it is prob-
ably the biggest obstacle from an analytic perspective.
Value: Since the volume of big data constantly in-
creases implicitly, the value of different data records
decreases in proportion due to several factors such as
age, type, quantity, and richness of information.
Variability: Variability considers the inconsisten-
cies of the data flow. Data loads are challenging
to maintain due to peaks in data loads when certain
events occur.
Complexity: Complexity measures the degree of
interconnectedness and interdependence in big data
structures in a manner that a small change in a few
elements can create a ripple across the system and af-
fect its behavior.
We propose a strategy for identifying and handling
each complexity in the processed data set for the iden-
tified data complexities. The correspondence between
complexities and strategies is made at the end of this
chapter.
The business understanding steps from the
methodology defined in section 4.2 should always be
applied before doing complex preprocessing. Pro-
cessing steps defined in section 4.3 and 4.4 are cre-
ated in order to handle real complexities existent in
data. Given identified complexities in data, a process-
ing strategy to bypass those complexities should be
applied.
Table 1: Identifiers of the MEDIS steps.
Step Identifier
Syntactic data exploration - SyExpl.NAR
Noise analysis and removal
Syntactic data exploration - SyExpl.DR
Duplicates removal
Syntactic data exploration - SyExpl.SIV
Eliminate incorrect values
Feature selection FeatSel
Semantic data exploration SemExpl
Signal correlation SignCorr
Metadata enhancing MetaEnh
Periodicity identification PeriodIden
Missing values MissingVals
We are using an identifier for better visualization
and understanding of each defined step. The iden-
tifiers can be seen in Table 1. Table 2 contains the
complexities presented above, and it maps each com-
plexity to the steps from MEDIS that are suitable for
that complexity. Given our mapping of solutions for
each possible complexity, an automated process can
be done for preprocessing and data analysis.
KDIR 2021 - 13th International Conference on Knowledge Discovery and Information Retrieval
196

Table 2: Mapping MEDIS steps to data complexities.
Complexity Compatible steps
Large volume of data SyExpl
FeatSel
SemExpl
SignCorr
Unstructered data SemExpl
MissingVals
MetaEnh
Heterogeneity MetaEnh
SemExpl
PeriodIden
Velocity MissingVals
PeriodIden
Variety MetaEnh
SemExpl
Value SemExpl
MissingVals
Variability FeatSel
MissingVals
SyExpl.SIV
Complexity SignCorr
MetaEnh
6 CASE STUDY
For validating the methodology, we used samples of
real industrial data. The data represents the recorded
logs from three different types of modern smart home
appliances and are described in 3. When describing
the data we replaced the real timestamps with a times-
tamp identifier for confidentiality reasons.
Table 3: Datasets used for methodology validation.
Id Start time End time
App1 year1-month1-day22 year1-month1-day30
App2 year1-month1-day1 year1-month1-day11
App3 year1-month2-day18 year1-month3-day16
When we applied the step SyExpl.DR from the
methodology we eliminated in average 27.75% of the
data because we found them as being duplicates.
When we applied FeatSel step we reduced the di-
mensionality of the data by selecting 11 features from
a total of 27. By applying step PeriodIden we found
4 sensors that transmit data periodically from 35 sen-
sors for one of the appliances studied. Step Missing-
Vals determined a decrease in the size of the dataset
by 2% for App1. On the same appliance, we reduced
the dataset by 2.44% by using SyExpl.SIV step from
the methodology.
The concrete algorithms for periodicity detection,
duplicate signals and missing values identification
used in this experiments are presented in (Tolas et al.,
2021).
7 CONCLUSIONS
Big data is all around us and comes from multiple
sources. Before applying complex processing steps
to data, it needs to be understood and preprocessed.
In this paper, we presented a methodology (MEDIS)
for preprocessing big data, which consists of several
approaches that can be used in order to handle real
data complexities. The general methodology is orga-
nized in three main steps: business understanding and
data representation, descriptive and exploratory anal-
ysis, and data engineering in which we both filter the
existing data and enhance it by adding metadata in-
formation.
Current research in this area is concentrated either
on processing structured data such as logs from sys-
tems or on knowledge extraction. Our work’s inno-
vation consists of a new unified approach to process
hybrid data. We are doing this by considering at the
same time processing of Big Data and knowledge ex-
traction from unstructured data, thus combining even
more complexity dimensions. Moreover, our method-
ology creates the base for future automation of data
analysis and preprocessing.
REFERENCES
Bol
´
on-Canedo, V., S
´
anchez-Maro
˜
no, N., and Alonso-
Betanzos, A. (2015). Recent advances and emerging
challenges of feature selection in the context of big
data. Knowledge-Based Systems, 86:33–45.
Chira, C., Portase, R., Tolas, R., Lemnare, C., and Potolea,
R. (2020). A system for managing and processing in-
dustrial sensor data: Sms. In 2020 16th IEEE Interna-
tional Conference on Intelligent Computer Communi-
cation and Processing (ICCP). IEEE.
Cirillo, D. and Valencia, A. (2019). Big data analytics for
personalized medicine. Current opinion in biotech-
nology, 58:161–167.
Edwards, D. J., Holt, G. D., and Harris, F. (1998). Pre-
dictive maintenance techniques and their relevance to
construction plant. Journal of Quality in Maintenance
Engineering.
Elfeky, M. G., Aref, W. G., and Elmagarmid, A. K. (2005).
Periodicity detection in time series databases. IEEE
Transactions on Knowledge and Data Engineering,
17(7):875–887.
MEDIS: Analysis Methodology for Data with Multiple Complexities
197

Fayyad, U., Piatetsky-Shapiro, G., and Smyth, P. (1996).
The kdd process for extracting useful knowledge from
volumes of data. Comunications of the ACM.
G. Chandrashekar, F. S. (2014). A survey on feature selec-
tion methods. Computers & Electrical Engineering,
41(1):16–28.
H. Liu, H. M. (2012). Feature selection for knowledge dis-
covery and data mining. Springer Science & Business
Media, 454.
Hall, P., Pittelkow, Y., and Ghosh, M. (2008). Theoreti-
cal measures of relative performance of classifiers for
high dimensional data with small sample sizes. Jour-
nal of the Royal Statistical Society: Series B (Statisti-
cal Methodology), 70(1):159–173.
Haoyue Liu, Meng Chu Zhou, Q. L. (2019). An embedded
feature selection method for imbalanced data classifi-
cation. IEEE, JOURNAL OF AUTOMATICA SINICA,
6.
Hashemian, H. M. (2010). State-of-the-art predictive main-
tenance techniques. IEEE Transactions on Instrumen-
tation and measurement, 60(1):226–236.
Kaisler, S., Armour, F., Espinosa, J. A., and Money, W.
(2013). Big data: Issues and challenges moving for-
ward. In 2013 46th Hawaii International Conference
on System Sciences, pages 995–1004. IEEE.
Katal, A., Wazid, M., and Goudar, R. H. (2013). Big data:
issues, challenges, tools and good practices. In 2013
Sixth international conference on contemporary com-
puting (IC3), pages 404–409. IEEE.
Ke Yana, D. Z. (2015). Feature selection and analysis on
correlated gas sensor data with recursive feature elim-
ination. Elsevier, 212.
Khan, W. Z., Rehman, M., Zangoti, H. M., Afzal, M. K.,
Armi, N., and Salah, K. (2020). Industrial internet of
things: Recent advances, enabling technologies and
open challenges. Computers & Electrical Engineer-
ing, 81:106522.
Lei Yu leiyu, H. L. (2003). Feature selection for high-
dimensional data: A fast correlation-based filter solu-
tion. Proc. Int. Conf. Machine Learning, 3:856–863.
Lu, M. (2019). Embedded feature selection accounting for
unknown data heterogeneity. Elsevier, Expert Systems
with Applications, 119.
Lu, Y. (2017). Industry 4.0: A survey on technologies, ap-
plications and open research issues. Journal of indus-
trial information integration, 6:1–10.
Miner, S. E. Seema methdology, sas institute.
Mourtzis, D., Vlachou, E., and Milas, N. (2016). Industrial
big data as a result of iot adoption in manufacturing.
Procedia cirp, 55:290–295.
NADA ALMUGREN, H. A. (2019). A survey on hy-
brid feature selection methods in microarray gene ex-
pression data for cancer classification. IEEE Access,
7:78533–78548.
Nedelcu, E., Portase, R., Tolas, R., Muresan, R., Dinsore-
anu, M., and Potolea, R. (2017). Artifact detection in
eeg using machine learning. In 2017 13th IEEE Inter-
national Conference on Intelligent Computer Commu-
nication and Processing (ICCP), pages 77–83. IEEE.
Olariu, E., Tolas, R., Portase, R., Dinsoreanu, M., and Po-
tolea, R. (2020). Modern approaches to preprocessing
industrial data. In 2020 16th IEEE International Con-
ference on Intelligent Computer Communication and
Processing (ICCP). IEEE.
Pech, M., Vrchota, J., and Bedn
´
a
ˇ
r, J. (2021). Predictive
maintenance and intelligent sensors in smart factory.
Sensors, 21(4):1470.
Powell, M. J. D. et al. (1981). Approximation theory and
methods. Cambridge university press.
Puech, T., Boussard, M., D’Amato, A., and Millerand, G.
(2019). A fully automated periodicity detection in
time series. In International Workshop on Advanced
Analysis and Learning on Temporal Data, pages 43–
54. Springer.
Ratner, B. (2017). Statistical and Machine-Learning Data
Mining:: Techniques for Better Predictive Modeling
and Analysis of Big Data. CRC Press.
Shilaskar, S. and Ghatol, A. (2013). Feature selection for
medical diagnosis: Evaluation for cardiovascular dis-
eases. Expert Syst. with Applications, 40.
Sipos, R., Fradkin, D., Moerchen, F., and Wang, Z. (2014).
Log-based predictive maintenance. In Proceedings of
the 20th ACM SIGKDD international conference on
knowledge discovery and data mining, pages 1867–
1876.
Smith, P., Apple, D., Beyerlein, S., and Holmes, C. (2006).
Methodology for creating methodologies. Faculty
Guidebook. Lisle, Illinois: Pacific Crest, pages 371–
4.
Storcheus, D., Rostamizadeh, A., and Kumar, S. (2015). A
survey of modern questions and challenges in feature
extraction. In Feature Extraction: Modern Questions
and Challenges, pages 1–18.
Tolas, R., Portase, R., Iosif, A., and Potolea, R. (2021). Pe-
riodicity detection algorithm and applications on iot
data. In 20th International Symposium on Parallel and
Distributed Computing (ISPDC 2021).
Uddin, M. F., Gupta, N., et al. (2014). Seven v’s of big data
understanding big data to extract value. In Proceed-
ings of the 2014 zone 1 conference of the American
Society for Engineering Education, pages 1–5. IEEE.
V. Bol
´
on-Canedo, N. S
´
anchez-Marono, A. A.-B. J. M. B.
F. H. (2014). A review of microarray datasets and ap-
plied feature selection methods. Information Sciences,
282:1110135.
Wang, P., Vachtsevanos, G., et al. (2001). Fault prognostics
using dynamic wavelet neural networks. AI EDAM,
15(4):349–365.
Wirth, R. and Hipp, J. (2000). Crisp-dm: Towards a stan-
dard process model for data mining. Proceedings of
the 4th International Conference on the Practical Ap-
plications of Knowledge Discovery and Data Mining.
KDIR 2021 - 13th International Conference on Knowledge Discovery and Information Retrieval
198
